Cities with the Lowest Female Poverty Level in New Jersey
RELATED REPORTS & OPTIONS
Lowest Poverty | Female
New Jersey
Compare Cities
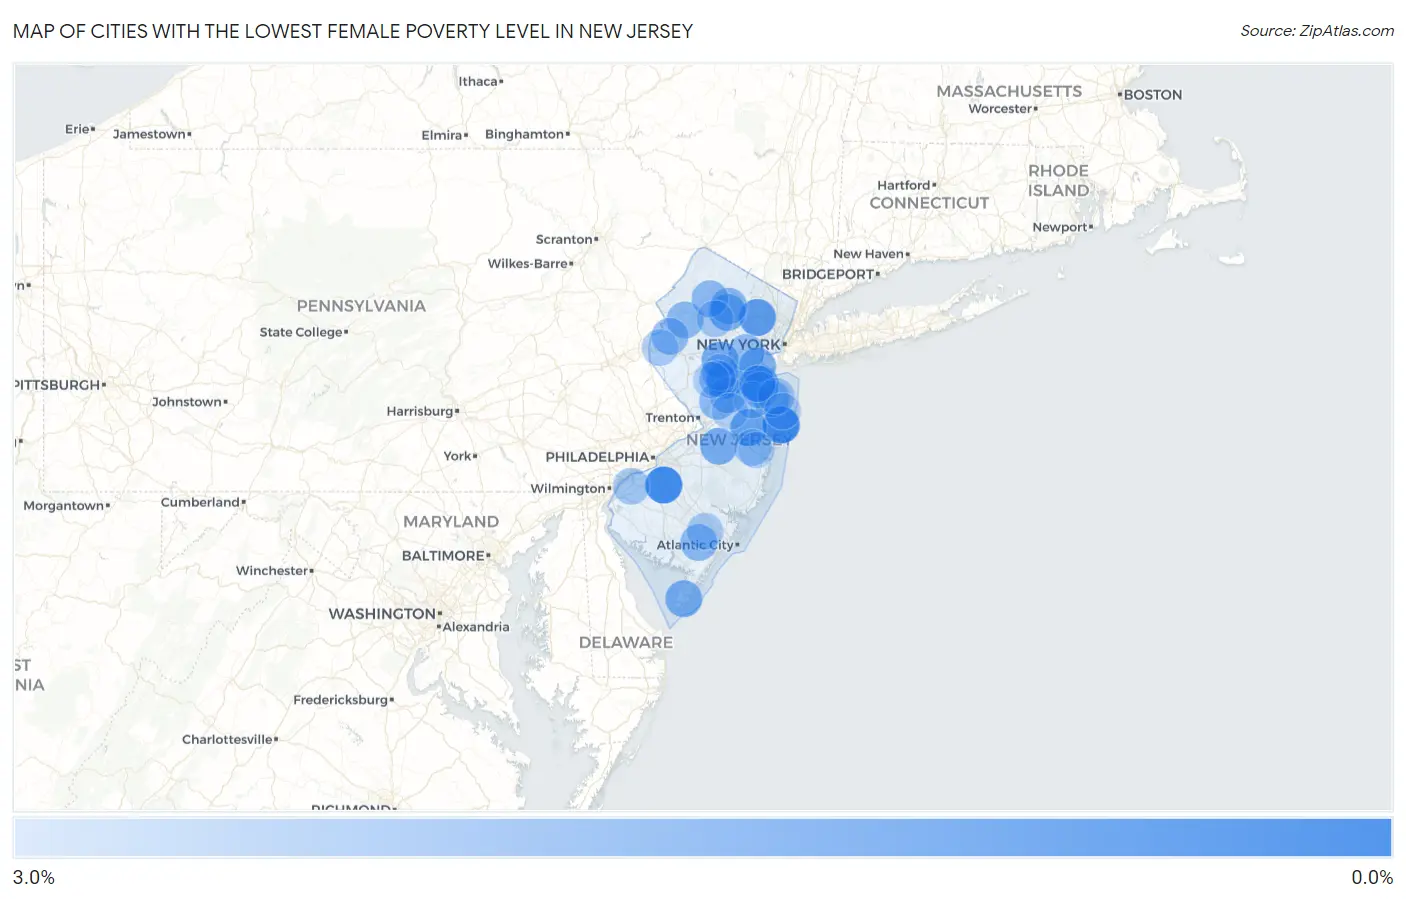
Map of Cities with the Lowest Female Poverty Level in New Jersey
3.0%
0.0%
Cities with the Lowest Female Poverty Level in New Jersey
| City | Female Poverty | vs State | vs National | |
| 1. | Hopelawn | 0.21% | 10.7%(-10.5)#1 | 13.7%(-13.5)#18 |
| 2. | Medford Lakes Borough | 0.29% | 10.7%(-10.4)#2 | 13.7%(-13.4)#26 |
| 3. | West Belmar | 0.33% | 10.7%(-10.4)#3 | 13.7%(-13.4)#33 |
| 4. | Turnersville | 0.41% | 10.7%(-10.3)#4 | 13.7%(-13.3)#51 |
| 5. | Hewitt | 0.42% | 10.7%(-10.3)#5 | 13.7%(-13.3)#52 |
| 6. | Demarest Borough | 0.44% | 10.7%(-10.3)#6 | 13.7%(-13.3)#59 |
| 7. | North Caldwell Borough | 0.56% | 10.7%(-10.2)#7 | 13.7%(-13.1)#91 |
| 8. | Milltown Borough | 0.56% | 10.7%(-10.2)#8 | 13.7%(-13.1)#92 |
| 9. | Springfield | 0.57% | 10.7%(-10.1)#9 | 13.7%(-13.1)#94 |
| 10. | Upper Greenwood Lake | 0.61% | 10.7%(-10.1)#10 | 13.7%(-13.1)#108 |
| 11. | Midland Park Borough | 0.65% | 10.7%(-10.1)#11 | 13.7%(-13.1)#126 |
| 12. | Stanhope Borough | 0.71% | 10.7%(-10.0)#12 | 13.7%(-13.0)#144 |
| 13. | Cliffwood Beach | 0.71% | 10.7%(-10.0)#13 | 13.7%(-13.0)#145 |
| 14. | Neshanic Station | 0.72% | 10.7%(-9.99)#14 | 13.7%(-13.0)#150 |
| 15. | Island Heights Borough | 0.76% | 10.7%(-9.95)#15 | 13.7%(-12.9)#165 |
| 16. | Lyons | 0.78% | 10.7%(-9.94)#16 | 13.7%(-12.9)#167 |
| 17. | Barnegat Light Borough | 0.85% | 10.7%(-9.87)#17 | 13.7%(-12.8)#193 |
| 18. | Pines Lake | 0.85% | 10.7%(-9.87)#18 | 13.7%(-12.8)#194 |
| 19. | Six Mile Run | 0.90% | 10.7%(-9.82)#19 | 13.7%(-12.8)#214 |
| 20. | Glen Ridge Borough | 0.92% | 10.7%(-9.80)#20 | 13.7%(-12.8)#219 |
| 21. | Singac | 0.95% | 10.7%(-9.77)#21 | 13.7%(-12.8)#228 |
| 22. | Seaville | 1.0% | 10.7%(-9.70)#22 | 13.7%(-12.7)#264 |
| 23. | Mount Tabor | 1.0% | 10.7%(-9.69)#23 | 13.7%(-12.7)#269 |
| 24. | Essex Fells Borough | 1.1% | 10.7%(-9.61)#24 | 13.7%(-12.6)#300 |
| 25. | Andover Borough | 1.1% | 10.7%(-9.59)#25 | 13.7%(-12.6)#306 |
| 26. | Vista Center | 1.2% | 10.7%(-9.54)#26 | 13.7%(-12.5)#337 |
| 27. | Layton | 1.2% | 10.7%(-9.53)#27 | 13.7%(-12.5)#343 |
| 28. | Packanack Lake | 1.2% | 10.7%(-9.49)#28 | 13.7%(-12.5)#360 |
| 29. | Fair Haven Borough | 1.3% | 10.7%(-9.45)#29 | 13.7%(-12.4)#388 |
| 30. | Roseland Borough | 1.3% | 10.7%(-9.43)#30 | 13.7%(-12.4)#397 |
| 31. | Fanwood Borough | 1.3% | 10.7%(-9.41)#31 | 13.7%(-12.4)#406 |
| 32. | Pine Beach Borough | 1.3% | 10.7%(-9.40)#32 | 13.7%(-12.4)#414 |
| 33. | Martinsville | 1.4% | 10.7%(-9.36)#33 | 13.7%(-12.3)#432 |
| 34. | Port Reading | 1.4% | 10.7%(-9.32)#34 | 13.7%(-12.3)#452 |
| 35. | Mcguire Afb | 1.4% | 10.7%(-9.32)#35 | 13.7%(-12.3)#453 |
| 36. | Brielle Borough | 1.4% | 10.7%(-9.30)#36 | 13.7%(-12.3)#465 |
| 37. | Stonebridge | 1.4% | 10.7%(-9.29)#37 | 13.7%(-12.3)#467 |
| 38. | Erma | 1.5% | 10.7%(-9.23)#38 | 13.7%(-12.2)#508 |
| 39. | White Meadow Lake | 1.5% | 10.7%(-9.20)#39 | 13.7%(-12.2)#528 |
| 40. | Connecticut Farms | 1.5% | 10.7%(-9.18)#40 | 13.7%(-12.2)#538 |
| 41. | Cedar Knolls | 1.5% | 10.7%(-9.17)#41 | 13.7%(-12.2)#541 |
| 42. | Hopewell Borough | 1.6% | 10.7%(-9.15)#42 | 13.7%(-12.1)#560 |
| 43. | Allenhurst Borough | 1.6% | 10.7%(-9.11)#43 | 13.7%(-12.1)#588 |
| 44. | Ringwood Borough | 1.6% | 10.7%(-9.09)#44 | 13.7%(-12.1)#607 |
| 45. | Rocky Hill Borough | 1.7% | 10.7%(-9.07)#45 | 13.7%(-12.0)#621 |
| 46. | Farmingdale Borough | 1.7% | 10.7%(-9.05)#46 | 13.7%(-12.0)#627 |
| 47. | Pine Brook | 1.7% | 10.7%(-9.01)#47 | 13.7%(-12.0)#651 |
| 48. | Old Tappan Borough | 1.7% | 10.7%(-8.99)#48 | 13.7%(-12.0)#668 |
| 49. | Mickleton | 1.8% | 10.7%(-8.92)#49 | 13.7%(-11.9)#706 |
| 50. | Wenonah Borough | 1.8% | 10.7%(-8.92)#50 | 13.7%(-11.9)#708 |
| 51. | Estell Manor | 1.8% | 10.7%(-8.92)#51 | 13.7%(-11.9)#710 |
| 52. | Vienna | 1.8% | 10.7%(-8.91)#52 | 13.7%(-11.9)#712 |
| 53. | Lake Telemark | 1.8% | 10.7%(-8.91)#53 | 13.7%(-11.9)#714 |
| 54. | Sea Girt Borough | 1.8% | 10.7%(-8.90)#54 | 13.7%(-11.9)#718 |
| 55. | Lake Mohawk | 1.9% | 10.7%(-8.86)#55 | 13.7%(-11.8)#746 |
| 56. | Plainsboro Center | 1.9% | 10.7%(-8.85)#56 | 13.7%(-11.8)#750 |
| 57. | Brass Castle | 1.9% | 10.7%(-8.85)#57 | 13.7%(-11.8)#755 |
| 58. | Lincroft | 1.9% | 10.7%(-8.83)#58 | 13.7%(-11.8)#769 |
| 59. | Little Silver Borough | 1.9% | 10.7%(-8.80)#59 | 13.7%(-11.8)#791 |
| 60. | Troy Hills | 1.9% | 10.7%(-8.79)#60 | 13.7%(-11.8)#801 |
| 61. | Dayton | 1.9% | 10.7%(-8.77)#61 | 13.7%(-11.8)#818 |
| 62. | Chatham Borough | 2.0% | 10.7%(-8.75)#62 | 13.7%(-11.7)#834 |
| 63. | Mount Hope | 2.0% | 10.7%(-8.72)#63 | 13.7%(-11.7)#867 |
| 64. | Helmetta Borough | 2.0% | 10.7%(-8.71)#64 | 13.7%(-11.7)#868 |
| 65. | Westfield | 2.0% | 10.7%(-8.69)#65 | 13.7%(-11.7)#887 |
| 66. | Weston | 2.0% | 10.7%(-8.68)#66 | 13.7%(-11.7)#903 |
| 67. | Forsgate | 2.1% | 10.7%(-8.67)#67 | 13.7%(-11.6)#911 |
| 68. | Whippany | 2.1% | 10.7%(-8.64)#68 | 13.7%(-11.6)#921 |
| 69. | Robertsville | 2.1% | 10.7%(-8.63)#69 | 13.7%(-11.6)#933 |
| 70. | Roosevelt Borough | 2.1% | 10.7%(-8.63)#70 | 13.7%(-11.6)#936 |
| 71. | Strathmore | 2.1% | 10.7%(-8.62)#71 | 13.7%(-11.6)#941 |
| 72. | Millington | 2.1% | 10.7%(-8.61)#72 | 13.7%(-11.6)#953 |
| 73. | Blackwells Mills | 2.1% | 10.7%(-8.60)#73 | 13.7%(-11.6)#964 |
| 74. | Tenafly Borough | 2.1% | 10.7%(-8.57)#74 | 13.7%(-11.6)#993 |
| 75. | West Cape May Borough | 2.1% | 10.7%(-8.57)#75 | 13.7%(-11.6)#996 |
| 76. | The Ponds | 2.2% | 10.7%(-8.53)#76 | 13.7%(-11.5)#1,032 |
| 77. | Riverton Borough | 2.2% | 10.7%(-8.52)#77 | 13.7%(-11.5)#1,040 |
| 78. | Beckett | 2.2% | 10.7%(-8.51)#78 | 13.7%(-11.5)#1,048 |
| 79. | Fairview | 2.2% | 10.7%(-8.50)#79 | 13.7%(-11.5)#1,051 |
| 80. | Leisure Knoll | 2.2% | 10.7%(-8.50)#80 | 13.7%(-11.5)#1,053 |
| 81. | Kenvil | 2.2% | 10.7%(-8.47)#81 | 13.7%(-11.5)#1,075 |
| 82. | Mountainside Borough | 2.3% | 10.7%(-8.45)#82 | 13.7%(-11.4)#1,098 |
| 83. | Ramsey Borough | 2.3% | 10.7%(-8.43)#83 | 13.7%(-11.4)#1,110 |
| 84. | Audubon Borough | 2.3% | 10.7%(-8.41)#84 | 13.7%(-11.4)#1,130 |
| 85. | Watchung Borough | 2.3% | 10.7%(-8.40)#85 | 13.7%(-11.4)#1,138 |
| 86. | Laurence Harbor | 2.3% | 10.7%(-8.40)#86 | 13.7%(-11.4)#1,145 |
| 87. | Vincentown | 2.3% | 10.7%(-8.39)#87 | 13.7%(-11.4)#1,150 |
| 88. | Mays Landing | 2.4% | 10.7%(-8.37)#88 | 13.7%(-11.3)#1,175 |
| 89. | Tuckerton Borough | 2.4% | 10.7%(-8.36)#89 | 13.7%(-11.3)#1,182 |
| 90. | Mountain Lakes Borough | 2.4% | 10.7%(-8.34)#90 | 13.7%(-11.3)#1,192 |
| 91. | Stewartsville | 2.4% | 10.7%(-8.31)#91 | 13.7%(-11.3)#1,225 |
| 92. | Great Notch | 2.4% | 10.7%(-8.30)#92 | 13.7%(-11.3)#1,230 |
| 93. | Auburn | 2.4% | 10.7%(-8.30)#93 | 13.7%(-11.3)#1,235 |
| 94. | Oakhurst | 2.5% | 10.7%(-8.26)#94 | 13.7%(-11.2)#1,281 |
| 95. | Lincoln Park Borough | 2.5% | 10.7%(-8.21)#95 | 13.7%(-11.2)#1,335 |
| 96. | Belle Mead | 2.5% | 10.7%(-8.19)#96 | 13.7%(-11.2)#1,346 |
| 97. | Woodcliff Lake Borough | 2.5% | 10.7%(-8.17)#97 | 13.7%(-11.2)#1,364 |
| 98. | Pine Lake Park | 2.6% | 10.7%(-8.16)#98 | 13.7%(-11.1)#1,377 |
| 99. | Twin Rivers | 2.6% | 10.7%(-8.11)#99 | 13.7%(-11.1)#1,421 |
| 100. | Palermo | 2.6% | 10.7%(-8.11)#100 | 13.7%(-11.1)#1,423 |
Common Questions
What are the Top 10 Cities with the Lowest Female Poverty Level in New Jersey?
Top 10 Cities with the Lowest Female Poverty Level in New Jersey are:
#1
0.33%
#2
0.41%
#3
0.71%
#4
0.90%
#5
0.95%
#6
1.2%
#7
1.4%
#8
1.4%
#9
1.4%
#10
1.5%
What city has the Lowest Female Poverty Level in New Jersey?
West Belmar has the Lowest Female Poverty Level in New Jersey with 0.33%.
What is the Poverty Level Among Females in the State of New Jersey?
Poverty Level Among Females in New Jersey is 10.7%.
What is the Poverty Level Among Females in the United States?
Poverty Level Among Females in the United States is 13.7%.