Cities with the Lowest Child Poverty Level Among Boys Under the Age of 16 in New Jersey
RELATED REPORTS & OPTIONS
Lowest Poverty | Boys 0-16
New Jersey
Compare Cities
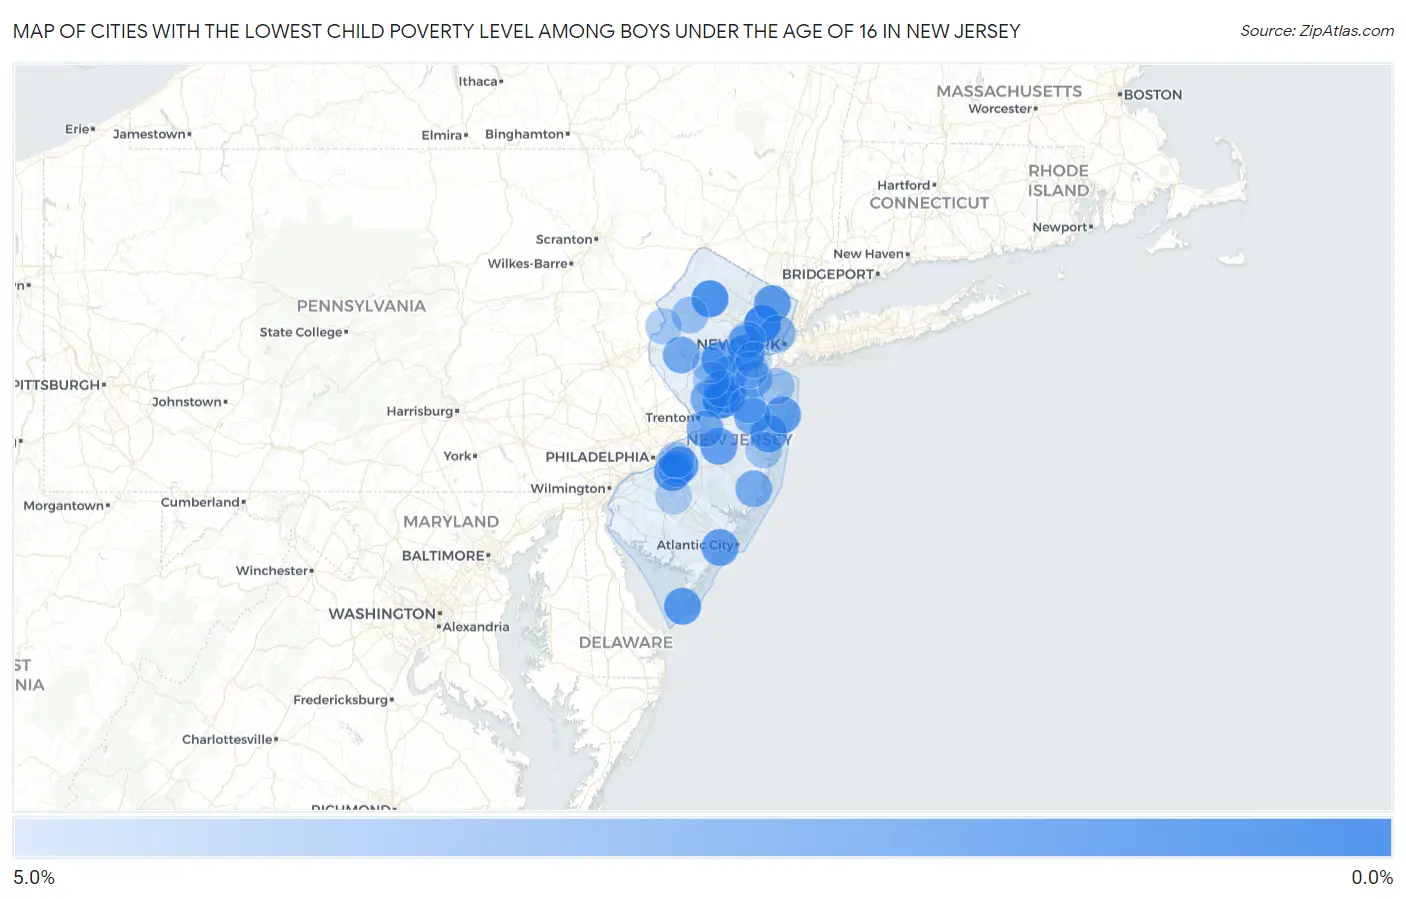
Map of Cities with the Lowest Child Poverty Level Among Boys Under the Age of 16 in New Jersey
5.0%
0.0%
Cities with the Lowest Child Poverty Level Among Boys Under the Age of 16 in New Jersey
| City | Child Poverty (Boys) | vs State | vs National | |
| 1. | Berlin Borough | 0.16% | 13.4%(-13.3)#1 | 16.9%(-16.7)#3 |
| 2. | Gibbsboro Borough | 0.39% | 13.4%(-13.0)#2 | 16.9%(-16.5)#17 |
| 3. | Upper Montclair | 0.40% | 13.4%(-13.0)#3 | 16.9%(-16.5)#18 |
| 4. | Princeton Meadows | 0.49% | 13.4%(-12.9)#4 | 16.9%(-16.4)#36 |
| 5. | Madison Borough | 0.75% | 13.4%(-12.7)#5 | 16.9%(-16.2)#96 |
| 6. | Somerville Borough | 0.83% | 13.4%(-12.6)#6 | 16.9%(-16.1)#118 |
| 7. | Haddonfield Borough | 0.84% | 13.4%(-12.6)#7 | 16.9%(-16.1)#122 |
| 8. | Lake Mohawk | 0.98% | 13.4%(-12.4)#8 | 16.9%(-15.9)#161 |
| 9. | Dayton | 1.1% | 13.4%(-12.3)#9 | 16.9%(-15.8)#197 |
| 10. | Ringwood Borough | 1.2% | 13.4%(-12.2)#10 | 16.9%(-15.7)#236 |
| 11. | Echelon | 1.2% | 13.4%(-12.2)#11 | 16.9%(-15.7)#244 |
| 12. | Chatham Borough | 1.2% | 13.4%(-12.2)#12 | 16.9%(-15.7)#253 |
| 13. | River Edge Borough | 1.2% | 13.4%(-12.2)#13 | 16.9%(-15.7)#256 |
| 14. | Allentown Borough | 1.2% | 13.4%(-12.2)#14 | 16.9%(-15.7)#260 |
| 15. | Marlton | 1.3% | 13.4%(-12.1)#15 | 16.9%(-15.6)#291 |
| 16. | Martinsville | 1.3% | 13.4%(-12.1)#16 | 16.9%(-15.6)#298 |
| 17. | Cape May | 1.4% | 13.4%(-12.0)#17 | 16.9%(-15.5)#337 |
| 18. | Old Tappan Borough | 1.4% | 13.4%(-12.0)#18 | 16.9%(-15.5)#340 |
| 19. | Ridgewood | 1.4% | 13.4%(-12.0)#19 | 16.9%(-15.5)#344 |
| 20. | Westfield | 1.5% | 13.4%(-12.0)#20 | 16.9%(-15.5)#349 |
| 21. | Park Ridge Borough | 1.6% | 13.4%(-11.8)#21 | 16.9%(-15.3)#400 |
| 22. | Ramtown | 1.6% | 13.4%(-11.8)#22 | 16.9%(-15.3)#403 |
| 23. | New Milford Borough | 1.6% | 13.4%(-11.8)#23 | 16.9%(-15.3)#405 |
| 24. | Wanamassa | 1.7% | 13.4%(-11.7)#24 | 16.9%(-15.2)#441 |
| 25. | Leonia Borough | 1.7% | 13.4%(-11.7)#25 | 16.9%(-15.2)#455 |
| 26. | Mcguire Afb | 1.8% | 13.4%(-11.7)#26 | 16.9%(-15.1)#498 |
| 27. | Fanwood Borough | 1.8% | 13.4%(-11.7)#27 | 16.9%(-15.1)#499 |
| 28. | Linwood | 1.8% | 13.4%(-11.7)#28 | 16.9%(-15.1)#501 |
| 29. | Metuchen Borough | 1.8% | 13.4%(-11.6)#29 | 16.9%(-15.1)#518 |
| 30. | Milltown Borough | 1.8% | 13.4%(-11.6)#30 | 16.9%(-15.1)#525 |
| 31. | Franklin Borough | 1.8% | 13.4%(-11.6)#31 | 16.9%(-15.1)#529 |
| 32. | Shrewsbury Borough | 1.8% | 13.4%(-11.6)#32 | 16.9%(-15.1)#530 |
| 33. | Ogdensburg Borough | 2.1% | 13.4%(-11.4)#33 | 16.9%(-14.8)#663 |
| 34. | Raritan Borough | 2.1% | 13.4%(-11.4)#34 | 16.9%(-14.8)#664 |
| 35. | Woodcliff Lake Borough | 2.1% | 13.4%(-11.3)#35 | 16.9%(-14.8)#671 |
| 36. | Oceanport Borough | 2.1% | 13.4%(-11.3)#36 | 16.9%(-14.8)#681 |
| 37. | Franklin Lakes Borough | 2.1% | 13.4%(-11.3)#37 | 16.9%(-14.8)#688 |
| 38. | Westmont | 2.1% | 13.4%(-11.3)#38 | 16.9%(-14.8)#689 |
| 39. | Folsom Borough | 2.1% | 13.4%(-11.3)#39 | 16.9%(-14.8)#706 |
| 40. | South Plainfield Borough | 2.1% | 13.4%(-11.3)#40 | 16.9%(-14.8)#713 |
| 41. | Lebanon Borough | 2.2% | 13.4%(-11.2)#41 | 16.9%(-14.7)#741 |
| 42. | Chesilhurst Borough | 2.2% | 13.4%(-11.2)#42 | 16.9%(-14.7)#763 |
| 43. | Chester Borough | 2.2% | 13.4%(-11.2)#43 | 16.9%(-14.7)#771 |
| 44. | Clinton | 2.2% | 13.4%(-11.2)#44 | 16.9%(-14.7)#777 |
| 45. | West Freehold | 2.3% | 13.4%(-11.2)#45 | 16.9%(-14.6)#794 |
| 46. | Jamesburg Borough | 2.3% | 13.4%(-11.1)#46 | 16.9%(-14.6)#812 |
| 47. | Princeton | 2.3% | 13.4%(-11.1)#47 | 16.9%(-14.6)#821 |
| 48. | Waldwick Borough | 2.4% | 13.4%(-11.0)#48 | 16.9%(-14.5)#859 |
| 49. | Rutherford Borough | 2.4% | 13.4%(-11.0)#49 | 16.9%(-14.5)#868 |
| 50. | Bordentown | 2.4% | 13.4%(-11.0)#50 | 16.9%(-14.5)#891 |
| 51. | Ocean Acres | 2.4% | 13.4%(-11.0)#51 | 16.9%(-14.5)#899 |
| 52. | Totowa Borough | 2.5% | 13.4%(-11.0)#52 | 16.9%(-14.4)#905 |
| 53. | Lake Hiawatha | 2.5% | 13.4%(-10.9)#53 | 16.9%(-14.4)#915 |
| 54. | Somerset | 2.5% | 13.4%(-10.9)#54 | 16.9%(-14.4)#934 |
| 55. | Riverton Borough | 2.6% | 13.4%(-10.8)#55 | 16.9%(-14.3)#991 |
| 56. | Audubon Borough | 2.7% | 13.4%(-10.7)#56 | 16.9%(-14.2)#1,041 |
| 57. | South Amboy | 2.7% | 13.4%(-10.7)#57 | 16.9%(-14.2)#1,045 |
| 58. | Fieldsboro Borough | 2.7% | 13.4%(-10.7)#58 | 16.9%(-14.2)#1,052 |
| 59. | Hillsdale Borough | 2.8% | 13.4%(-10.6)#59 | 16.9%(-14.1)#1,086 |
| 60. | Hawthorne Borough | 2.8% | 13.4%(-10.6)#60 | 16.9%(-14.1)#1,109 |
| 61. | Cresskill Borough | 2.9% | 13.4%(-10.6)#61 | 16.9%(-14.0)#1,141 |
| 62. | Garwood Borough | 2.9% | 13.4%(-10.5)#62 | 16.9%(-14.0)#1,155 |
| 63. | Secaucus | 2.9% | 13.4%(-10.5)#63 | 16.9%(-14.0)#1,160 |
| 64. | Newfield Borough | 2.9% | 13.4%(-10.5)#64 | 16.9%(-14.0)#1,164 |
| 65. | Springdale | 2.9% | 13.4%(-10.5)#65 | 16.9%(-14.0)#1,183 |
| 66. | Parsippany | 3.0% | 13.4%(-10.5)#66 | 16.9%(-13.9)#1,202 |
| 67. | Florham Park Borough | 3.0% | 13.4%(-10.4)#67 | 16.9%(-13.9)#1,216 |
| 68. | The Hills | 3.0% | 13.4%(-10.4)#68 | 16.9%(-13.9)#1,261 |
| 69. | Milford Borough | 3.1% | 13.4%(-10.4)#69 | 16.9%(-13.8)#1,271 |
| 70. | Oradell Borough | 3.1% | 13.4%(-10.4)#70 | 16.9%(-13.8)#1,274 |
| 71. | Woodbury Heights Borough | 3.2% | 13.4%(-10.2)#71 | 16.9%(-13.7)#1,352 |
| 72. | Maywood Borough | 3.2% | 13.4%(-10.2)#72 | 16.9%(-13.7)#1,384 |
| 73. | Point Pleasant Borough | 3.3% | 13.4%(-10.2)#73 | 16.9%(-13.6)#1,399 |
| 74. | Summit | 3.3% | 13.4%(-10.1)#74 | 16.9%(-13.6)#1,433 |
| 75. | Short Hills | 3.4% | 13.4%(-10.1)#75 | 16.9%(-13.5)#1,463 |
| 76. | Kendall Park | 3.4% | 13.4%(-10.1)#76 | 16.9%(-13.5)#1,464 |
| 77. | Haworth Borough | 3.4% | 13.4%(-10.1)#77 | 16.9%(-13.5)#1,470 |
| 78. | Roosevelt Borough | 3.4% | 13.4%(-10.0)#78 | 16.9%(-13.5)#1,482 |
| 79. | Yorketown | 3.4% | 13.4%(-10.0)#79 | 16.9%(-13.5)#1,486 |
| 80. | Pine Beach Borough | 3.4% | 13.4%(-10.0)#80 | 16.9%(-13.5)#1,488 |
| 81. | Macopin | 3.5% | 13.4%(-9.96)#81 | 16.9%(-13.4)#1,525 |
| 82. | Panther Valley | 3.5% | 13.4%(-9.89)#82 | 16.9%(-13.4)#1,561 |
| 83. | Millstone Borough | 3.6% | 13.4%(-9.78)#83 | 16.9%(-13.3)#1,620 |
| 84. | Ramblewood | 3.7% | 13.4%(-9.75)#84 | 16.9%(-13.2)#1,638 |
| 85. | Emerson Borough | 3.7% | 13.4%(-9.68)#85 | 16.9%(-13.2)#1,683 |
| 86. | Belle Mead | 3.8% | 13.4%(-9.63)#86 | 16.9%(-13.1)#1,703 |
| 87. | Sayreville Borough | 3.8% | 13.4%(-9.58)#87 | 16.9%(-13.1)#1,728 |
| 88. | Toms River | 3.9% | 13.4%(-9.56)#88 | 16.9%(-13.0)#1,745 |
| 89. | Belford | 3.9% | 13.4%(-9.56)#89 | 16.9%(-13.0)#1,746 |
| 90. | Fords | 3.9% | 13.4%(-9.52)#90 | 16.9%(-13.0)#1,773 |
| 91. | Belvidere | 4.0% | 13.4%(-9.40)#91 | 16.9%(-12.9)#1,828 |
| 92. | Runnemede Borough | 4.0% | 13.4%(-9.40)#92 | 16.9%(-12.9)#1,834 |
| 93. | Lake Hopatcong | 4.1% | 13.4%(-9.34)#93 | 16.9%(-12.8)#1,868 |
| 94. | Bargaintown | 4.2% | 13.4%(-9.26)#94 | 16.9%(-12.7)#1,896 |
| 95. | Lincoln Park Borough | 4.2% | 13.4%(-9.24)#95 | 16.9%(-12.7)#1,920 |
| 96. | Williamstown | 4.2% | 13.4%(-9.22)#96 | 16.9%(-12.7)#1,926 |
| 97. | Bound Brook Borough | 4.3% | 13.4%(-9.13)#97 | 16.9%(-12.6)#1,984 |
| 98. | Bradley Gardens | 4.4% | 13.4%(-9.03)#98 | 16.9%(-12.5)#2,051 |
| 99. | Rahway | 4.4% | 13.4%(-9.03)#99 | 16.9%(-12.5)#2,052 |
| 100. | Hillsborough | 4.5% | 13.4%(-8.93)#100 | 16.9%(-12.4)#2,107 |
Common Questions
What are the Top 10 Cities with the Lowest Child Poverty Level Among Boys Under the Age of 16 in New Jersey?
Top 10 Cities with the Lowest Child Poverty Level Among Boys Under the Age of 16 in New Jersey are:
#1
0.40%
#2
0.49%
#3
0.98%
#4
1.1%
#5
1.2%
#6
1.3%
#7
1.3%
#8
1.4%
#9
1.4%
#10
1.5%
What city has the Lowest Child Poverty Level Among Boys Under the Age of 16 in New Jersey?
Upper Montclair has the Lowest Child Poverty Level Among Boys Under the Age of 16 in New Jersey with 0.40%.
What is the Poverty Level Among Boys Under the Age of 16 in the State of New Jersey?
Poverty Level Among Boys Under the Age of 16 in New Jersey is 13.4%.
What is the Poverty Level Among Boys Under the Age of 16 in the United States?
Poverty Level Among Boys Under the Age of 16 in the United States is 16.9%.