Cities with the Highest Percentage of Immigrants from Uganda in New Jersey
RELATED REPORTS & OPTIONS
Uganda
New Jersey
Compare Cities
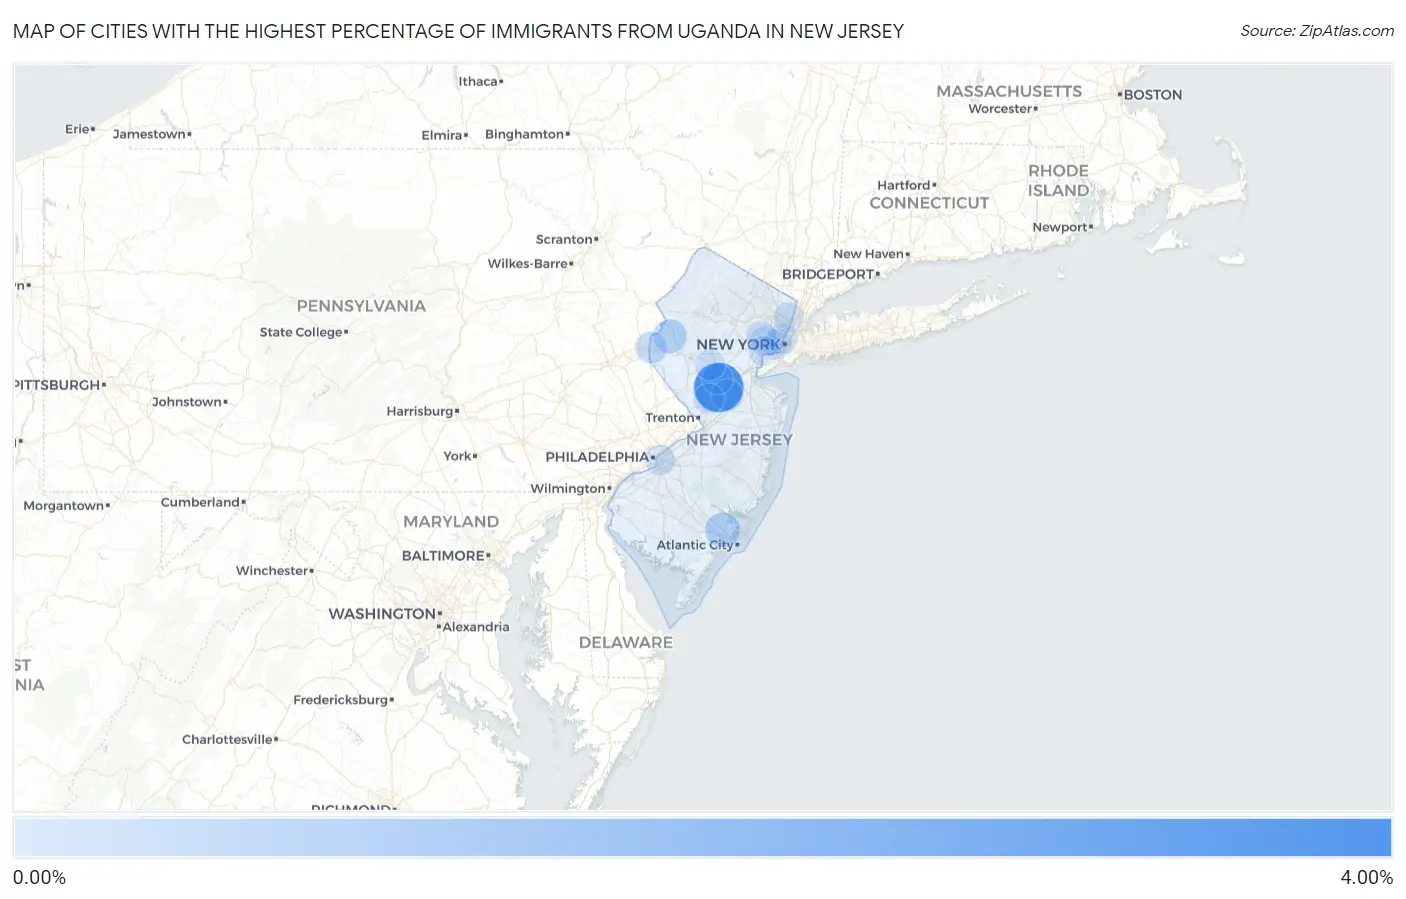
Map of Cities with the Highest Percentage of Immigrants from Uganda in New Jersey
0.00%
4.00%
Cities with the Highest Percentage of Immigrants from Uganda in New Jersey
| City | Uganda | vs State | vs National | |
| 1. | Ten Mile Run | 3.84% | 0.014%(+3.82)#-1 | 0.011%(+3.83)#0 |
| 2. | Rainbow Lakes | 1.43% | 0.014%(+1.42)#0 | 0.011%(+1.42)#1 |
| 3. | Edgewater Borough | 1.08% | 0.014%(+1.06)#1 | 0.011%(+1.07)#2 |
| 4. | Pomona | 0.82% | 0.014%(+0.808)#2 | 0.011%(+0.811)#3 |
| 5. | Brass Castle | 0.68% | 0.014%(+0.666)#3 | 0.011%(+0.669)#4 |
| 6. | Highland Park Borough | 0.43% | 0.014%(+0.413)#4 | 0.011%(+0.416)#5 |
| 7. | Phillipsburg | 0.36% | 0.014%(+0.348)#5 | 0.011%(+0.351)#6 |
| 8. | Woodland Park Borough | 0.27% | 0.014%(+0.257)#6 | 0.011%(+0.260)#7 |
| 9. | Rutherford Borough | 0.26% | 0.014%(+0.247)#7 | 0.011%(+0.250)#8 |
| 10. | Moonachie Borough | 0.26% | 0.014%(+0.245)#8 | 0.011%(+0.248)#9 |
| 11. | Dayton | 0.25% | 0.014%(+0.237)#9 | 0.011%(+0.240)#10 |
| 12. | Blackwells Mills | 0.17% | 0.014%(+0.155)#10 | 0.011%(+0.158)#11 |
| 13. | Carteret Borough | 0.099% | 0.014%(+0.085)#11 | 0.011%(+0.088)#12 |
| 14. | Sayreville Borough | 0.097% | 0.014%(+0.084)#12 | 0.011%(+0.086)#13 |
| 15. | Waldwick Borough | 0.089% | 0.014%(+0.075)#13 | 0.011%(+0.078)#14 |
| 16. | New Milford Borough | 0.077% | 0.014%(+0.063)#14 | 0.011%(+0.066)#15 |
| 17. | Glen Rock Borough | 0.074% | 0.014%(+0.061)#15 | 0.011%(+0.063)#16 |
| 18. | Caldwell Borough | 0.067% | 0.014%(+0.053)#16 | 0.011%(+0.056)#17 |
| 19. | Bradley Gardens | 0.063% | 0.014%(+0.049)#17 | 0.011%(+0.052)#18 |
| 20. | Cliffside Park Borough | 0.063% | 0.014%(+0.049)#18 | 0.011%(+0.052)#19 |
| 21. | Camden | 0.049% | 0.014%(+0.035)#19 | 0.011%(+0.038)#20 |
| 22. | Hoboken | 0.048% | 0.014%(+0.034)#20 | 0.011%(+0.037)#21 |
| 23. | Bergenfield Borough | 0.046% | 0.014%(+0.032)#21 | 0.011%(+0.035)#22 |
| 24. | Englewood | 0.045% | 0.014%(+0.031)#22 | 0.011%(+0.034)#23 |
| 25. | Ramapo College Of New Jersey | 0.045% | 0.014%(+0.031)#23 | 0.011%(+0.034)#24 |
| 26. | Princeton | 0.039% | 0.014%(+0.025)#24 | 0.011%(+0.028)#25 |
| 27. | Troy Hills | 0.038% | 0.014%(+0.024)#25 | 0.011%(+0.027)#26 |
| 28. | Newark | 0.038% | 0.014%(+0.024)#26 | 0.011%(+0.027)#27 |
| 29. | Paramus Borough | 0.034% | 0.014%(+0.020)#27 | 0.011%(+0.023)#28 |
| 30. | Jersey City | 0.024% | 0.014%(+0.010)#28 | 0.011%(+0.013)#29 |
| 31. | East Orange | 0.010% | 0.014%(-0.004)#29 | 0.011%(-0.001)#30 |
| 32. | Elizabeth | 0.0015% | 0.014%(-0.012)#30 | 0.011%(-0.010)#31 |
Common Questions
What are the Top 10 Cities with the Highest Percentage of Immigrants from Uganda in New Jersey?
Top 10 Cities with the Highest Percentage of Immigrants from Uganda in New Jersey are:
#1
3.84%
#2
0.82%
#3
0.68%
#4
0.36%
#5
0.25%
#6
0.17%
#7
0.063%
#8
0.049%
#9
0.048%
#10
0.045%
What city has the Highest Percentage of Immigrants from Uganda in New Jersey?
Ten Mile Run has the Highest Percentage of Immigrants from Uganda in New Jersey with 3.84%.
What is the Percentage of Immigrants from Uganda in the State of New Jersey?
Percentage of Immigrants from Uganda in New Jersey is 0.014%.
What is the Percentage of Immigrants from Uganda in the United States?
Percentage of Immigrants from Uganda in the United States is 0.011%.