Cities with the Highest Percentage of White / Caucasian Population in New Jersey
RELATED REPORTS & OPTIONS
White / Caucasian
New Jersey
Compare Cities
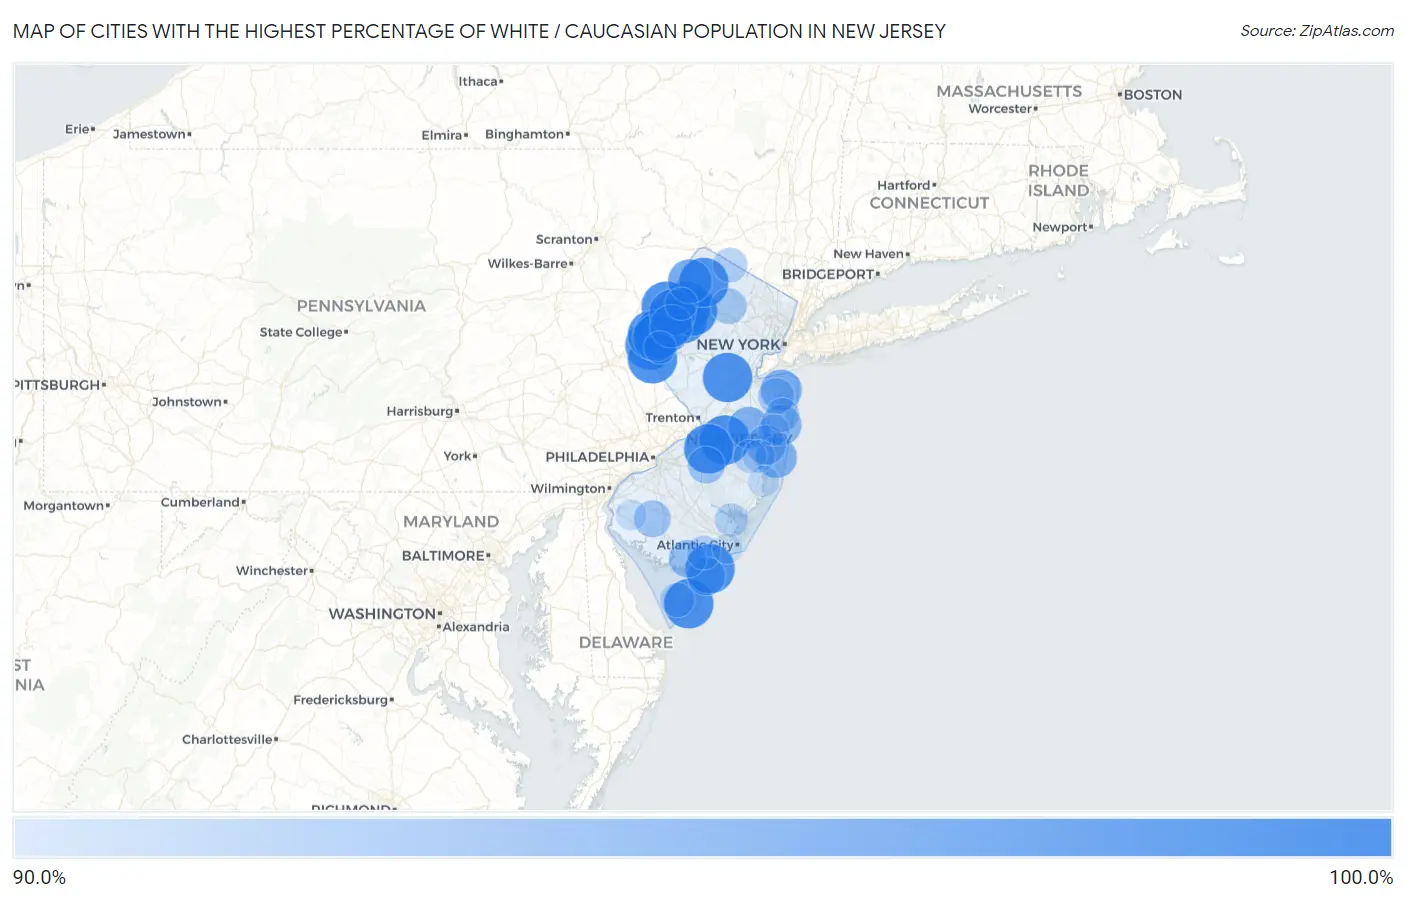
Map of Cities with the Highest Percentage of White / Caucasian Population in New Jersey
0.0%
100.0%
Cities with the Highest Percentage of White / Caucasian Population in New Jersey
| City | White / Caucasian | vs State | vs National | |
| 1. | New Egypt | 100.0% | 59.8%(+40.2)#1 | 65.9%(+34.1)#12 |
| 2. | Germania | 100.0% | 59.8%(+40.2)#2 | 65.9%(+34.1)#81 |
| 3. | The Ponds | 100.0% | 59.8%(+40.2)#3 | 65.9%(+34.1)#85 |
| 4. | New Vernon | 100.0% | 59.8%(+40.2)#4 | 65.9%(+34.1)#100 |
| 5. | Oceanville | 100.0% | 59.8%(+40.2)#5 | 65.9%(+34.1)#112 |
| 6. | Brookfield | 100.0% | 59.8%(+40.2)#6 | 65.9%(+34.1)#130 |
| 7. | Renaissance At Monroe | 100.0% | 59.8%(+40.2)#7 | 65.9%(+34.1)#155 |
| 8. | Sweetwater | 100.0% | 59.8%(+40.2)#8 | 65.9%(+34.1)#180 |
| 9. | Johnsonburg | 100.0% | 59.8%(+40.2)#9 | 65.9%(+34.1)#325 |
| 10. | Washington Crossing | 100.0% | 59.8%(+40.2)#10 | 65.9%(+34.1)#333 |
| 11. | Delmont | 100.0% | 59.8%(+40.2)#11 | 65.9%(+34.1)#438 |
| 12. | Delaware Park | 100.0% | 59.8%(+40.2)#12 | 65.9%(+34.1)#530 |
| 13. | Oldwick | 100.0% | 59.8%(+40.2)#13 | 65.9%(+34.1)#547 |
| 14. | Finesville | 100.0% | 59.8%(+40.2)#14 | 65.9%(+34.1)#550 |
| 15. | Great Meadows | 100.0% | 59.8%(+40.2)#15 | 65.9%(+34.1)#614 |
| 16. | Port Elizabeth | 100.0% | 59.8%(+40.2)#16 | 65.9%(+34.1)#655 |
| 17. | Bridgeville | 100.0% | 59.8%(+40.2)#17 | 65.9%(+34.1)#775 |
| 18. | Hainesburg | 100.0% | 59.8%(+40.2)#18 | 65.9%(+34.1)#777 |
| 19. | Marshallville | 100.0% | 59.8%(+40.2)#20 | 65.9%(+34.1)#905 |
| 20. | Diamond Beach | 100.0% | 59.8%(+40.2)#21 | 65.9%(+34.1)#906 |
| 21. | Bridgeport | 100.0% | 59.8%(+40.2)#22 | 65.9%(+34.1)#957 |
| 22. | Brainards | 100.0% | 59.8%(+40.2)#23 | 65.9%(+34.1)#1,248 |
| 23. | Dorchester | 100.0% | 59.8%(+40.2)#24 | 65.9%(+34.1)#1,271 |
| 24. | Tuckahoe | 100.0% | 59.8%(+40.2)#25 | 65.9%(+34.1)#1,348 |
| 25. | Strathmere | 100.0% | 59.8%(+40.2)#26 | 65.9%(+34.1)#1,638 |
| 26. | Hutchinson | 100.0% | 59.8%(+40.2)#27 | 65.9%(+34.1)#1,703 |
| 27. | Allamuchy | 100.0% | 59.8%(+40.2)#28 | 65.9%(+34.1)#1,843 |
| 28. | Fortescue | 100.0% | 59.8%(+40.2)#29 | 65.9%(+34.1)#2,016 |
| 29. | Seeley | 100.0% | 59.8%(+40.2)#30 | 65.9%(+34.1)#2,120 |
| 30. | Leeds Point | 100.0% | 59.8%(+40.2)#31 | 65.9%(+34.1)#2,157 |
| 31. | Clyde | 100.0% | 59.8%(+40.2)#32 | 65.9%(+34.1)#2,169 |
| 32. | Juliustown | 100.0% | 59.8%(+40.2)#33 | 65.9%(+34.1)#2,300 |
| 33. | Ross Corner | 100.0% | 59.8%(+40.2)#34 | 65.9%(+34.1)#2,305 |
| 34. | Gandys Beach | 100.0% | 59.8%(+40.2)#35 | 65.9%(+34.1)#2,971 |
| 35. | Tavistock Borough | 100.0% | 59.8%(+40.2)#36 | 65.9%(+34.1)#3,366 |
| 36. | Little Silver Borough | 99.5% | 59.8%(+39.8)#37 | 65.9%(+33.6)#3,721 |
| 37. | Dennisville | 99.5% | 59.8%(+39.7)#38 | 65.9%(+33.6)#3,727 |
| 38. | Harmony | 99.4% | 59.8%(+39.6)#39 | 65.9%(+33.5)#3,798 |
| 39. | Surf City Borough | 99.2% | 59.8%(+39.5)#40 | 65.9%(+33.4)#3,931 |
| 40. | Mount Hermon | 99.1% | 59.8%(+39.4)#41 | 65.9%(+33.3)#4,036 |
| 41. | Ship Bottom Borough | 99.0% | 59.8%(+39.2)#42 | 65.9%(+33.1)#4,155 |
| 42. | Stone Harbor Borough | 98.6% | 59.8%(+38.9)#43 | 65.9%(+32.8)#4,499 |
| 43. | Sea Girt Borough | 98.5% | 59.8%(+38.7)#44 | 65.9%(+32.6)#4,623 |
| 44. | Crandon Lakes | 98.4% | 59.8%(+38.6)#45 | 65.9%(+32.5)#4,718 |
| 45. | Seaville | 98.2% | 59.8%(+38.4)#46 | 65.9%(+32.3)#4,924 |
| 46. | Crosswicks | 98.1% | 59.8%(+38.3)#47 | 65.9%(+32.2)#5,053 |
| 47. | Buttzville | 98.1% | 59.8%(+38.3)#48 | 65.9%(+32.2)#5,103 |
| 48. | Longport Borough | 97.8% | 59.8%(+38.0)#49 | 65.9%(+31.9)#5,364 |
| 49. | Newport | 97.7% | 59.8%(+38.0)#50 | 65.9%(+31.9)#5,445 |
| 50. | Vista Center | 97.6% | 59.8%(+37.9)#51 | 65.9%(+31.8)#5,551 |
| 51. | Dover Beaches South | 97.6% | 59.8%(+37.9)#52 | 65.9%(+31.7)#5,572 |
| 52. | Navesink | 97.6% | 59.8%(+37.8)#53 | 65.9%(+31.7)#5,635 |
| 53. | West Belmar | 97.4% | 59.8%(+37.6)#54 | 65.9%(+31.5)#5,834 |
| 54. | Pluckemin | 97.2% | 59.8%(+37.4)#55 | 65.9%(+31.3)#6,086 |
| 55. | Wenonah Borough | 97.2% | 59.8%(+37.4)#56 | 65.9%(+31.3)#6,136 |
| 56. | Leisure Village East | 97.1% | 59.8%(+37.3)#57 | 65.9%(+31.2)#6,189 |
| 57. | Interlaken Borough | 97.0% | 59.8%(+37.2)#58 | 65.9%(+31.1)#6,336 |
| 58. | Wildwood Crest Borough | 97.0% | 59.8%(+37.2)#59 | 65.9%(+31.1)#6,342 |
| 59. | Windsor | 97.0% | 59.8%(+37.2)#60 | 65.9%(+31.1)#6,376 |
| 60. | South Seaville | 96.9% | 59.8%(+37.1)#61 | 65.9%(+31.0)#6,460 |
| 61. | Sea Isle City | 96.8% | 59.8%(+37.0)#62 | 65.9%(+30.9)#6,575 |
| 62. | Grenloch | 96.8% | 59.8%(+37.0)#63 | 65.9%(+30.9)#6,614 |
| 63. | Ringoes | 96.6% | 59.8%(+36.9)#64 | 65.9%(+30.8)#6,756 |
| 64. | Leesburg | 96.6% | 59.8%(+36.8)#65 | 65.9%(+30.7)#6,847 |
| 65. | Belleplain | 96.5% | 59.8%(+36.8)#66 | 65.9%(+30.7)#6,868 |
| 66. | Auburn | 96.5% | 59.8%(+36.7)#67 | 65.9%(+30.6)#6,899 |
| 67. | Newfoundland | 96.5% | 59.8%(+36.7)#68 | 65.9%(+30.6)#6,938 |
| 68. | Stonebridge | 96.4% | 59.8%(+36.7)#69 | 65.9%(+30.5)#7,023 |
| 69. | Leisuretowne | 96.4% | 59.8%(+36.6)#70 | 65.9%(+30.5)#7,026 |
| 70. | Olivet | 96.4% | 59.8%(+36.6)#71 | 65.9%(+30.5)#7,107 |
| 71. | Fairview | 96.2% | 59.8%(+36.4)#72 | 65.9%(+30.3)#7,250 |
| 72. | Sheppards Mill | 96.2% | 59.8%(+36.4)#73 | 65.9%(+30.3)#7,271 |
| 73. | Mantoloking Borough | 96.2% | 59.8%(+36.4)#74 | 65.9%(+30.3)#7,317 |
| 74. | Cumberland-Hesstown | 96.1% | 59.8%(+36.4)#75 | 65.9%(+30.3)#7,358 |
| 75. | Lake Telemark | 96.1% | 59.8%(+36.3)#76 | 65.9%(+30.2)#7,429 |
| 76. | Sea Bright Borough | 95.9% | 59.8%(+36.1)#77 | 65.9%(+30.0)#7,658 |
| 77. | Jobstown | 95.8% | 59.8%(+36.0)#78 | 65.9%(+29.9)#7,763 |
| 78. | Vernon Valley | 95.8% | 59.8%(+36.0)#79 | 65.9%(+29.9)#7,818 |
| 79. | North Cape May | 95.7% | 59.8%(+35.9)#80 | 65.9%(+29.8)#7,891 |
| 80. | Rumson Borough | 95.6% | 59.8%(+35.8)#81 | 65.9%(+29.7)#7,990 |
| 81. | Wanamassa | 95.6% | 59.8%(+35.8)#82 | 65.9%(+29.7)#8,017 |
| 82. | Lavallette Borough | 95.6% | 59.8%(+35.8)#83 | 65.9%(+29.7)#8,019 |
| 83. | Corbin City | 95.6% | 59.8%(+35.8)#84 | 65.9%(+29.7)#8,057 |
| 84. | Port Republic | 95.4% | 59.8%(+35.6)#85 | 65.9%(+29.5)#8,262 |
| 85. | Silver Lake Cdp Warren County | 95.4% | 59.8%(+35.6)#86 | 65.9%(+29.5)#8,306 |
| 86. | Pine Ridge At Crestwood | 95.4% | 59.8%(+35.6)#87 | 65.9%(+29.5)#8,317 |
| 87. | Brielle Borough | 95.3% | 59.8%(+35.5)#88 | 65.9%(+29.4)#8,430 |
| 88. | Silver Ridge | 95.2% | 59.8%(+35.4)#89 | 65.9%(+29.3)#8,494 |
| 89. | Marksboro | 95.2% | 59.8%(+35.4)#90 | 65.9%(+29.3)#8,553 |
| 90. | Stewartsville | 95.1% | 59.8%(+35.4)#91 | 65.9%(+29.3)#8,578 |
| 91. | Clearbrook | 95.1% | 59.8%(+35.3)#92 | 65.9%(+29.2)#8,584 |
| 92. | Avalon Borough | 95.0% | 59.8%(+35.2)#93 | 65.9%(+29.1)#8,733 |
| 93. | Allenwood | 94.9% | 59.8%(+35.1)#94 | 65.9%(+29.0)#8,914 |
| 94. | Waretown | 94.8% | 59.8%(+35.0)#95 | 65.9%(+28.9)#8,973 |
| 95. | Stockton Borough | 94.7% | 59.8%(+35.0)#96 | 65.9%(+28.9)#9,072 |
| 96. | Haddon Heights Borough | 94.7% | 59.8%(+34.9)#97 | 65.9%(+28.8)#9,099 |
| 97. | Alloway | 94.7% | 59.8%(+34.9)#98 | 65.9%(+28.8)#9,148 |
| 98. | Pitman Borough | 94.6% | 59.8%(+34.9)#99 | 65.9%(+28.7)#9,201 |
| 99. | Margate City | 94.5% | 59.8%(+34.7)#100 | 65.9%(+28.6)#9,345 |
| 100. | Marmora | 94.4% | 59.8%(+34.7)#101 | 65.9%(+28.5)#9,446 |
Common Questions
What are the Top 10 Cities with the Highest Percentage of White / Caucasian Population in New Jersey?
Top 10 Cities with the Highest Percentage of White / Caucasian Population in New Jersey are:
#1
100.0%
#2
100.0%
#3
100.0%
#4
100.0%
#5
100.0%
#6
100.0%
#7
100.0%
#8
100.0%
#9
100.0%
#10
100.0%
What city has the Highest Percentage of White / Caucasian Population in New Jersey?
New Egypt has the Highest Percentage of White / Caucasian Population in New Jersey with 100.0%.
What is the Percentage of White / Caucasian Population in the State of New Jersey?
Percentage of White / Caucasian Population in New Jersey is 59.8%.
What is the Percentage of White / Caucasian Population in the United States?
Percentage of White / Caucasian Population in the United States is 65.9%.