Cities with the Largest Croatian Community in New Jersey
RELATED REPORTS & OPTIONS
Croatian
New Jersey
Compare Cities
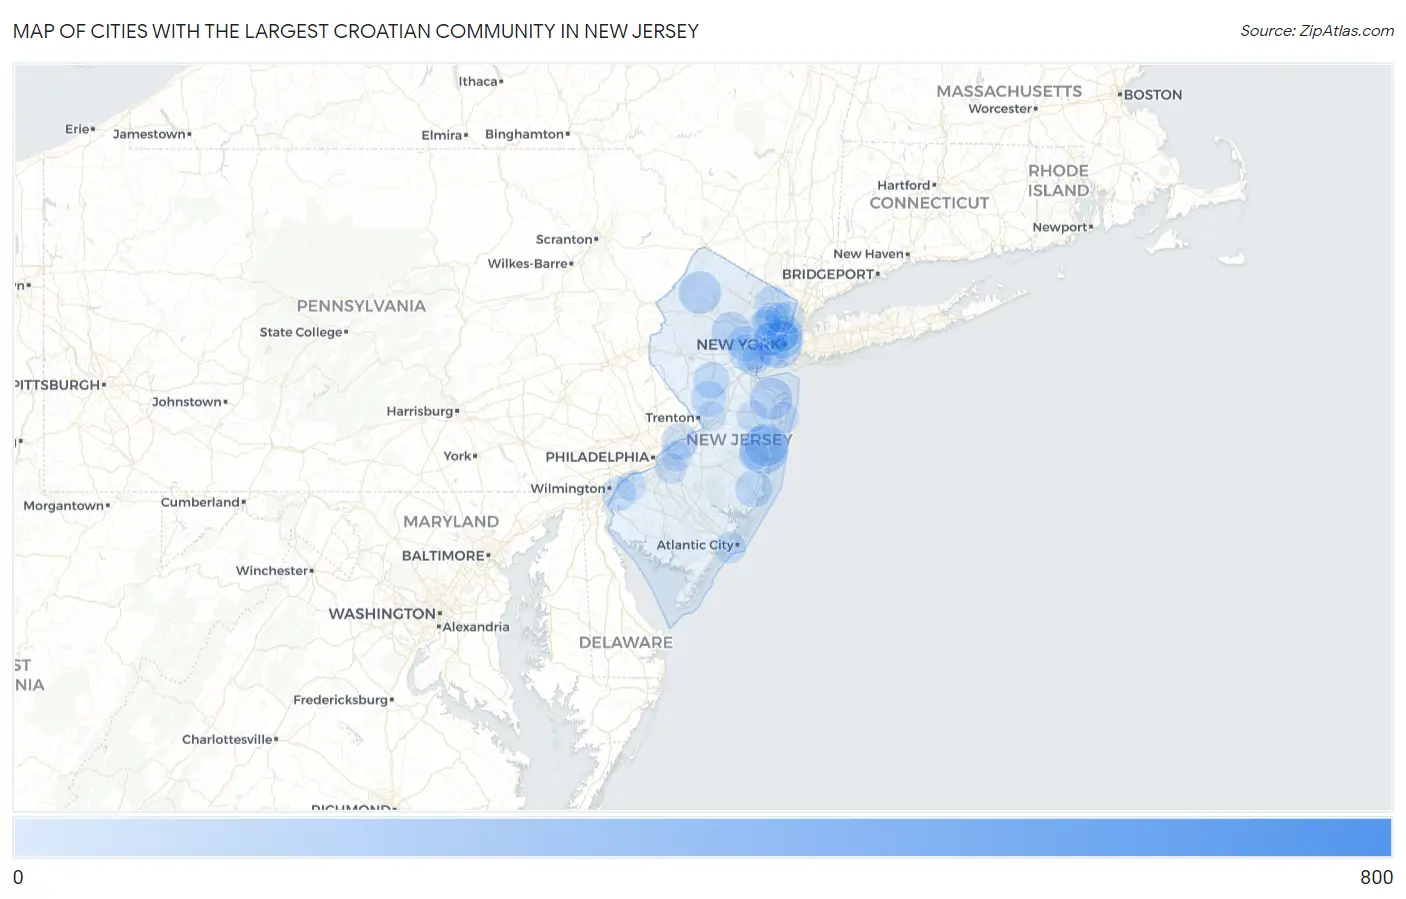
Map of Cities with the Largest Croatian Community in New Jersey
0
800
Cities with the Largest Croatian Community in New Jersey
| City | Croatian | vs State | vs National | |
| 1. | Cliffside Park Borough | 602 | 12,690(4.74%)#1 | 399,455(0.15%)#50 |
| 2. | Fairview Borough | 370 | 12,690(2.92%)#2 | 399,455(0.09%)#100 |
| 3. | Ridgefield Borough | 207 | 12,690(1.63%)#3 | 399,455(0.05%)#257 |
| 4. | Paramus Borough | 181 | 12,690(1.43%)#4 | 399,455(0.05%)#330 |
| 5. | Jersey City | 154 | 12,690(1.21%)#5 | 399,455(0.04%)#411 |
| 6. | Montvale Borough | 152 | 12,690(1.20%)#6 | 399,455(0.04%)#418 |
| 7. | Preakness | 149 | 12,690(1.17%)#7 | 399,455(0.04%)#435 |
| 8. | Flanders | 149 | 12,690(1.17%)#8 | 399,455(0.04%)#437 |
| 9. | Westwood Borough | 147 | 12,690(1.16%)#9 | 399,455(0.04%)#445 |
| 10. | Toms River | 145 | 12,690(1.14%)#10 | 399,455(0.04%)#452 |
| 11. | Fort Lee Borough | 145 | 12,690(1.14%)#11 | 399,455(0.04%)#453 |
| 12. | Lodi Borough | 129 | 12,690(1.02%)#12 | 399,455(0.03%)#513 |
| 13. | North Haledon Borough | 124 | 12,690(0.98%)#13 | 399,455(0.03%)#536 |
| 14. | River Edge Borough | 114 | 12,690(0.90%)#14 | 399,455(0.03%)#598 |
| 15. | Leisure Village East | 111 | 12,690(0.87%)#15 | 399,455(0.03%)#616 |
| 16. | Newton | 109 | 12,690(0.86%)#16 | 399,455(0.03%)#631 |
| 17. | Lincroft | 107 | 12,690(0.84%)#17 | 399,455(0.03%)#640 |
| 18. | Glen Rock Borough | 98 | 12,690(0.77%)#18 | 399,455(0.02%)#705 |
| 19. | Maywood Borough | 98 | 12,690(0.77%)#19 | 399,455(0.02%)#706 |
| 20. | Hoboken | 93 | 12,690(0.73%)#20 | 399,455(0.02%)#745 |
| 21. | Upper Saddle River Borough | 90 | 12,690(0.71%)#21 | 399,455(0.02%)#778 |
| 22. | Morristown | 87 | 12,690(0.69%)#22 | 399,455(0.02%)#806 |
| 23. | Emerson Borough | 84 | 12,690(0.66%)#23 | 399,455(0.02%)#840 |
| 24. | Elmwood Park Borough | 80 | 12,690(0.63%)#24 | 399,455(0.02%)#881 |
| 25. | Roseland Borough | 79 | 12,690(0.62%)#25 | 399,455(0.02%)#891 |
| 26. | Parsippany | 73 | 12,690(0.58%)#26 | 399,455(0.02%)#950 |
| 27. | Ocean Acres | 72 | 12,690(0.57%)#27 | 399,455(0.02%)#962 |
| 28. | Fair Lawn Borough | 69 | 12,690(0.54%)#28 | 399,455(0.02%)#1,000 |
| 29. | Oakland Borough | 69 | 12,690(0.54%)#29 | 399,455(0.02%)#1,005 |
| 30. | Beverly | 69 | 12,690(0.54%)#30 | 399,455(0.02%)#1,009 |
| 31. | Belle Mead | 66 | 12,690(0.52%)#31 | 399,455(0.02%)#1,056 |
| 32. | Westfield | 65 | 12,690(0.51%)#32 | 399,455(0.02%)#1,062 |
| 33. | Ridgewood | 64 | 12,690(0.50%)#33 | 399,455(0.02%)#1,073 |
| 34. | Princeton | 63 | 12,690(0.50%)#34 | 399,455(0.02%)#1,085 |
| 35. | Summit | 62 | 12,690(0.49%)#35 | 399,455(0.02%)#1,101 |
| 36. | Oldwick | 60 | 12,690(0.47%)#36 | 399,455(0.02%)#1,159 |
| 37. | Red Bank Borough | 59 | 12,690(0.46%)#37 | 399,455(0.01%)#1,171 |
| 38. | West New York | 58 | 12,690(0.46%)#38 | 399,455(0.01%)#1,179 |
| 39. | Palisades Park Borough | 56 | 12,690(0.44%)#39 | 399,455(0.01%)#1,216 |
| 40. | Closter Borough | 56 | 12,690(0.44%)#40 | 399,455(0.01%)#1,217 |
| 41. | Kearny | 55 | 12,690(0.43%)#41 | 399,455(0.01%)#1,228 |
| 42. | Robbinsville Center | 54 | 12,690(0.43%)#42 | 399,455(0.01%)#1,260 |
| 43. | Chatham Borough | 53 | 12,690(0.42%)#43 | 399,455(0.01%)#1,280 |
| 44. | Carneys Point | 52 | 12,690(0.41%)#44 | 399,455(0.01%)#1,306 |
| 45. | Rutherford Borough | 51 | 12,690(0.40%)#45 | 399,455(0.01%)#1,320 |
| 46. | Waldwick Borough | 51 | 12,690(0.40%)#46 | 399,455(0.01%)#1,325 |
| 47. | Eatontown Borough | 49 | 12,690(0.39%)#47 | 399,455(0.01%)#1,366 |
| 48. | Harrington Park Borough | 49 | 12,690(0.39%)#48 | 399,455(0.01%)#1,374 |
| 49. | Riverdale Borough | 49 | 12,690(0.39%)#49 | 399,455(0.01%)#1,376 |
| 50. | Flagtown | 49 | 12,690(0.39%)#50 | 399,455(0.01%)#1,382 |
| 51. | Franklin Lakes Borough | 48 | 12,690(0.38%)#51 | 399,455(0.01%)#1,393 |
| 52. | Garfield | 47 | 12,690(0.37%)#52 | 399,455(0.01%)#1,403 |
| 53. | Matawan Borough | 47 | 12,690(0.37%)#53 | 399,455(0.01%)#1,409 |
| 54. | South Plainfield Borough | 46 | 12,690(0.36%)#54 | 399,455(0.01%)#1,428 |
| 55. | Hopatcong Borough | 46 | 12,690(0.36%)#55 | 399,455(0.01%)#1,430 |
| 56. | Hillsdale Borough | 46 | 12,690(0.36%)#56 | 399,455(0.01%)#1,431 |
| 57. | Pompton Plains | 45 | 12,690(0.35%)#57 | 399,455(0.01%)#1,460 |
| 58. | West Long Branch Borough | 44 | 12,690(0.35%)#58 | 399,455(0.01%)#1,484 |
| 59. | Englewood | 43 | 12,690(0.34%)#59 | 399,455(0.01%)#1,497 |
| 60. | Rahway | 41 | 12,690(0.32%)#60 | 399,455(0.01%)#1,551 |
| 61. | Tenafly Borough | 41 | 12,690(0.32%)#61 | 399,455(0.01%)#1,561 |
| 62. | Bayonne | 40 | 12,690(0.32%)#62 | 399,455(0.01%)#1,581 |
| 63. | Oak Ridge | 40 | 12,690(0.32%)#63 | 399,455(0.01%)#1,597 |
| 64. | West Freehold | 39 | 12,690(0.31%)#64 | 399,455(0.01%)#1,619 |
| 65. | New Providence Borough | 39 | 12,690(0.31%)#65 | 399,455(0.01%)#1,621 |
| 66. | Tinton Falls Borough | 38 | 12,690(0.30%)#66 | 399,455(0.01%)#1,644 |
| 67. | Middlesex Borough | 38 | 12,690(0.30%)#67 | 399,455(0.01%)#1,648 |
| 68. | Hillsborough | 37 | 12,690(0.29%)#68 | 399,455(0.01%)#1,680 |
| 69. | Manasquan Borough | 37 | 12,690(0.29%)#69 | 399,455(0.01%)#1,701 |
| 70. | Old Tappan Borough | 37 | 12,690(0.29%)#70 | 399,455(0.01%)#1,702 |
| 71. | Ventnor City | 36 | 12,690(0.28%)#71 | 399,455(0.01%)#1,738 |
| 72. | Northvale Borough | 36 | 12,690(0.28%)#72 | 399,455(0.01%)#1,744 |
| 73. | Union City | 35 | 12,690(0.28%)#73 | 399,455(0.01%)#1,762 |
| 74. | Westmont | 35 | 12,690(0.28%)#74 | 399,455(0.01%)#1,780 |
| 75. | The Hills | 35 | 12,690(0.28%)#75 | 399,455(0.01%)#1,783 |
| 76. | Fair Haven Borough | 34 | 12,690(0.27%)#76 | 399,455(0.01%)#1,828 |
| 77. | Asbury Park | 33 | 12,690(0.26%)#77 | 399,455(0.01%)#1,854 |
| 78. | Ashland | 33 | 12,690(0.26%)#78 | 399,455(0.01%)#1,864 |
| 79. | Rumson Borough | 32 | 12,690(0.25%)#79 | 399,455(0.01%)#1,907 |
| 80. | Moorestown Lenola | 31 | 12,690(0.24%)#80 | 399,455(0.01%)#1,950 |
| 81. | East Rutherford Borough | 31 | 12,690(0.24%)#81 | 399,455(0.01%)#1,954 |
| 82. | Madison Borough | 30 | 12,690(0.24%)#82 | 399,455(0.01%)#1,984 |
| 83. | Roselle Park Borough | 30 | 12,690(0.24%)#83 | 399,455(0.01%)#1,986 |
| 84. | Holiday City Berkeley | 30 | 12,690(0.24%)#84 | 399,455(0.01%)#1,990 |
| 85. | Freehold Borough | 30 | 12,690(0.24%)#85 | 399,455(0.01%)#1,991 |
| 86. | Haddonfield Borough | 30 | 12,690(0.24%)#86 | 399,455(0.01%)#1,992 |
| 87. | Brookdale | 30 | 12,690(0.24%)#87 | 399,455(0.01%)#1,995 |
| 88. | New Vernon | 30 | 12,690(0.24%)#88 | 399,455(0.01%)#2,016 |
| 89. | Linden | 29 | 12,690(0.23%)#89 | 399,455(0.01%)#2,027 |
| 90. | Wood Ridge Borough | 29 | 12,690(0.23%)#90 | 399,455(0.01%)#2,043 |
| 91. | Butler Borough | 29 | 12,690(0.23%)#91 | 399,455(0.01%)#2,047 |
| 92. | Bergenfield Borough | 28 | 12,690(0.22%)#92 | 399,455(0.01%)#2,083 |
| 93. | Dumont Borough | 28 | 12,690(0.22%)#93 | 399,455(0.01%)#2,090 |
| 94. | Fanwood Borough | 28 | 12,690(0.22%)#94 | 399,455(0.01%)#2,100 |
| 95. | Clifton | 26 | 12,690(0.20%)#95 | 399,455(0.01%)#2,169 |
| 96. | Hackensack | 26 | 12,690(0.20%)#96 | 399,455(0.01%)#2,176 |
| 97. | Florham Park Borough | 26 | 12,690(0.20%)#97 | 399,455(0.01%)#2,195 |
| 98. | Kinnelon Borough | 25 | 12,690(0.20%)#98 | 399,455(0.01%)#2,256 |
| 99. | Hamilton Square | 24 | 12,690(0.19%)#99 | 399,455(0.01%)#2,298 |
| 100. | Beckett | 24 | 12,690(0.19%)#100 | 399,455(0.01%)#2,310 |
Common Questions
What are the Top 10 Cities with the Largest Croatian Community in New Jersey?
Top 10 Cities with the Largest Croatian Community in New Jersey are:
#1
154
#2
145
#3
111
#4
109
#5
107
#6
93
#7
87
#8
72
#9
69
#10
66
What city has the Largest Croatian Community in New Jersey?
Jersey City has the Largest Croatian Community in New Jersey with 154.
What is the Total Croatian Population in the State of New Jersey?
Total Croatian Population in New Jersey is 12,690.
What is the Total Croatian Population in the United States?
Total Croatian Population in the United States is 399,455.