Cranbury, NJ Map & Demographics
Cranbury Map
Cranbury Overview
$85,161
PER CAPITA INCOME
$223,917
AVG FAMILY INCOME
$202,250
AVG HOUSEHOLD INCOME
39.9%
WAGE / INCOME GAP [ % ]
60.1¢/ $1
WAGE / INCOME GAP [ $ ]
0.41
INEQUALITY / GINI INDEX
2,430
TOTAL POPULATION
1,217
MALE POPULATION
1,213
FEMALE POPULATION
100.33
MALES / 100 FEMALES
99.67
FEMALES / 100 MALES
47.5
MEDIAN AGE
3.1
AVG FAMILY SIZE
2.8
AVG HOUSEHOLD SIZE
1,529
LABOR FORCE [ PEOPLE ]
74.5%
PERCENT IN LABOR FORCE
4.4%
UNEMPLOYMENT RATE
Cranbury Zip Codes
Cranbury Area Codes
Income in Cranbury
Income Overview in Cranbury
Per Capita Income in Cranbury is $85,161, while median incomes of families and households are $223,917 and $202,250 respectively.
| Characteristic | Number | Measure |
| Per Capita Income | 2,430 | $85,161 |
| Median Family Income | 654 | $223,917 |
| Mean Family Income | 654 | $278,055 |
| Median Household Income | 835 | $202,250 |
| Mean Household Income | 835 | $243,111 |
| Income Deficit | 654 | $0 |
| Wage / Income Gap (%) | 2,430 | 39.86% |
| Wage / Income Gap ($) | 2,430 | 60.14¢ per $1 |
| Gini / Inequality Index | 2,430 | 0.41 |
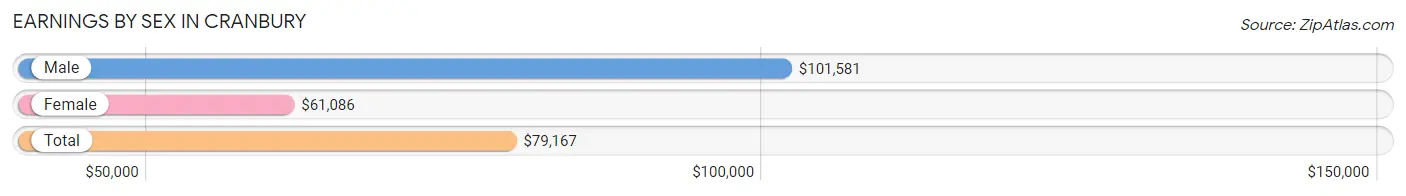
Earnings by Sex in Cranbury
Average Earnings in Cranbury are $79,167, $101,581 for men and $61,086 for women, a difference of 39.9%.
| Sex | Number | Average Earnings |
| Male | 799 (50.2%) | $101,581 |
| Female | 791 (49.7%) | $61,086 |
| Total | 1,590 (100.0%) | $79,167 |
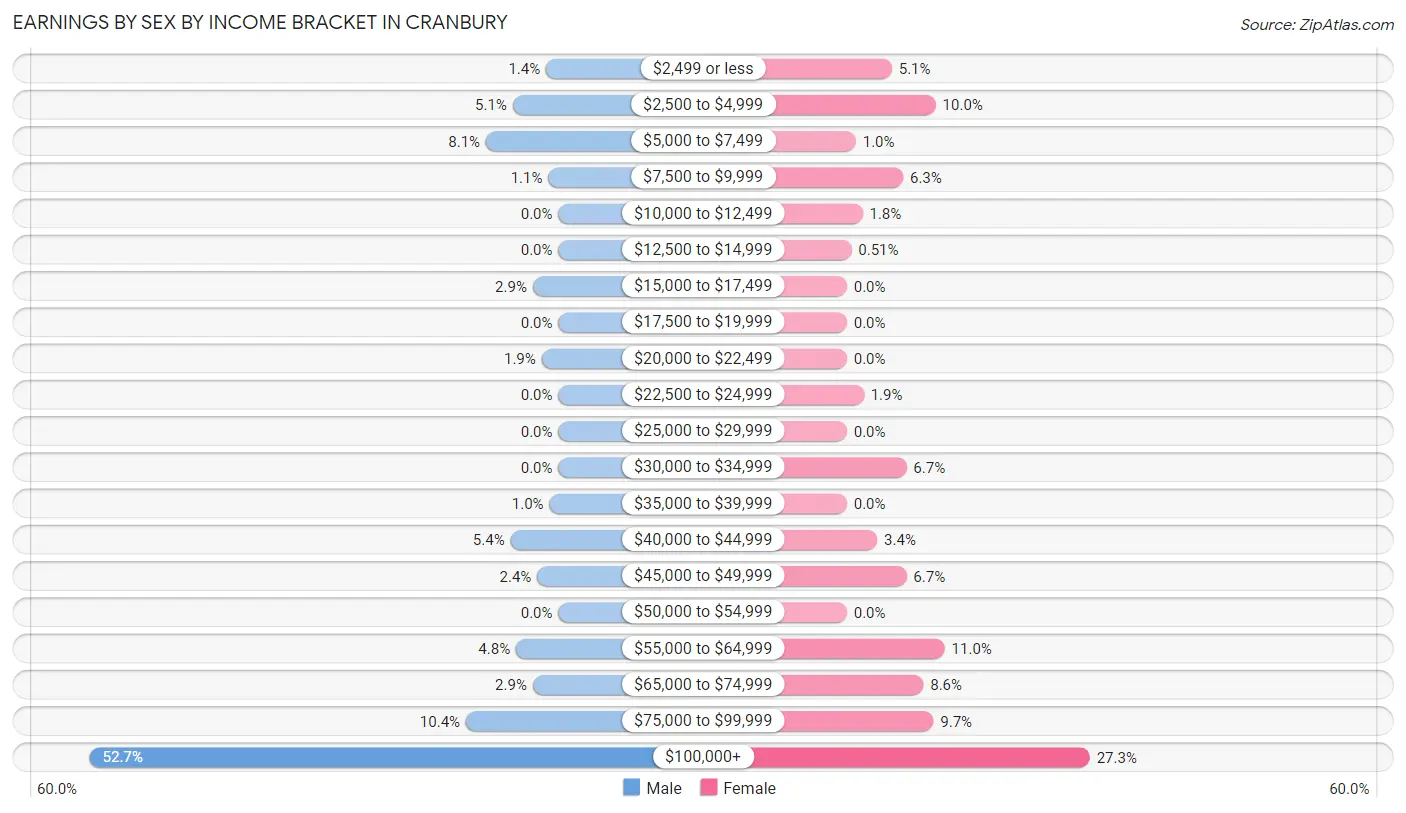
Earnings by Sex by Income Bracket in Cranbury
The most common earnings brackets in Cranbury are $100,000+ for men (421 | 52.7%) and $100,000+ for women (216 | 27.3%).
| Income | Male | Female |
| $2,499 or less | 11 (1.4%) | 40 (5.1%) |
| $2,500 to $4,999 | 41 (5.1%) | 79 (10.0%) |
| $5,000 to $7,499 | 65 (8.1%) | 8 (1.0%) |
| $7,500 to $9,999 | 9 (1.1%) | 50 (6.3%) |
| $10,000 to $12,499 | 0 (0.0%) | 14 (1.8%) |
| $12,500 to $14,999 | 0 (0.0%) | 4 (0.5%) |
| $15,000 to $17,499 | 23 (2.9%) | 0 (0.0%) |
| $17,500 to $19,999 | 0 (0.0%) | 0 (0.0%) |
| $20,000 to $22,499 | 15 (1.9%) | 0 (0.0%) |
| $22,500 to $24,999 | 0 (0.0%) | 15 (1.9%) |
| $25,000 to $29,999 | 0 (0.0%) | 0 (0.0%) |
| $30,000 to $34,999 | 0 (0.0%) | 53 (6.7%) |
| $35,000 to $39,999 | 8 (1.0%) | 0 (0.0%) |
| $40,000 to $44,999 | 43 (5.4%) | 27 (3.4%) |
| $45,000 to $49,999 | 19 (2.4%) | 53 (6.7%) |
| $50,000 to $54,999 | 0 (0.0%) | 0 (0.0%) |
| $55,000 to $64,999 | 38 (4.8%) | 87 (11.0%) |
| $65,000 to $74,999 | 23 (2.9%) | 68 (8.6%) |
| $75,000 to $99,999 | 83 (10.4%) | 77 (9.7%) |
| $100,000+ | 421 (52.7%) | 216 (27.3%) |
| Total | 799 (100.0%) | 791 (100.0%) |
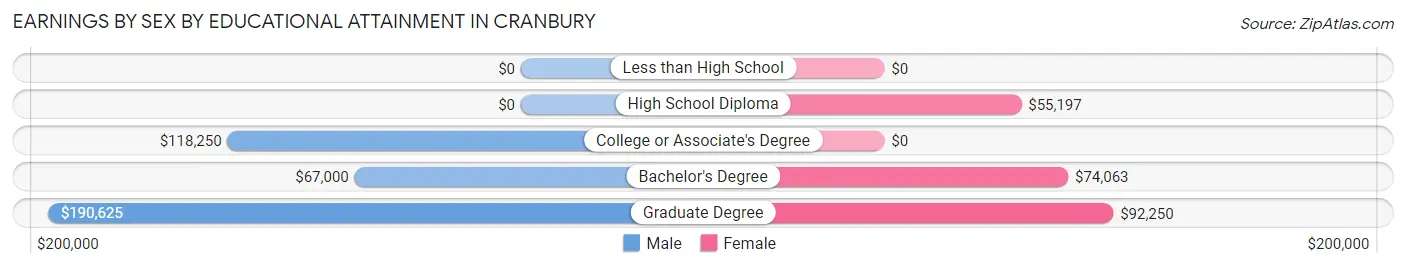
Earnings by Sex by Educational Attainment in Cranbury
Average earnings in Cranbury are $113,672 for men and $70,938 for women, a difference of 37.6%. Men with an educational attainment of graduate degree enjoy the highest average annual earnings of $190,625, while those with bachelor's degree education earn the least with $67,000. Women with an educational attainment of graduate degree earn the most with the average annual earnings of $92,250, while those with high school diploma education have the smallest earnings of $55,197.
| Educational Attainment | Male Income | Female Income |
| Less than High School | - | - |
| High School Diploma | - | - |
| College or Associate's Degree | $118,250 | $0 |
| Bachelor's Degree | $67,000 | $74,063 |
| Graduate Degree | $190,625 | $92,250 |
| Total | $113,672 | $70,938 |
Family Income in Cranbury
Family Income Brackets in Cranbury
According to the Cranbury family income data, there are 380 families falling into the $200,000+ income range, which is the most common income bracket and makes up 58.1% of all families.
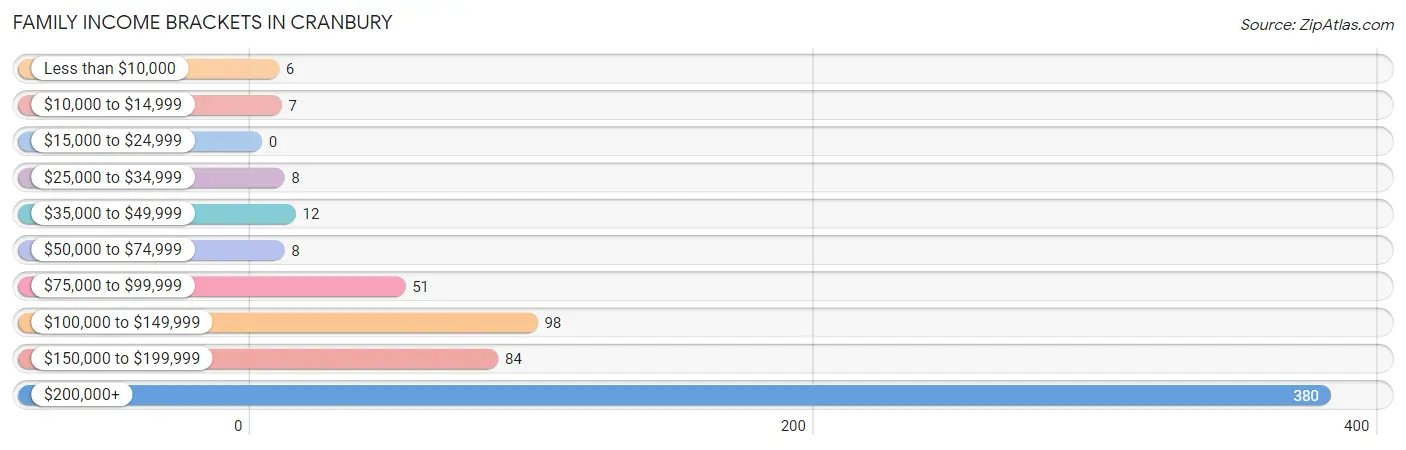
| Income Bracket | # Families | % Families |
| Less than $10,000 | 6 | 0.9% |
| $10,000 to $14,999 | 7 | 1.1% |
| $15,000 to $24,999 | 0 | 0.0% |
| $25,000 to $34,999 | 8 | 1.2% |
| $35,000 to $49,999 | 12 | 1.8% |
| $50,000 to $74,999 | 8 | 1.2% |
| $75,000 to $99,999 | 51 | 7.8% |
| $100,000 to $149,999 | 98 | 15.0% |
| $150,000 to $199,999 | 84 | 12.8% |
| $200,000+ | 380 | 58.1% |
Family Income by Famaliy Size in Cranbury
5-person families (45 | 6.9%) account for the highest median family income in Cranbury with $250,001 per family, while 2-person families (238 | 36.4%) have the highest median income of $92,084 per family member.
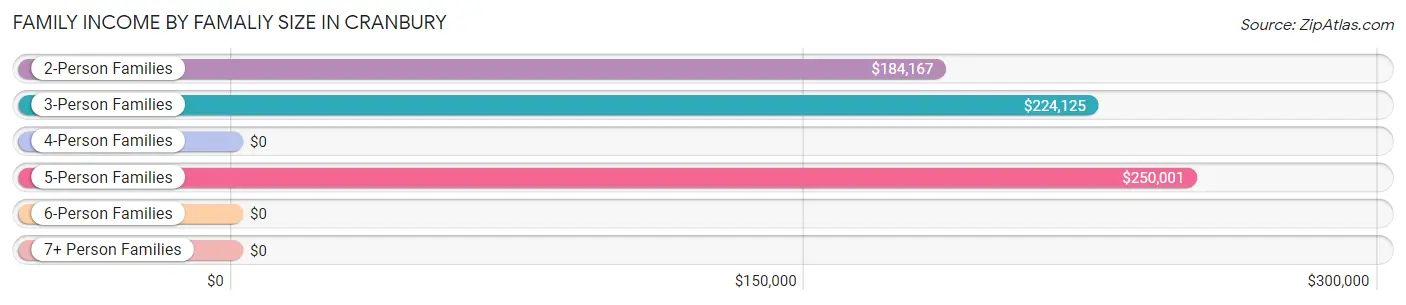
| Income Bracket | # Families | Median Income |
| 2-Person Families | 238 (36.4%) | $184,167 |
| 3-Person Families | 160 (24.5%) | $224,125 |
| 4-Person Families | 205 (31.4%) | $0 |
| 5-Person Families | 45 (6.9%) | $250,001 |
| 6-Person Families | 6 (0.9%) | $0 |
| 7+ Person Families | 0 (0.0%) | $0 |
| Total | 654 (100.0%) | $223,917 |
Family Income by Number of Earners in Cranbury
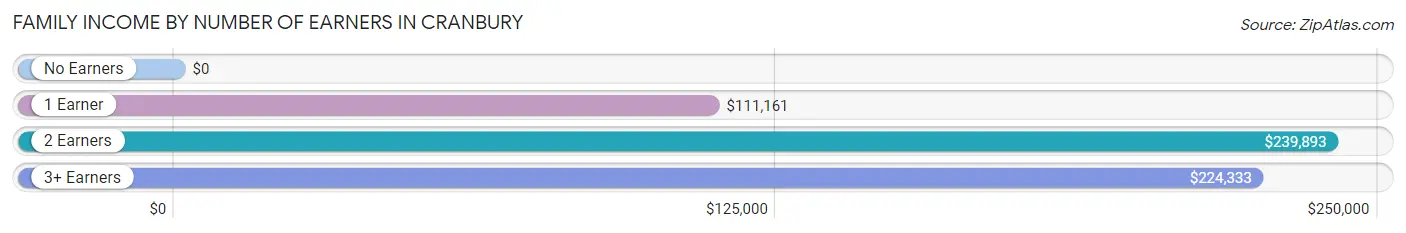
| Number of Earners | # Families | Median Income |
| No Earners | 44 (6.7%) | $0 |
| 1 Earner | 119 (18.2%) | $111,161 |
| 2 Earners | 305 (46.6%) | $239,893 |
| 3+ Earners | 186 (28.4%) | $224,333 |
| Total | 654 (100.0%) | $223,917 |
Household Income in Cranbury
Household Income Brackets in Cranbury
With 440 households falling in the category, the $200,000+ income range is the most frequent in Cranbury, accounting for 52.7% of all households.
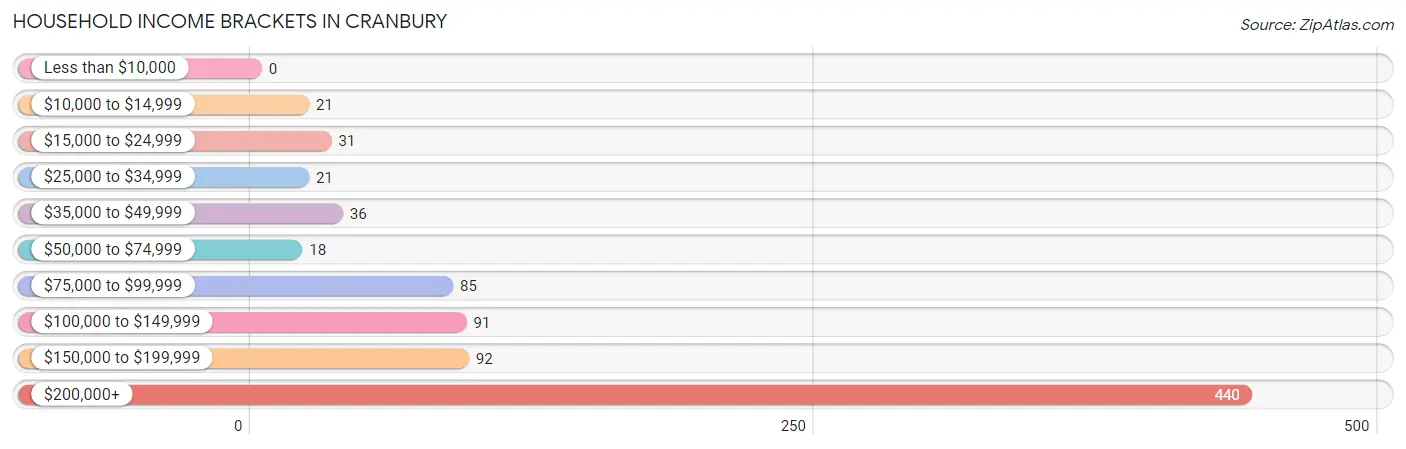
| Income Bracket | # Households | % Households |
| Less than $10,000 | 0 | 0.0% |
| $10,000 to $14,999 | 21 | 2.5% |
| $15,000 to $24,999 | 31 | 3.7% |
| $25,000 to $34,999 | 21 | 2.5% |
| $35,000 to $49,999 | 36 | 4.3% |
| $50,000 to $74,999 | 18 | 2.2% |
| $75,000 to $99,999 | 85 | 10.2% |
| $100,000 to $149,999 | 91 | 10.9% |
| $150,000 to $199,999 | 92 | 11.0% |
| $200,000+ | 440 | 52.7% |
Household Income by Householder Age in Cranbury
The median household income in Cranbury is $202,250, with the highest median household income of $209,185 found in the 45 to 64 years age bracket for the primary householder. A total of 483 households (57.8%) fall into this category.
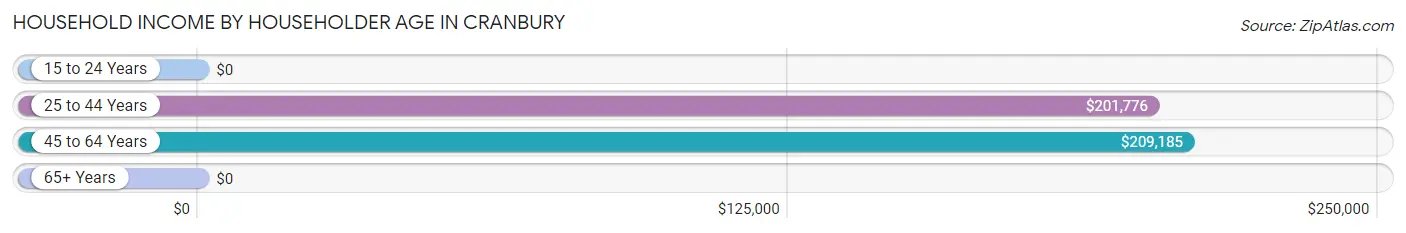
| Income Bracket | # Households | Median Income |
| 15 to 24 Years | 0 (0.0%) | $0 |
| 25 to 44 Years | 169 (20.2%) | $201,776 |
| 45 to 64 Years | 483 (57.8%) | $209,185 |
| 65+ Years | 183 (21.9%) | $0 |
| Total | 835 (100.0%) | $202,250 |
Poverty in Cranbury
Income Below Poverty by Sex and Age in Cranbury
With 5.6% poverty level for males and 2.8% for females among the residents of Cranbury, 25 to 34 year old males and 75 year old and over females are the most vulnerable to poverty, with 28 males (33.7%) and 8 females (20.5%) in their respective age groups living below the poverty level.
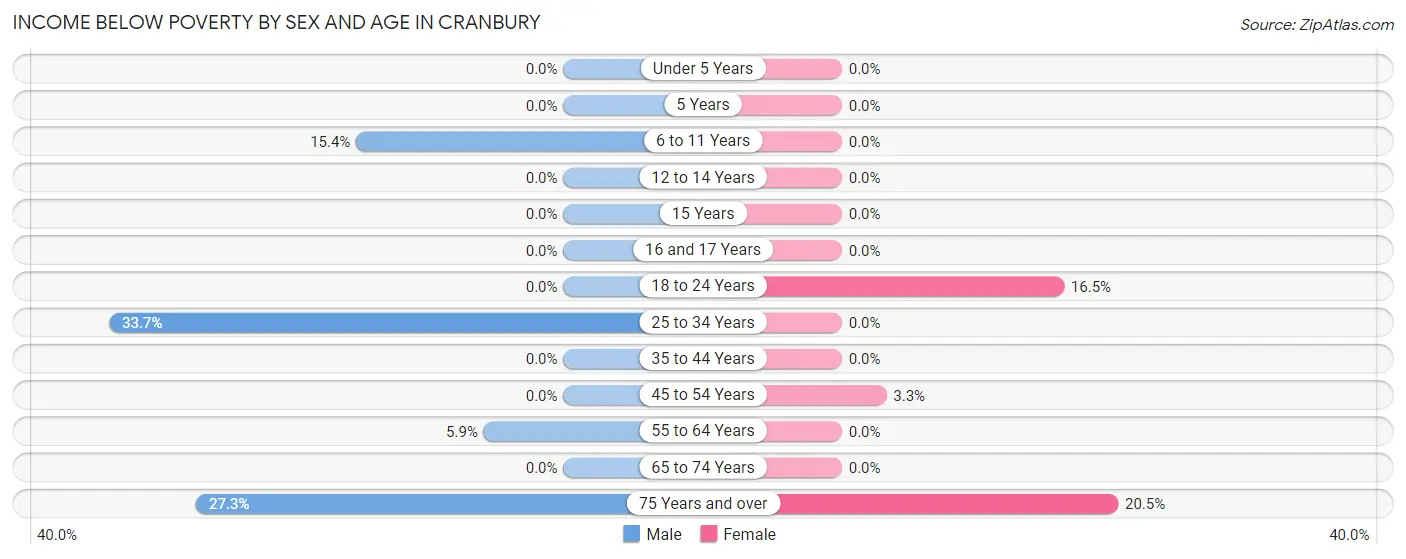
| Age Bracket | Male | Female |
| Under 5 Years | 0 (0.0%) | 0 (0.0%) |
| 5 Years | 0 (0.0%) | 0 (0.0%) |
| 6 to 11 Years | 20 (15.4%) | 0 (0.0%) |
| 12 to 14 Years | 0 (0.0%) | 0 (0.0%) |
| 15 Years | 0 (0.0%) | 0 (0.0%) |
| 16 and 17 Years | 0 (0.0%) | 0 (0.0%) |
| 18 to 24 Years | 0 (0.0%) | 16 (16.5%) |
| 25 to 34 Years | 28 (33.7%) | 0 (0.0%) |
| 35 to 44 Years | 0 (0.0%) | 0 (0.0%) |
| 45 to 54 Years | 0 (0.0%) | 8 (3.3%) |
| 55 to 64 Years | 13 (5.9%) | 0 (0.0%) |
| 65 to 74 Years | 0 (0.0%) | 0 (0.0%) |
| 75 Years and over | 6 (27.3%) | 8 (20.5%) |
| Total | 67 (5.6%) | 32 (2.8%) |
Income Above Poverty by Sex and Age in Cranbury
According to the poverty statistics in Cranbury, males aged under 5 years and females aged under 5 years are the age groups that are most secure financially, with 100.0% of males and 100.0% of females in these age groups living above the poverty line.
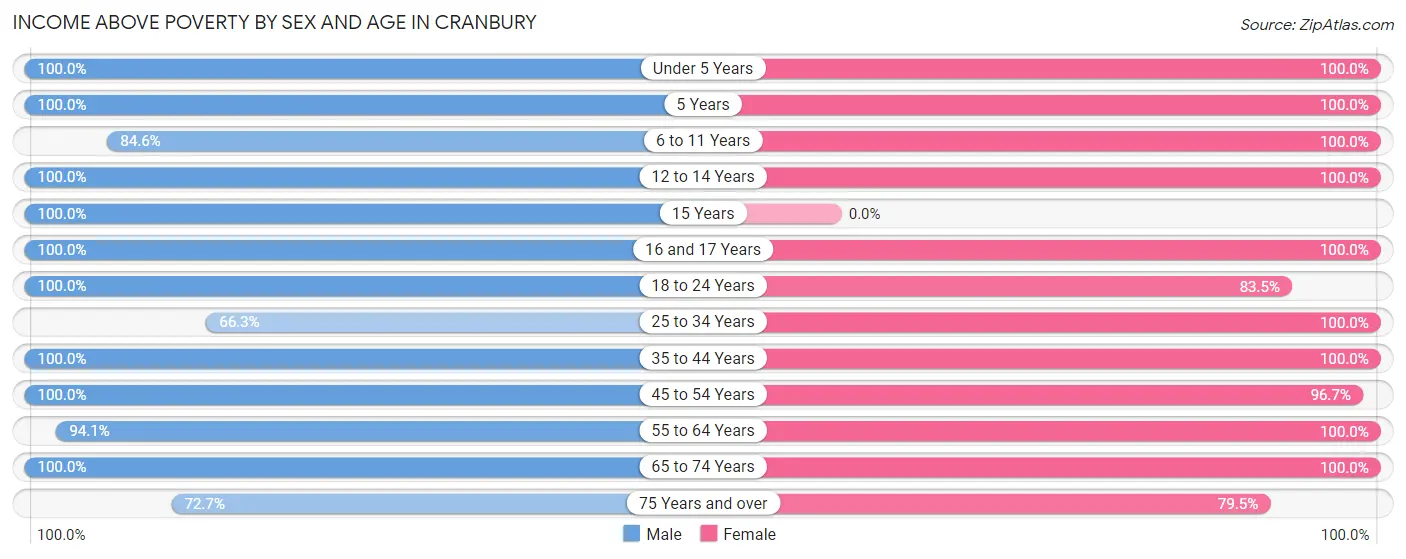
| Age Bracket | Male | Female |
| Under 5 Years | 36 (100.0%) | 9 (100.0%) |
| 5 Years | 6 (100.0%) | 28 (100.0%) |
| 6 to 11 Years | 110 (84.6%) | 50 (100.0%) |
| 12 to 14 Years | 42 (100.0%) | 55 (100.0%) |
| 15 Years | 21 (100.0%) | 0 (0.0%) |
| 16 and 17 Years | 30 (100.0%) | 59 (100.0%) |
| 18 to 24 Years | 91 (100.0%) | 81 (83.5%) |
| 25 to 34 Years | 55 (66.3%) | 129 (100.0%) |
| 35 to 44 Years | 165 (100.0%) | 128 (100.0%) |
| 45 to 54 Years | 211 (100.0%) | 234 (96.7%) |
| 55 to 64 Years | 207 (94.1%) | 187 (100.0%) |
| 65 to 74 Years | 130 (100.0%) | 133 (100.0%) |
| 75 Years and over | 16 (72.7%) | 31 (79.5%) |
| Total | 1,120 (94.4%) | 1,124 (97.2%) |
Income Below Poverty Among Married-Couple Families in Cranbury
The poverty statistics for married-couple families in Cranbury show that 1.2% or 7 of the total 583 families live below the poverty line. Families with 1 or 2 children have the highest poverty rate of 3.8%, comprising of 7 families. On the other hand, families with no children have the lowest poverty rate of 0.0%, which includes 0 families.
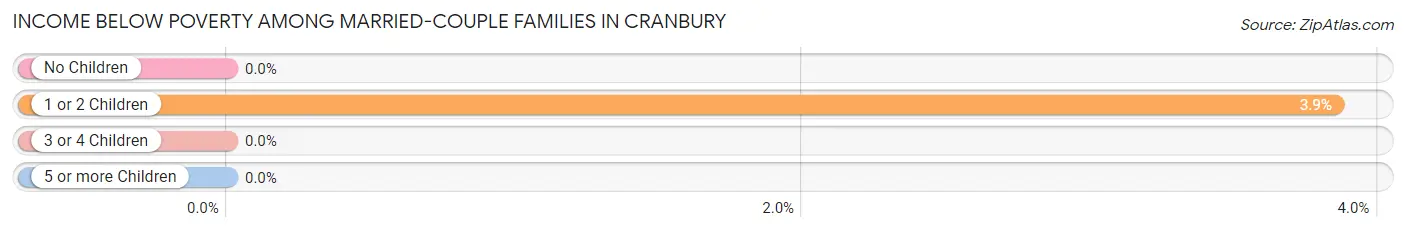
| Children | Above Poverty | Below Poverty |
| No Children | 366 (100.0%) | 0 (0.0%) |
| 1 or 2 Children | 175 (96.2%) | 7 (3.8%) |
| 3 or 4 Children | 35 (100.0%) | 0 (0.0%) |
| 5 or more Children | 0 (0.0%) | 0 (0.0%) |
| Total | 576 (98.8%) | 7 (1.2%) |
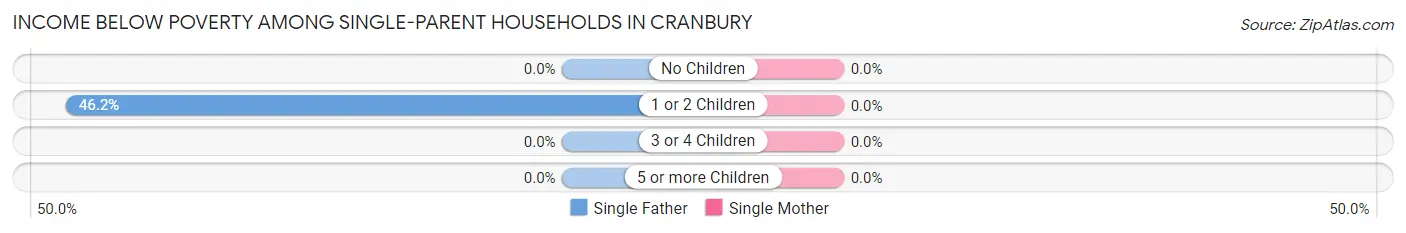
Income Below Poverty Among Single-Parent Households in Cranbury
| Children | Single Father | Single Mother |
| No Children | 0 (0.0%) | 0 (0.0%) |
| 1 or 2 Children | 6 (46.2%) | 0 (0.0%) |
| 3 or 4 Children | 0 (0.0%) | 0 (0.0%) |
| 5 or more Children | 0 (0.0%) | 0 (0.0%) |
| Total | 6 (23.1%) | 0 (0.0%) |
Income Below Poverty Among Married-Couple vs Single-Parent Households in Cranbury
The poverty data for Cranbury shows that 7 of the married-couple family households (1.2%) and 6 of the single-parent households (8.5%) are living below the poverty level. Within the married-couple family households, those with 1 or 2 children have the highest poverty rate, with 7 households (3.8%) falling below the poverty line. Among the single-parent households, those with 1 or 2 children have the highest poverty rate, with 6 household (12.5%) living below poverty.
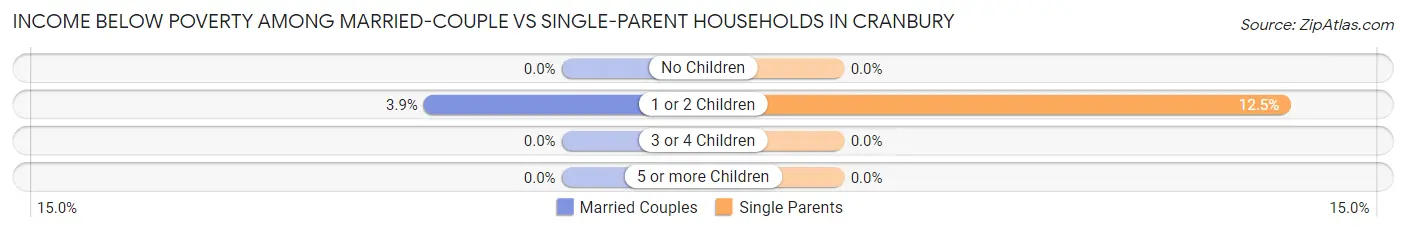
| Children | Married-Couple Families | Single-Parent Households |
| No Children | 0 (0.0%) | 0 (0.0%) |
| 1 or 2 Children | 7 (3.8%) | 6 (12.5%) |
| 3 or 4 Children | 0 (0.0%) | 0 (0.0%) |
| 5 or more Children | 0 (0.0%) | 0 (0.0%) |
| Total | 7 (1.2%) | 6 (8.5%) |
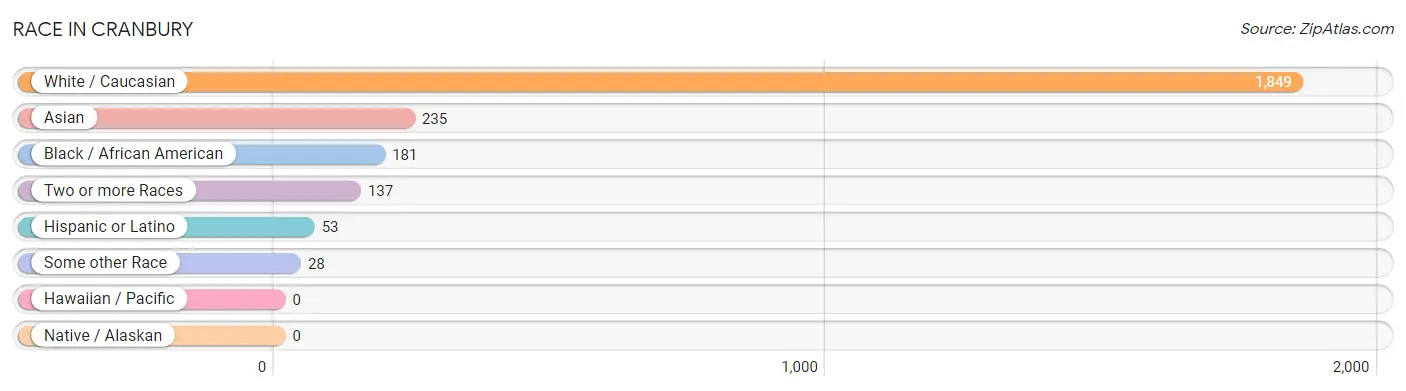
Race in Cranbury
The most populous races in Cranbury are White / Caucasian (1,849 | 76.1%), Asian (235 | 9.7%), and Black / African American (181 | 7.4%).
| Race | # Population | % Population |
| Asian | 235 | 9.7% |
| Black / African American | 181 | 7.4% |
| Hawaiian / Pacific | 0 | 0.0% |
| Hispanic or Latino | 53 | 2.2% |
| Native / Alaskan | 0 | 0.0% |
| White / Caucasian | 1,849 | 76.1% |
| Two or more Races | 137 | 5.6% |
| Some other Race | 28 | 1.1% |
| Total | 2,430 | 100.0% |
Ancestry in Cranbury
The most populous ancestries reported in Cranbury are Italian (600 | 24.7%), Irish (466 | 19.2%), English (263 | 10.8%), German (201 | 8.3%), and Thai (183 | 7.5%), together accounting for 70.5% of all Cranbury residents.
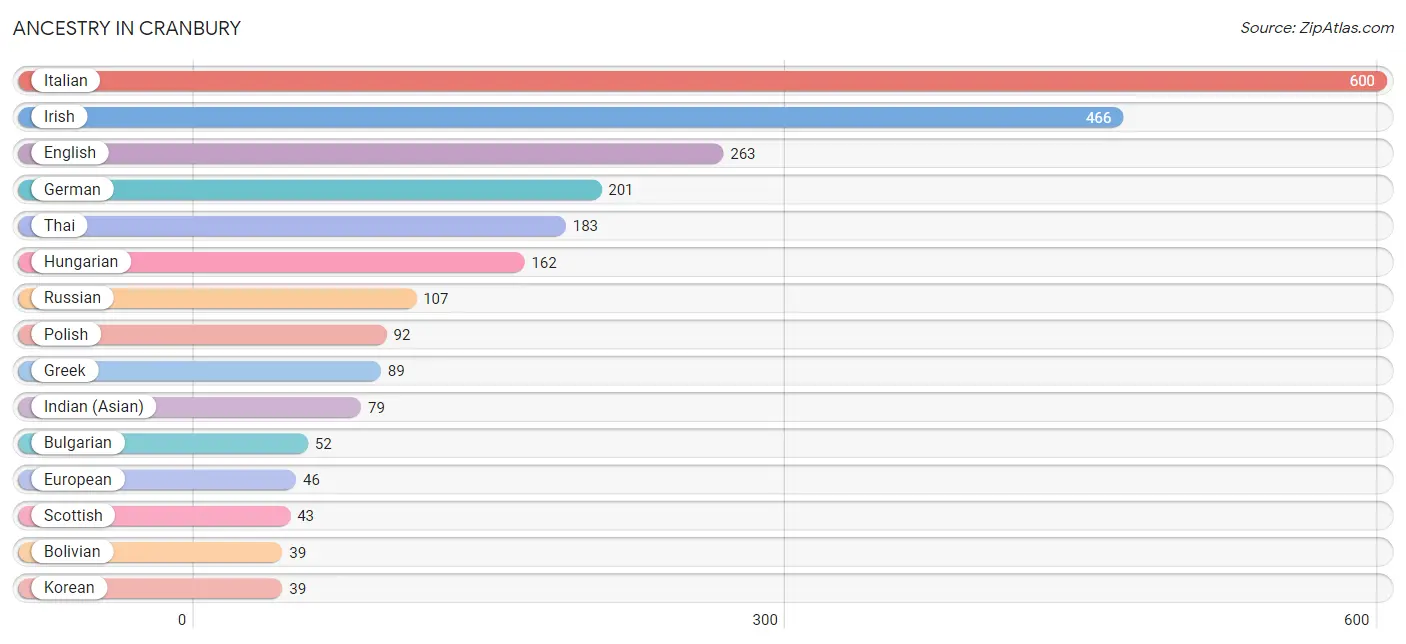
| Ancestry | # Population | % Population |
| Arab | 23 | 0.9% |
| Armenian | 13 | 0.5% |
| Bolivian | 39 | 1.6% |
| British | 15 | 0.6% |
| Bulgarian | 52 | 2.1% |
| Czech | 22 | 0.9% |
| Dutch | 13 | 0.5% |
| Eastern European | 22 | 0.9% |
| Egyptian | 11 | 0.4% |
| English | 263 | 10.8% |
| European | 46 | 1.9% |
| French | 24 | 1.0% |
| German | 201 | 8.3% |
| Greek | 89 | 3.7% |
| Hungarian | 162 | 6.7% |
| Indian (Asian) | 79 | 3.3% |
| Irish | 466 | 19.2% |
| Italian | 600 | 24.7% |
| Korean | 39 | 1.6% |
| Palestinian | 12 | 0.5% |
| Polish | 92 | 3.8% |
| Puerto Rican | 14 | 0.6% |
| Russian | 107 | 4.4% |
| Scottish | 43 | 1.8% |
| Slovak | 37 | 1.5% |
| South American | 39 | 1.6% |
| Swedish | 36 | 1.5% |
| Swiss | 11 | 0.4% |
| Thai | 183 | 7.5% |
| Welsh | 12 | 0.5% | View All 30 Rows |
Immigrants in Cranbury
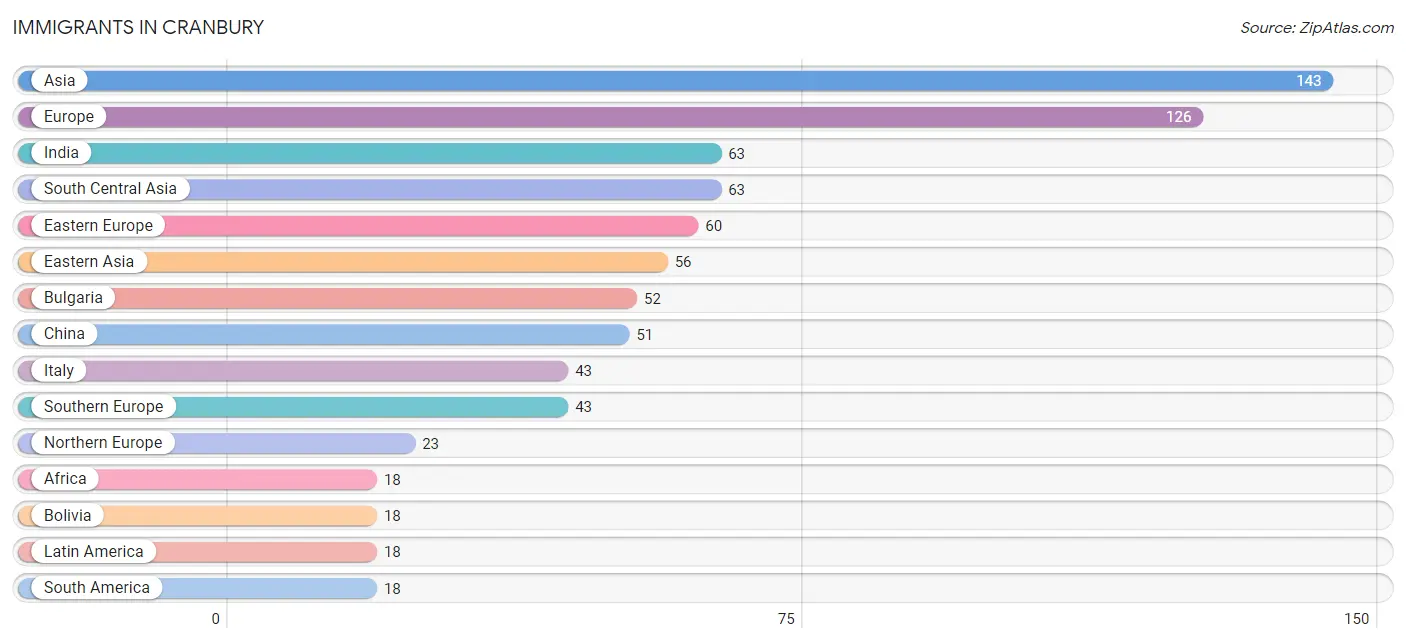
The most numerous immigrant groups reported in Cranbury came from Asia (143 | 5.9%), Europe (126 | 5.2%), India (63 | 2.6%), South Central Asia (63 | 2.6%), and Eastern Europe (60 | 2.5%), together accounting for 18.7% of all Cranbury residents.
| Immigration Origin | # Population | % Population |
| Africa | 18 | 0.7% |
| Asia | 143 | 5.9% |
| Bolivia | 18 | 0.7% |
| Bulgaria | 52 | 2.1% |
| China | 51 | 2.1% |
| Eastern Africa | 7 | 0.3% |
| Eastern Asia | 56 | 2.3% |
| Eastern Europe | 60 | 2.5% |
| Egypt | 11 | 0.4% |
| Europe | 126 | 5.2% |
| Hong Kong | 17 | 0.7% |
| Hungary | 8 | 0.3% |
| India | 63 | 2.6% |
| Ireland | 7 | 0.3% |
| Israel | 12 | 0.5% |
| Italy | 43 | 1.8% |
| Korea | 5 | 0.2% |
| Latin America | 18 | 0.7% |
| Northern Africa | 11 | 0.4% |
| Northern Europe | 23 | 0.9% |
| Philippines | 12 | 0.5% |
| South America | 18 | 0.7% |
| South Central Asia | 63 | 2.6% |
| South Eastern Asia | 12 | 0.5% |
| Southern Europe | 43 | 1.8% |
| Sweden | 16 | 0.7% |
| Western Asia | 12 | 0.5% | View All 27 Rows |
Sex and Age in Cranbury
Sex and Age in Cranbury
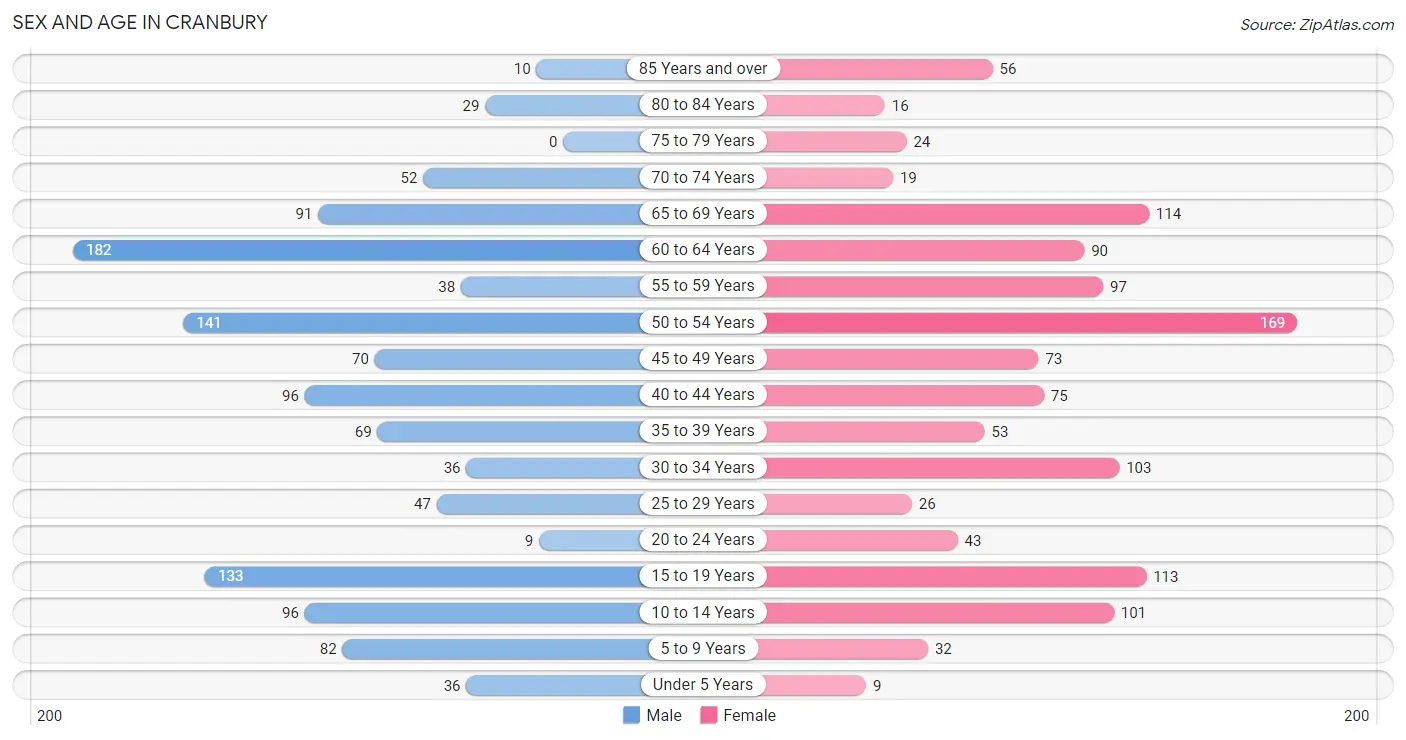
The most populous age groups in Cranbury are 60 to 64 Years (182 | 14.9%) for men and 50 to 54 Years (169 | 13.9%) for women.
| Age Bracket | Male | Female |
| Under 5 Years | 36 (3.0%) | 9 (0.7%) |
| 5 to 9 Years | 82 (6.7%) | 32 (2.6%) |
| 10 to 14 Years | 96 (7.9%) | 101 (8.3%) |
| 15 to 19 Years | 133 (10.9%) | 113 (9.3%) |
| 20 to 24 Years | 9 (0.7%) | 43 (3.5%) |
| 25 to 29 Years | 47 (3.9%) | 26 (2.1%) |
| 30 to 34 Years | 36 (3.0%) | 103 (8.5%) |
| 35 to 39 Years | 69 (5.7%) | 53 (4.4%) |
| 40 to 44 Years | 96 (7.9%) | 75 (6.2%) |
| 45 to 49 Years | 70 (5.8%) | 73 (6.0%) |
| 50 to 54 Years | 141 (11.6%) | 169 (13.9%) |
| 55 to 59 Years | 38 (3.1%) | 97 (8.0%) |
| 60 to 64 Years | 182 (14.9%) | 90 (7.4%) |
| 65 to 69 Years | 91 (7.5%) | 114 (9.4%) |
| 70 to 74 Years | 52 (4.3%) | 19 (1.6%) |
| 75 to 79 Years | 0 (0.0%) | 24 (2.0%) |
| 80 to 84 Years | 29 (2.4%) | 16 (1.3%) |
| 85 Years and over | 10 (0.8%) | 56 (4.6%) |
| Total | 1,217 (100.0%) | 1,213 (100.0%) |
Families and Households in Cranbury
Median Family Size in Cranbury
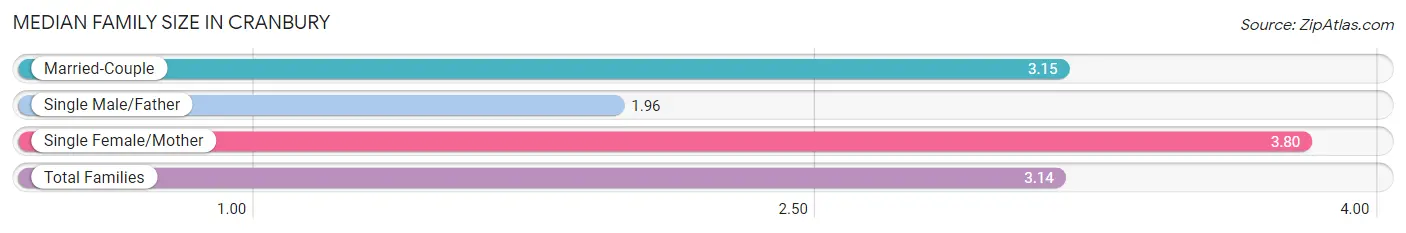
The median family size in Cranbury is 3.14 persons per family, with single female/mother families (45 | 6.9%) accounting for the largest median family size of 3.8 persons per family. On the other hand, single male/father families (26 | 4.0%) represent the smallest median family size with 1.96 persons per family.
| Family Type | # Families | Family Size |
| Married-Couple | 583 (89.1%) | 3.15 |
| Single Male/Father | 26 (4.0%) | 1.96 |
| Single Female/Mother | 45 (6.9%) | 3.80 |
| Total Families | 654 (100.0%) | 3.14 |
Median Household Size in Cranbury
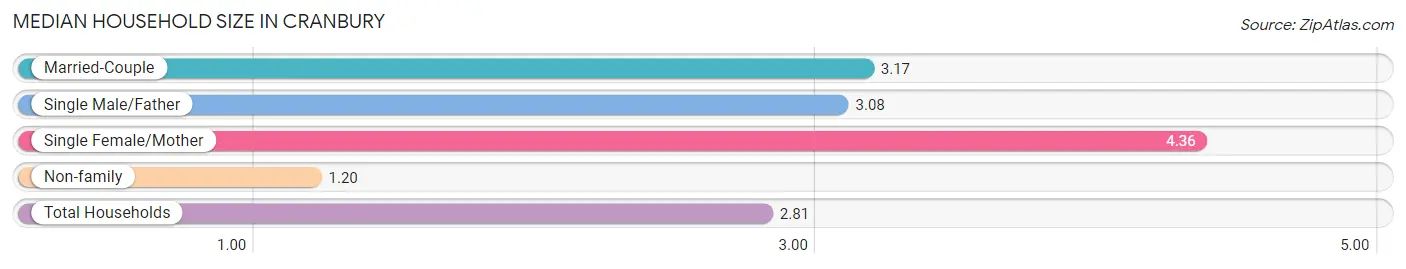
The median household size in Cranbury is 2.81 persons per household, with single female/mother households (45 | 5.4%) accounting for the largest median household size of 4.36 persons per household. non-family households (181 | 21.7%) represent the smallest median household size with 1.20 persons per household.
| Household Type | # Households | Household Size |
| Married-Couple | 583 (69.8%) | 3.17 |
| Single Male/Father | 26 (3.1%) | 3.08 |
| Single Female/Mother | 45 (5.4%) | 4.36 |
| Non-family | 181 (21.7%) | 1.20 |
| Total Households | 835 (100.0%) | 2.81 |
Household Size by Marriage Status in Cranbury
Out of a total of 835 households in Cranbury, 654 (78.3%) are family households, while 181 (21.7%) are nonfamily households. The most numerous type of family households are 2-person households, comprising 212, and the most common type of nonfamily households are 1-person households, comprising 150.
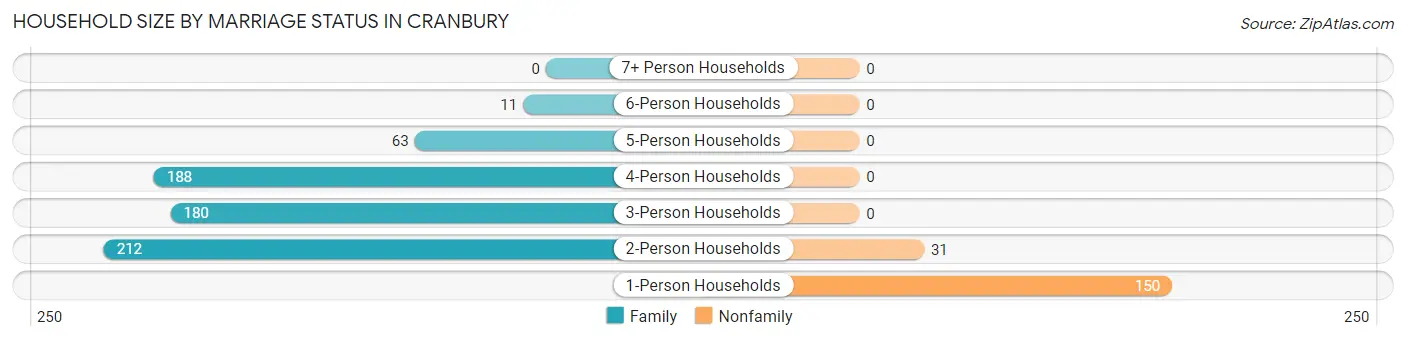
| Household Size | Family Households | Nonfamily Households |
| 1-Person Households | - | 150 (18.0%) |
| 2-Person Households | 212 (25.4%) | 31 (3.7%) |
| 3-Person Households | 180 (21.6%) | 0 (0.0%) |
| 4-Person Households | 188 (22.5%) | 0 (0.0%) |
| 5-Person Households | 63 (7.5%) | 0 (0.0%) |
| 6-Person Households | 11 (1.3%) | 0 (0.0%) |
| 7+ Person Households | 0 (0.0%) | 0 (0.0%) |
| Total | 654 (78.3%) | 181 (21.7%) |
Female Fertility in Cranbury
Fertility by Age in Cranbury
Average fertility rate in Cranbury is 15.0 births per 1,000 women. Women in the age bracket of 20 to 34 years have the highest fertility rate with 47.0 births per 1,000 women. Women in the age bracket of 20 to 34 years acount for 100.0% of all women with births.
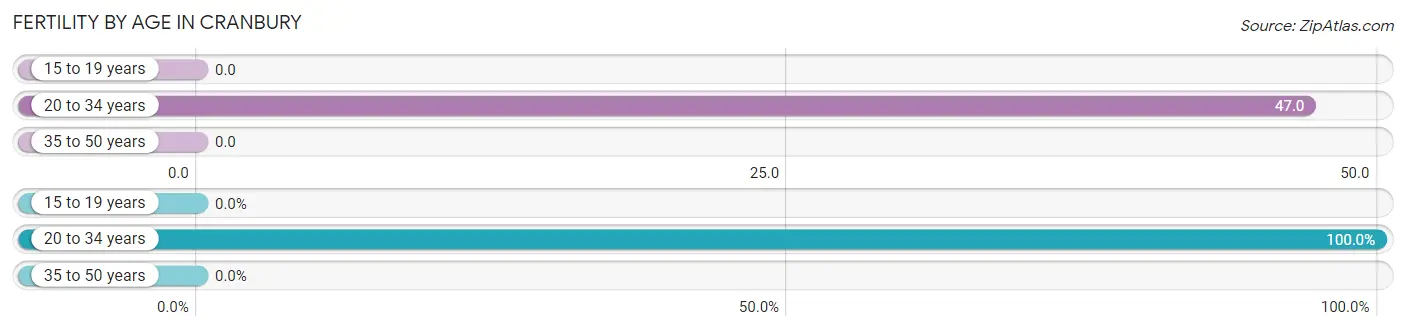
| Age Bracket | Women with Births | Births / 1,000 Women |
| 15 to 19 years | 0 (0.0%) | 0.0 |
| 20 to 34 years | 8 (100.0%) | 47.0 |
| 35 to 50 years | 0 (0.0%) | 0.0 |
| Total | 8 (100.0%) | 15.0 |
Fertility by Age by Marriage Status in Cranbury
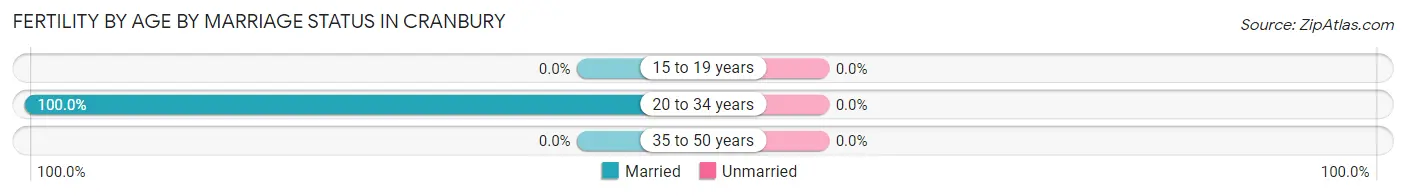
| Age Bracket | Married | Unmarried |
| 15 to 19 years | 0 (0.0%) | 0 (0.0%) |
| 20 to 34 years | 8 (100.0%) | 0 (0.0%) |
| 35 to 50 years | 0 (0.0%) | 0 (0.0%) |
| Total | 8 (100.0%) | 0 (0.0%) |
Fertility by Education in Cranbury
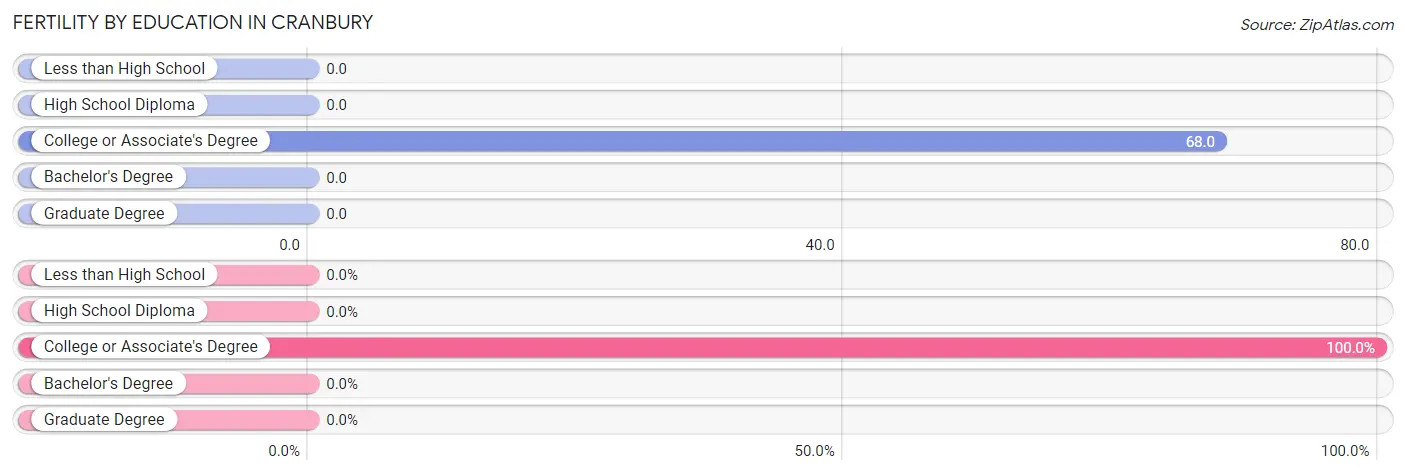
| Educational Attainment | Women with Births | Births / 1,000 Women |
| Less than High School | 0 (0.0%) | 0.0 |
| High School Diploma | 0 (0.0%) | 0.0 |
| College or Associate's Degree | 8 (100.0%) | 68.0 |
| Bachelor's Degree | 0 (0.0%) | 0.0 |
| Graduate Degree | 0 (0.0%) | 0.0 |
| Total | 8 (100.0%) | 15.0 |
Fertility by Education by Marriage Status in Cranbury
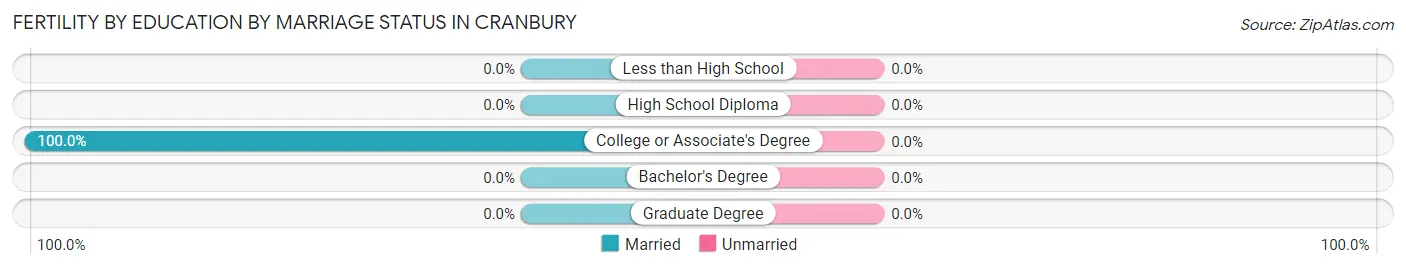
| Educational Attainment | Married | Unmarried |
| Less than High School | 0 (0.0%) | 0 (0.0%) |
| High School Diploma | 0 (0.0%) | 0 (0.0%) |
| College or Associate's Degree | 8 (100.0%) | 0 (0.0%) |
| Bachelor's Degree | 0 (0.0%) | 0 (0.0%) |
| Graduate Degree | 0 (0.0%) | 0 (0.0%) |
| Total | 8 (100.0%) | 0 (0.0%) |
Employment Characteristics in Cranbury
Employment by Class of Employer in Cranbury
Among the 1,426 employed individuals in Cranbury, private company employees (899 | 63.0%), not-for-profit organizations (135 | 9.5%), and self-employed (incorporated) (105 | 7.4%) make up the most common classes of employment.
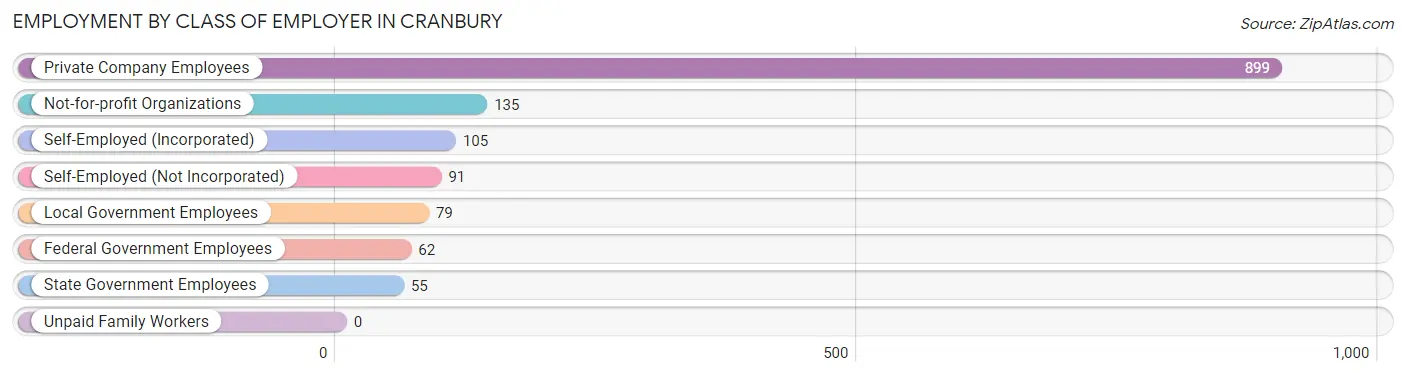
| Employer Class | # Employees | % Employees |
| Private Company Employees | 899 | 63.0% |
| Self-Employed (Incorporated) | 105 | 7.4% |
| Self-Employed (Not Incorporated) | 91 | 6.4% |
| Not-for-profit Organizations | 135 | 9.5% |
| Local Government Employees | 79 | 5.5% |
| State Government Employees | 55 | 3.9% |
| Federal Government Employees | 62 | 4.3% |
| Unpaid Family Workers | 0 | 0.0% |
| Total | 1,426 | 100.0% |
Employment Status by Age in Cranbury
According to the labor force statistics for Cranbury, out of the total population over 16 years of age (2,053), 74.5% or 1,529 individuals are in the labor force, with 4.4% or 67 of them unemployed. The age group with the highest labor force participation rate is 25 to 29 years, with 100.0% or 73 individuals in the labor force. Within the labor force, the 35 to 44 years age range has the highest percentage of unemployed individuals, with 16.5% or 45 of them being unemployed.
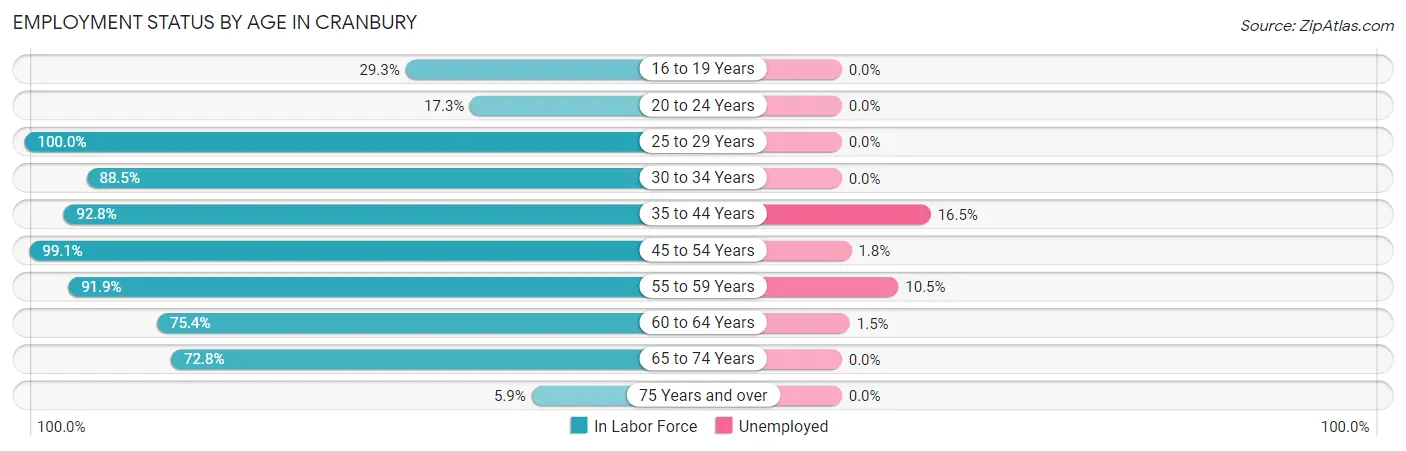
| Age Bracket | In Labor Force | Unemployed |
| 16 to 19 Years | 66 (29.3%) | 0 (0.0%) |
| 20 to 24 Years | 9 (17.3%) | 0 (0.0%) |
| 25 to 29 Years | 73 (100.0%) | 0 (0.0%) |
| 30 to 34 Years | 123 (88.5%) | 0 (0.0%) |
| 35 to 44 Years | 272 (92.8%) | 45 (16.5%) |
| 45 to 54 Years | 449 (99.1%) | 8 (1.8%) |
| 55 to 59 Years | 124 (91.9%) | 13 (10.5%) |
| 60 to 64 Years | 205 (75.4%) | 3 (1.5%) |
| 65 to 74 Years | 201 (72.8%) | 0 (0.0%) |
| 75 Years and over | 8 (5.9%) | 0 (0.0%) |
| Total | 1,529 (74.5%) | 67 (4.4%) |
Employment Status by Educational Attainment in Cranbury
According to labor force statistics for Cranbury, 91.3% of individuals (1,246) out of the total population between 25 and 64 years of age (1,365) are in the labor force, with 5.4% or 67 of them being unemployed. The group with the highest labor force participation rate are those with the educational attainment of bachelor's degree or higher, with 93.4% or 959 individuals in the labor force. Within the labor force, individuals with bachelor's degree or higher education have the highest percentage of unemployment, with 7.0% or 67 of them being unemployed.
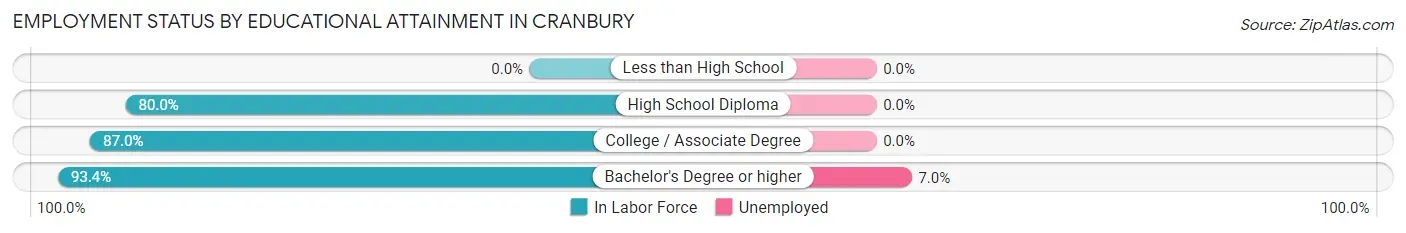
| Educational Attainment | In Labor Force | Unemployed |
| Less than High School | 0 (0.0%) | 0 (0.0%) |
| High School Diploma | 80 (80.0%) | 0 (0.0%) |
| College / Associate Degree | 207 (87.0%) | 0 (0.0%) |
| Bachelor's Degree or higher | 959 (93.4%) | 72 (7.0%) |
| Total | 1,246 (91.3%) | 74 (5.4%) |
Employment Occupations by Sex in Cranbury
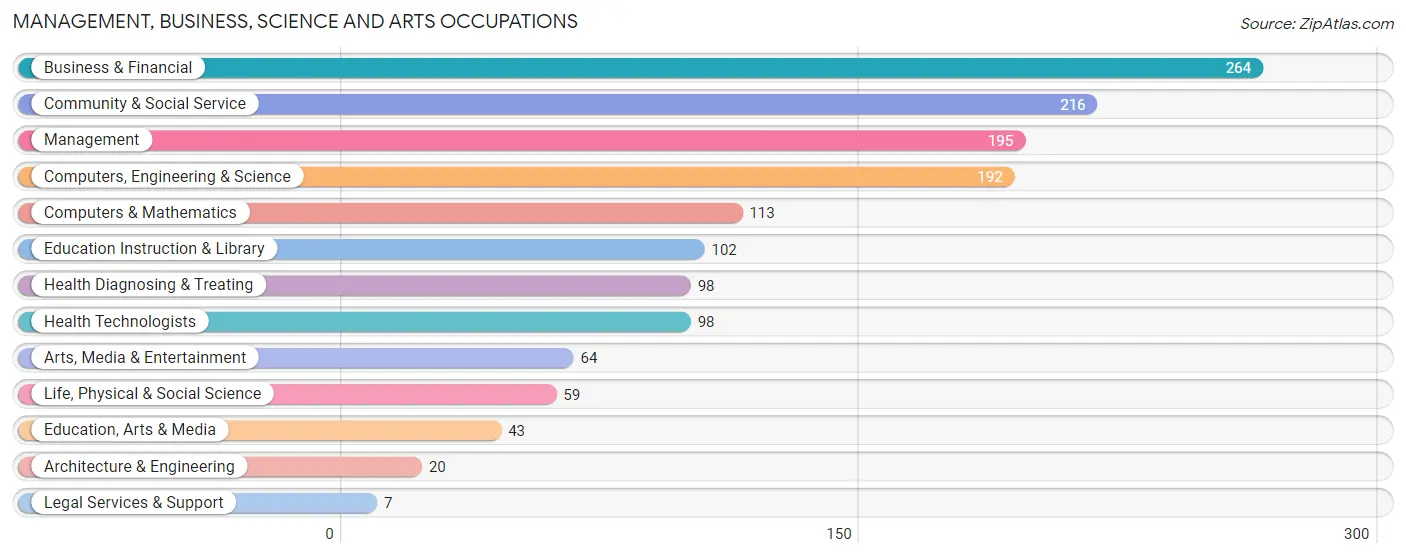
Management, Business, Science and Arts Occupations
The most common Management, Business, Science and Arts occupations in Cranbury are Business & Financial (264 | 18.2%), Community & Social Service (216 | 14.9%), Management (195 | 13.5%), Computers, Engineering & Science (192 | 13.3%), and Computers & Mathematics (113 | 7.8%).
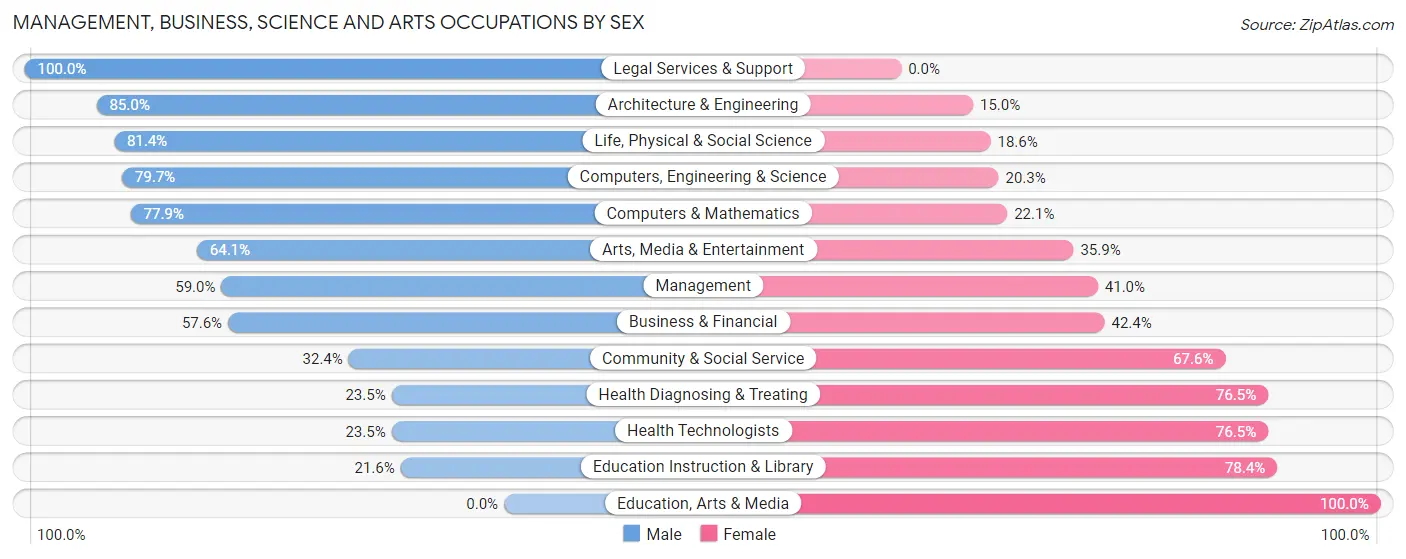
Management, Business, Science and Arts Occupations by Sex
Within the Management, Business, Science and Arts occupations in Cranbury, the most male-oriented occupations are Legal Services & Support (100.0%), Architecture & Engineering (85.0%), and Life, Physical & Social Science (81.4%), while the most female-oriented occupations are Education, Arts & Media (100.0%), Education Instruction & Library (78.4%), and Health Diagnosing & Treating (76.5%).
| Occupation | Male | Female |
| Management | 115 (59.0%) | 80 (41.0%) |
| Business & Financial | 152 (57.6%) | 112 (42.4%) |
| Computers, Engineering & Science | 153 (79.7%) | 39 (20.3%) |
| Computers & Mathematics | 88 (77.9%) | 25 (22.1%) |
| Architecture & Engineering | 17 (85.0%) | 3 (15.0%) |
| Life, Physical & Social Science | 48 (81.4%) | 11 (18.6%) |
| Community & Social Service | 70 (32.4%) | 146 (67.6%) |
| Education, Arts & Media | 0 (0.0%) | 43 (100.0%) |
| Legal Services & Support | 7 (100.0%) | 0 (0.0%) |
| Education Instruction & Library | 22 (21.6%) | 80 (78.4%) |
| Arts, Media & Entertainment | 41 (64.1%) | 23 (35.9%) |
| Health Diagnosing & Treating | 23 (23.5%) | 75 (76.5%) |
| Health Technologists | 23 (23.5%) | 75 (76.5%) |
| Total (Category) | 513 (53.2%) | 452 (46.8%) |
| Total (Overall) | 735 (50.8%) | 712 (49.2%) |
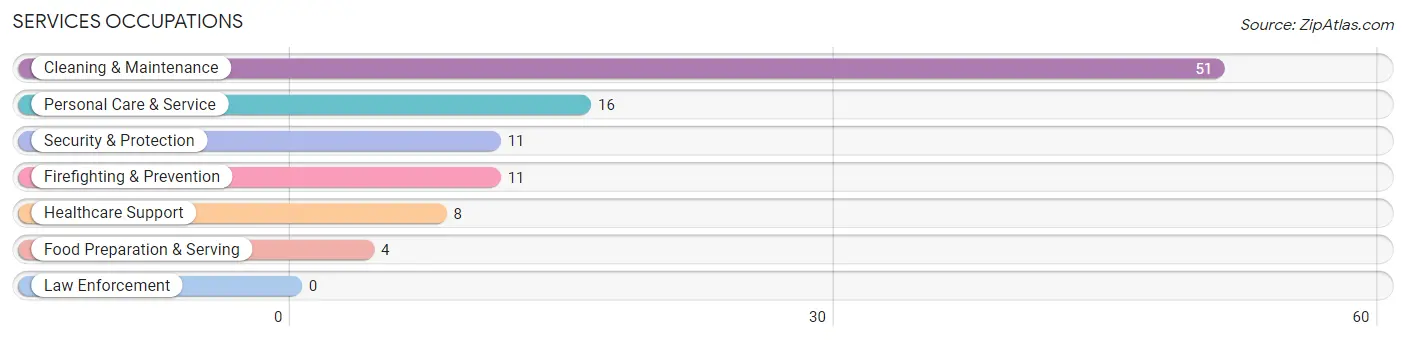
Services Occupations
The most common Services occupations in Cranbury are Cleaning & Maintenance (51 | 3.5%), Personal Care & Service (16 | 1.1%), Security & Protection (11 | 0.8%), Firefighting & Prevention (11 | 0.8%), and Healthcare Support (8 | 0.5%).
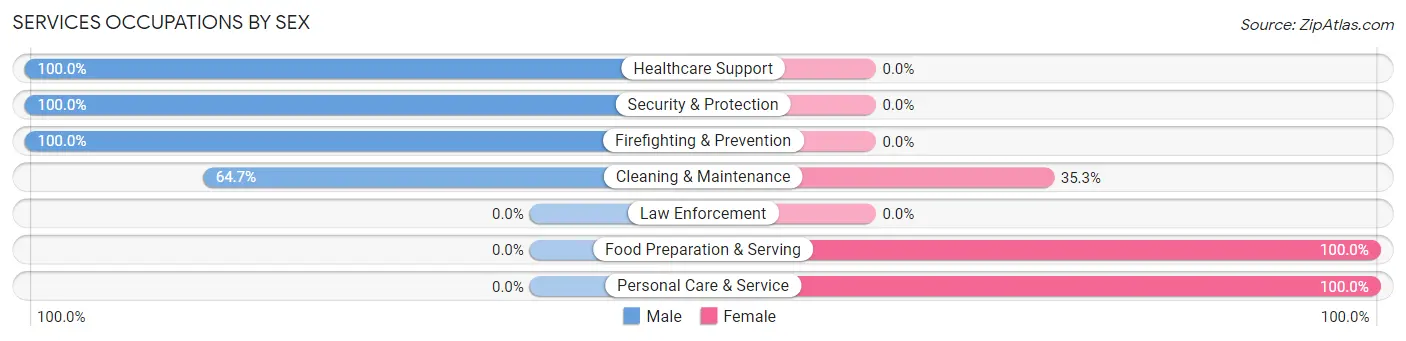
Services Occupations by Sex
Within the Services occupations in Cranbury, the most male-oriented occupations are Healthcare Support (100.0%), Security & Protection (100.0%), and Firefighting & Prevention (100.0%), while the most female-oriented occupations are Food Preparation & Serving (100.0%), Personal Care & Service (100.0%), and Cleaning & Maintenance (35.3%).
| Occupation | Male | Female |
| Healthcare Support | 8 (100.0%) | 0 (0.0%) |
| Security & Protection | 11 (100.0%) | 0 (0.0%) |
| Firefighting & Prevention | 11 (100.0%) | 0 (0.0%) |
| Law Enforcement | 0 (0.0%) | 0 (0.0%) |
| Food Preparation & Serving | 0 (0.0%) | 4 (100.0%) |
| Cleaning & Maintenance | 33 (64.7%) | 18 (35.3%) |
| Personal Care & Service | 0 (0.0%) | 16 (100.0%) |
| Total (Category) | 52 (57.8%) | 38 (42.2%) |
| Total (Overall) | 735 (50.8%) | 712 (49.2%) |
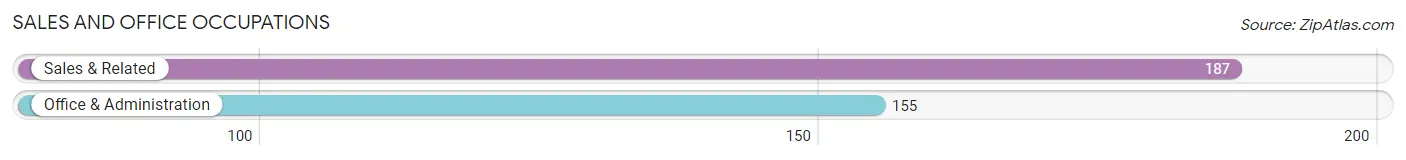
Sales and Office Occupations
The most common Sales and Office occupations in Cranbury are Sales & Related (187 | 12.9%), and Office & Administration (155 | 10.7%).
Sales and Office Occupations by Sex
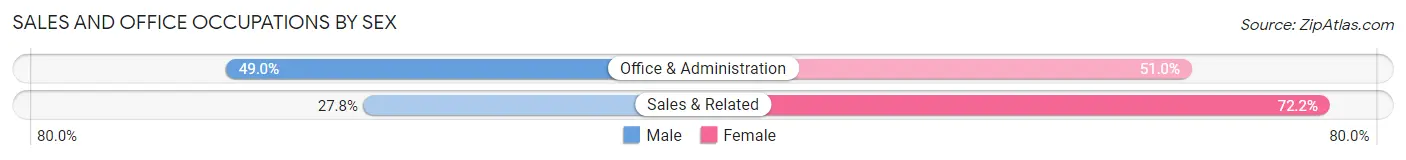
| Occupation | Male | Female |
| Sales & Related | 52 (27.8%) | 135 (72.2%) |
| Office & Administration | 76 (49.0%) | 79 (51.0%) |
| Total (Category) | 128 (37.4%) | 214 (62.6%) |
| Total (Overall) | 735 (50.8%) | 712 (49.2%) |
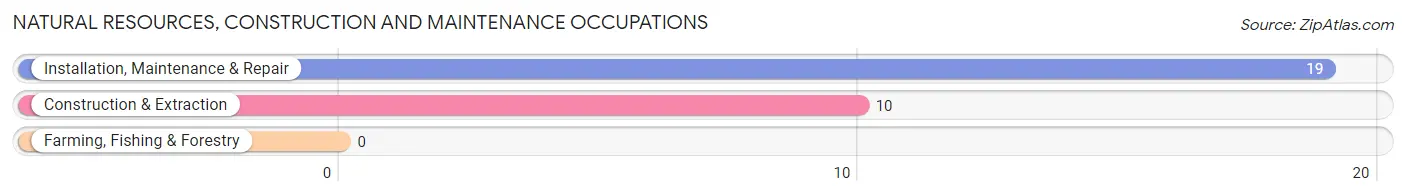
Natural Resources, Construction and Maintenance Occupations
The most common Natural Resources, Construction and Maintenance occupations in Cranbury are Installation, Maintenance & Repair (19 | 1.3%), and Construction & Extraction (10 | 0.7%).
Natural Resources, Construction and Maintenance Occupations by Sex
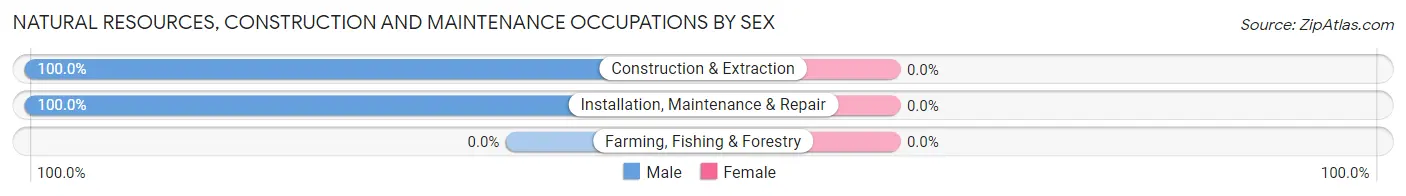
| Occupation | Male | Female |
| Farming, Fishing & Forestry | 0 (0.0%) | 0 (0.0%) |
| Construction & Extraction | 10 (100.0%) | 0 (0.0%) |
| Installation, Maintenance & Repair | 19 (100.0%) | 0 (0.0%) |
| Total (Category) | 29 (100.0%) | 0 (0.0%) |
| Total (Overall) | 735 (50.8%) | 712 (49.2%) |
Production, Transportation and Moving Occupations
The most common Production, Transportation and Moving occupations in Cranbury are Transportation (13 | 0.9%), and Material Moving (8 | 0.5%).
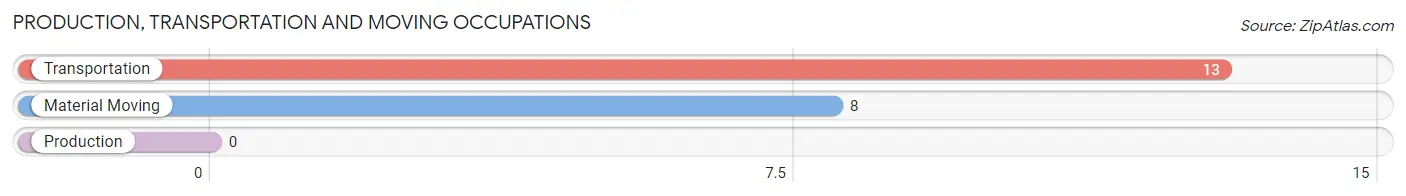
Production, Transportation and Moving Occupations by Sex
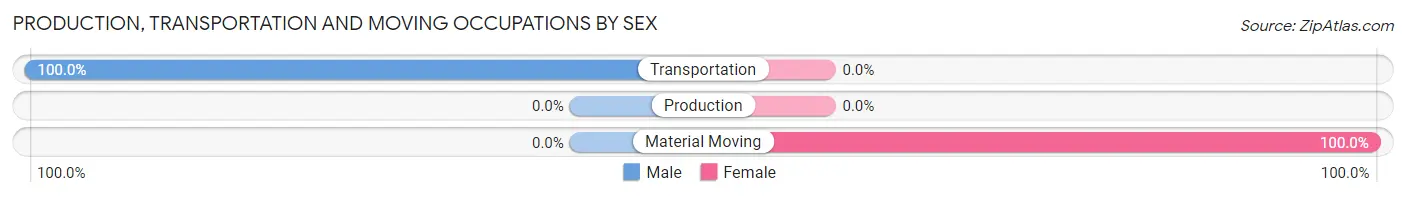
| Occupation | Male | Female |
| Production | 0 (0.0%) | 0 (0.0%) |
| Transportation | 13 (100.0%) | 0 (0.0%) |
| Material Moving | 0 (0.0%) | 8 (100.0%) |
| Total (Category) | 13 (61.9%) | 8 (38.1%) |
| Total (Overall) | 735 (50.8%) | 712 (49.2%) |
Employment Industries by Sex in Cranbury
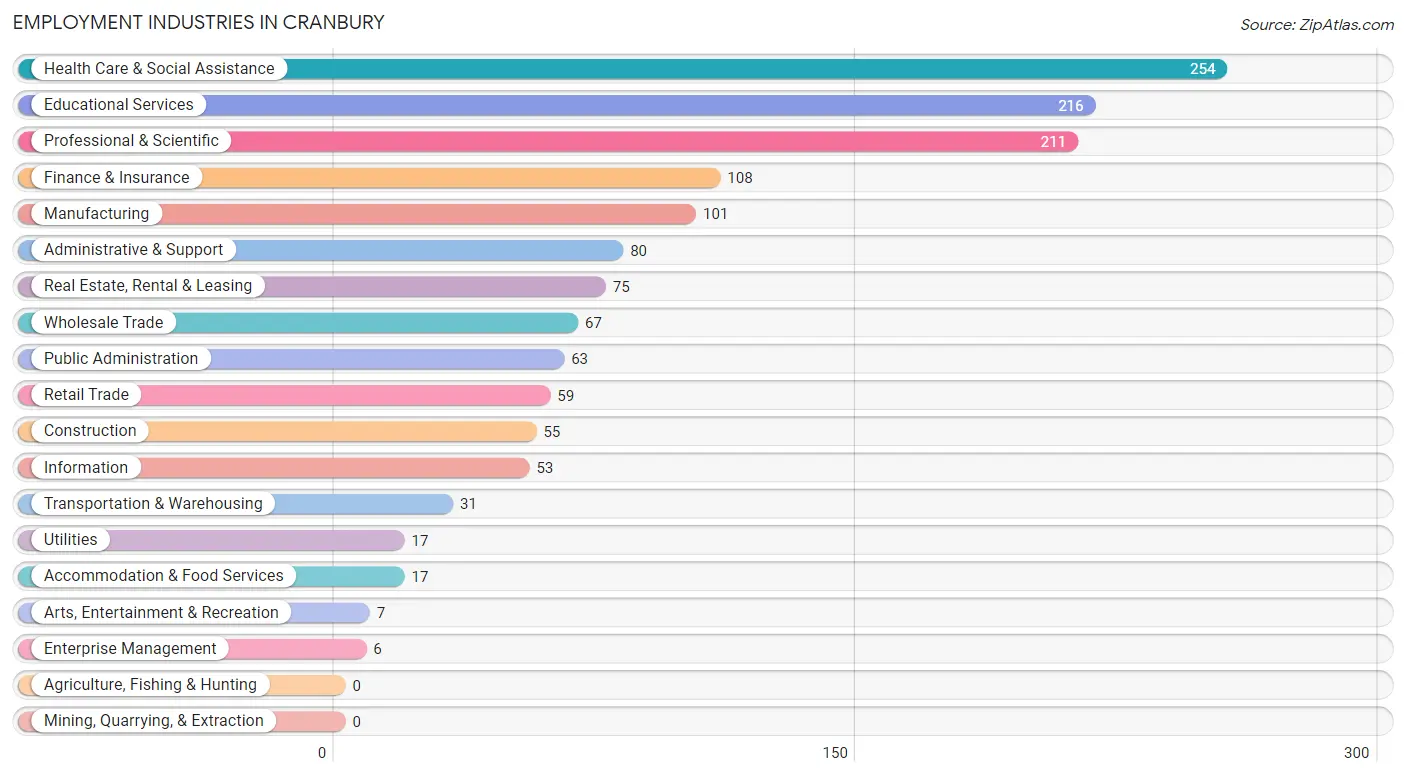
Employment Industries in Cranbury
The major employment industries in Cranbury include Health Care & Social Assistance (254 | 17.5%), Educational Services (216 | 14.9%), Professional & Scientific (211 | 14.6%), Finance & Insurance (108 | 7.5%), and Manufacturing (101 | 7.0%).
Employment Industries by Sex in Cranbury
The Cranbury industries that see more men than women are Construction (100.0%), Accommodation & Food Services (100.0%), and Administrative & Support (78.7%), whereas the industries that tend to have a higher number of women are Transportation & Warehousing (100.0%), Utilities (100.0%), and Enterprise Management (100.0%).
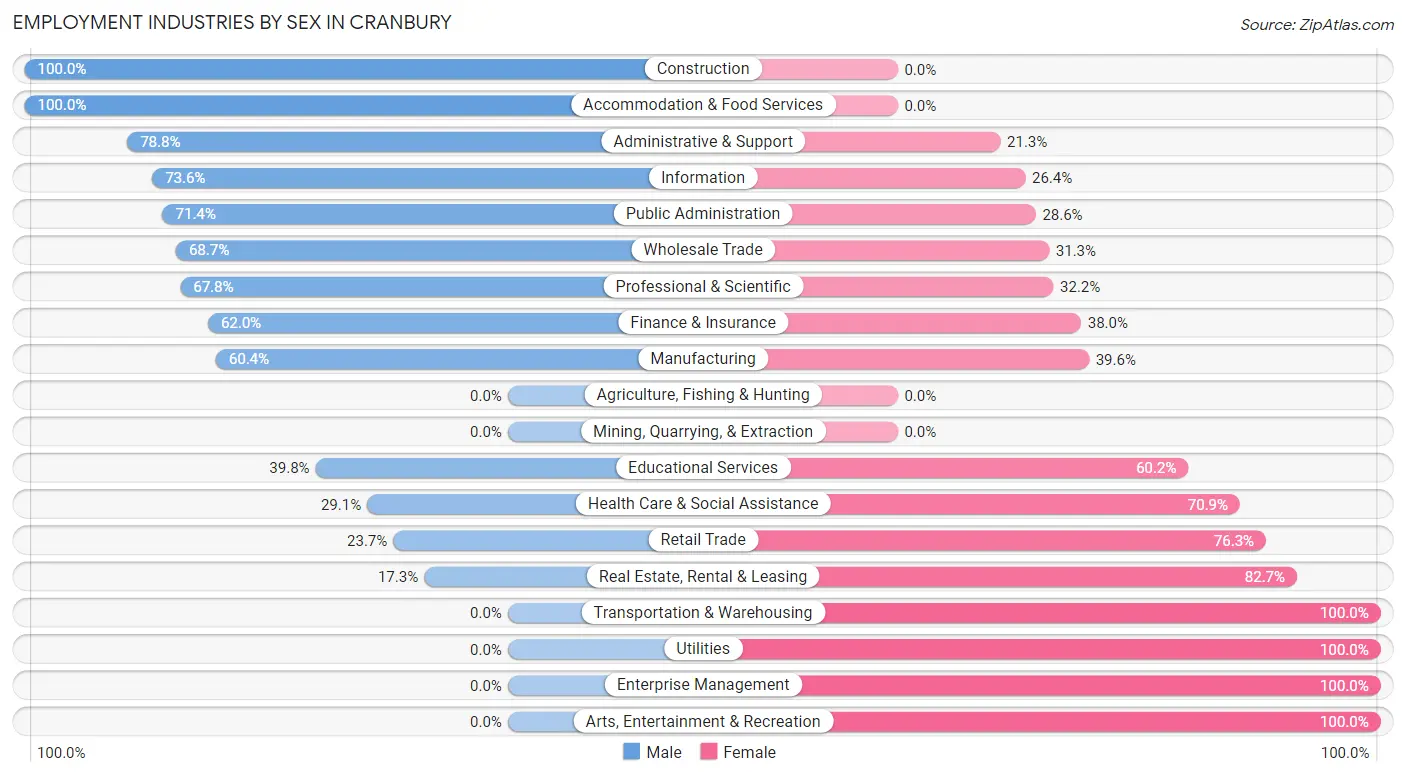
| Industry | Male | Female |
| Agriculture, Fishing & Hunting | 0 (0.0%) | 0 (0.0%) |
| Mining, Quarrying, & Extraction | 0 (0.0%) | 0 (0.0%) |
| Construction | 55 (100.0%) | 0 (0.0%) |
| Manufacturing | 61 (60.4%) | 40 (39.6%) |
| Wholesale Trade | 46 (68.7%) | 21 (31.3%) |
| Retail Trade | 14 (23.7%) | 45 (76.3%) |
| Transportation & Warehousing | 0 (0.0%) | 31 (100.0%) |
| Utilities | 0 (0.0%) | 17 (100.0%) |
| Information | 39 (73.6%) | 14 (26.4%) |
| Finance & Insurance | 67 (62.0%) | 41 (38.0%) |
| Real Estate, Rental & Leasing | 13 (17.3%) | 62 (82.7%) |
| Professional & Scientific | 143 (67.8%) | 68 (32.2%) |
| Enterprise Management | 0 (0.0%) | 6 (100.0%) |
| Administrative & Support | 63 (78.7%) | 17 (21.2%) |
| Educational Services | 86 (39.8%) | 130 (60.2%) |
| Health Care & Social Assistance | 74 (29.1%) | 180 (70.9%) |
| Arts, Entertainment & Recreation | 0 (0.0%) | 7 (100.0%) |
| Accommodation & Food Services | 17 (100.0%) | 0 (0.0%) |
| Public Administration | 45 (71.4%) | 18 (28.6%) |
| Total | 735 (50.8%) | 712 (49.2%) |
Education in Cranbury
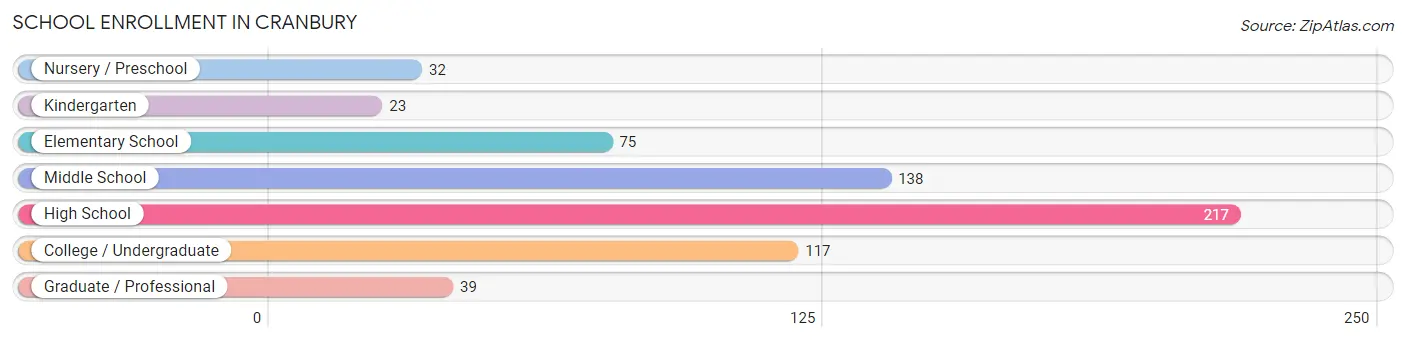
School Enrollment in Cranbury
The most common levels of schooling among the 641 students in Cranbury are high school (217 | 33.9%), middle school (138 | 21.5%), and college / undergraduate (117 | 18.2%).
| School Level | # Students | % Students |
| Nursery / Preschool | 32 | 5.0% |
| Kindergarten | 23 | 3.6% |
| Elementary School | 75 | 11.7% |
| Middle School | 138 | 21.5% |
| High School | 217 | 33.9% |
| College / Undergraduate | 117 | 18.2% |
| Graduate / Professional | 39 | 6.1% |
| Total | 641 | 100.0% |
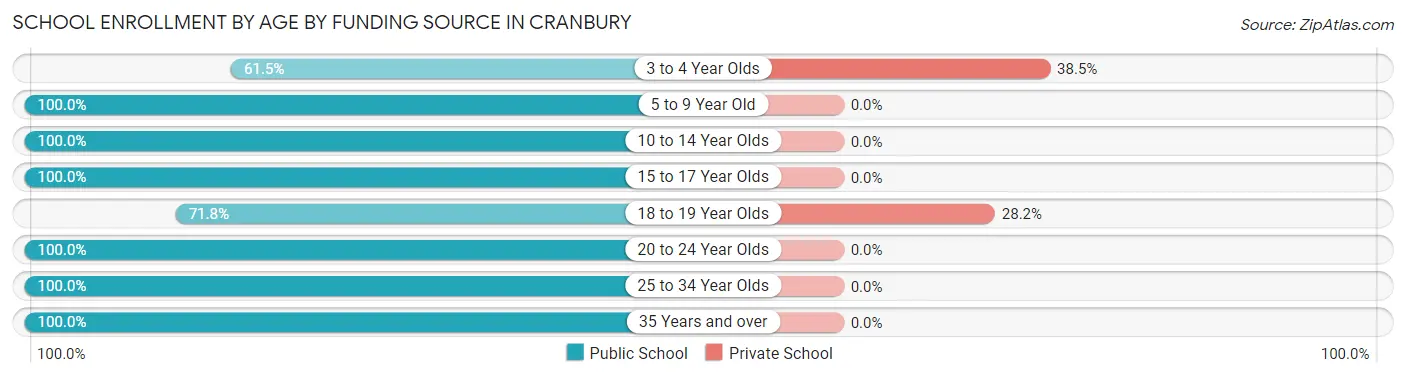
School Enrollment by Age by Funding Source in Cranbury
Out of a total of 641 students who are enrolled in schools in Cranbury, 39 (6.1%) attend a private institution, while the remaining 602 (93.9%) are enrolled in public schools. The age group of 3 to 4 year olds has the highest likelihood of being enrolled in private schools, with 10 (38.5% in the age bracket) enrolled. Conversely, the age group of 5 to 9 year old has the lowest likelihood of being enrolled in a private school, with 86 (100.0% in the age bracket) attending a public institution.
| Age Bracket | Public School | Private School |
| 3 to 4 Year Olds | 16 (61.5%) | 10 (38.5%) |
| 5 to 9 Year Old | 86 (100.0%) | 0 (0.0%) |
| 10 to 14 Year Olds | 197 (100.0%) | 0 (0.0%) |
| 15 to 17 Year Olds | 110 (100.0%) | 0 (0.0%) |
| 18 to 19 Year Olds | 74 (71.8%) | 29 (28.2%) |
| 20 to 24 Year Olds | 52 (100.0%) | 0 (0.0%) |
| 25 to 34 Year Olds | 28 (100.0%) | 0 (0.0%) |
| 35 Years and over | 39 (100.0%) | 0 (0.0%) |
| Total | 602 (93.9%) | 39 (6.1%) |
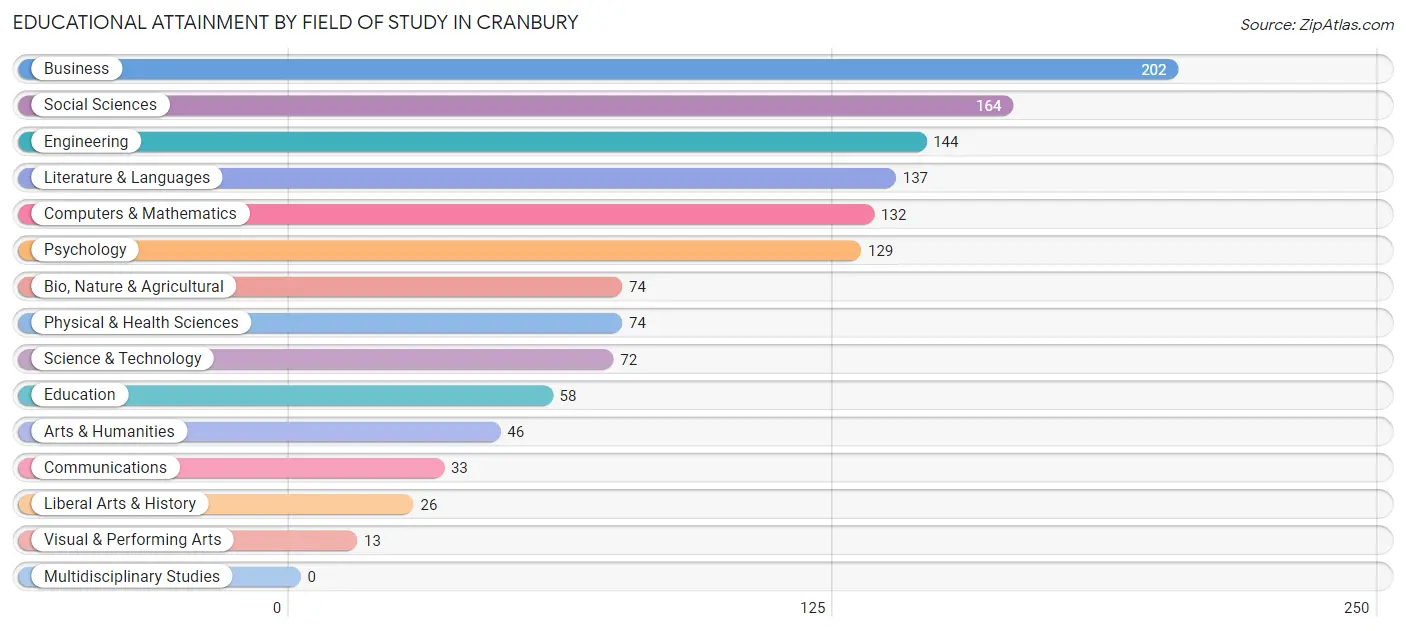
Educational Attainment by Field of Study in Cranbury
Business (202 | 15.5%), social sciences (164 | 12.6%), engineering (144 | 11.0%), literature & languages (137 | 10.5%), and computers & mathematics (132 | 10.1%) are the most common fields of study among 1,304 individuals in Cranbury who have obtained a bachelor's degree or higher.
| Field of Study | # Graduates | % Graduates |
| Computers & Mathematics | 132 | 10.1% |
| Bio, Nature & Agricultural | 74 | 5.7% |
| Physical & Health Sciences | 74 | 5.7% |
| Psychology | 129 | 9.9% |
| Social Sciences | 164 | 12.6% |
| Engineering | 144 | 11.0% |
| Multidisciplinary Studies | 0 | 0.0% |
| Science & Technology | 72 | 5.5% |
| Business | 202 | 15.5% |
| Education | 58 | 4.4% |
| Literature & Languages | 137 | 10.5% |
| Liberal Arts & History | 26 | 2.0% |
| Visual & Performing Arts | 13 | 1.0% |
| Communications | 33 | 2.5% |
| Arts & Humanities | 46 | 3.5% |
| Total | 1,304 | 100.0% |
Transportation & Commute in Cranbury
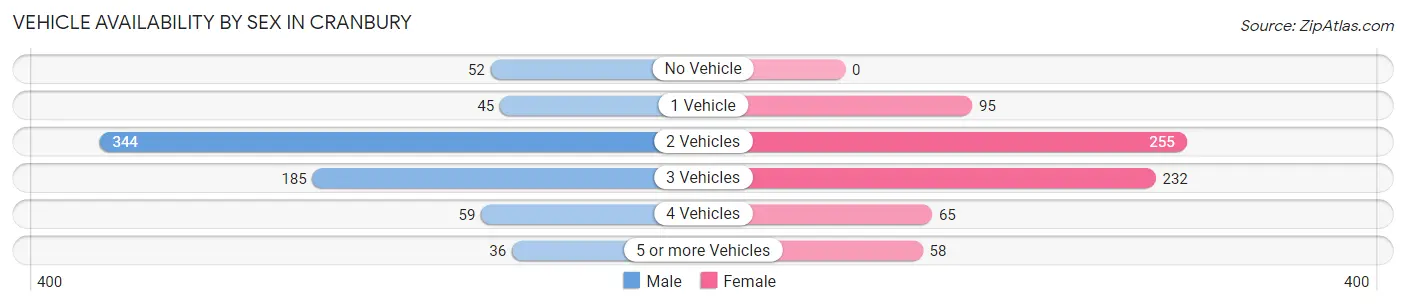
Vehicle Availability by Sex in Cranbury
The most prevalent vehicle ownership categories in Cranbury are males with 2 vehicles (344, accounting for 47.7%) and females with 2 vehicles (255, making up 48.8%).
| Vehicles Available | Male | Female |
| No Vehicle | 52 (7.2%) | 0 (0.0%) |
| 1 Vehicle | 45 (6.2%) | 95 (13.5%) |
| 2 Vehicles | 344 (47.7%) | 255 (36.2%) |
| 3 Vehicles | 185 (25.7%) | 232 (32.9%) |
| 4 Vehicles | 59 (8.2%) | 65 (9.2%) |
| 5 or more Vehicles | 36 (5.0%) | 58 (8.2%) |
| Total | 721 (100.0%) | 705 (100.0%) |
Commute Time in Cranbury
The most frequently occuring commute durations in Cranbury are 15 to 19 minutes (219 commuters, 21.5%), 20 to 24 minutes (201 commuters, 19.7%), and 30 to 34 minutes (139 commuters, 13.7%).
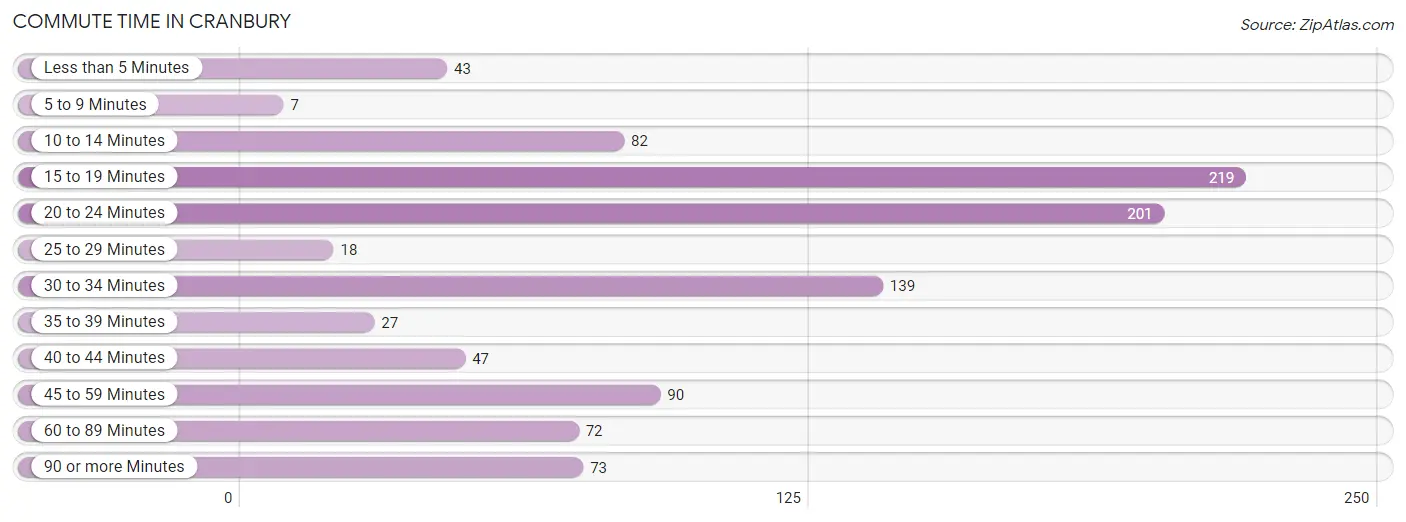
| Commute Time | # Commuters | % Commuters |
| Less than 5 Minutes | 43 | 4.2% |
| 5 to 9 Minutes | 7 | 0.7% |
| 10 to 14 Minutes | 82 | 8.1% |
| 15 to 19 Minutes | 219 | 21.5% |
| 20 to 24 Minutes | 201 | 19.7% |
| 25 to 29 Minutes | 18 | 1.8% |
| 30 to 34 Minutes | 139 | 13.7% |
| 35 to 39 Minutes | 27 | 2.6% |
| 40 to 44 Minutes | 47 | 4.6% |
| 45 to 59 Minutes | 90 | 8.8% |
| 60 to 89 Minutes | 72 | 7.1% |
| 90 or more Minutes | 73 | 7.2% |
Commute Time by Sex in Cranbury
The most common commute times in Cranbury are 30 to 34 minutes (98 commuters, 19.2%) for males and 15 to 19 minutes (157 commuters, 31.0%) for females.
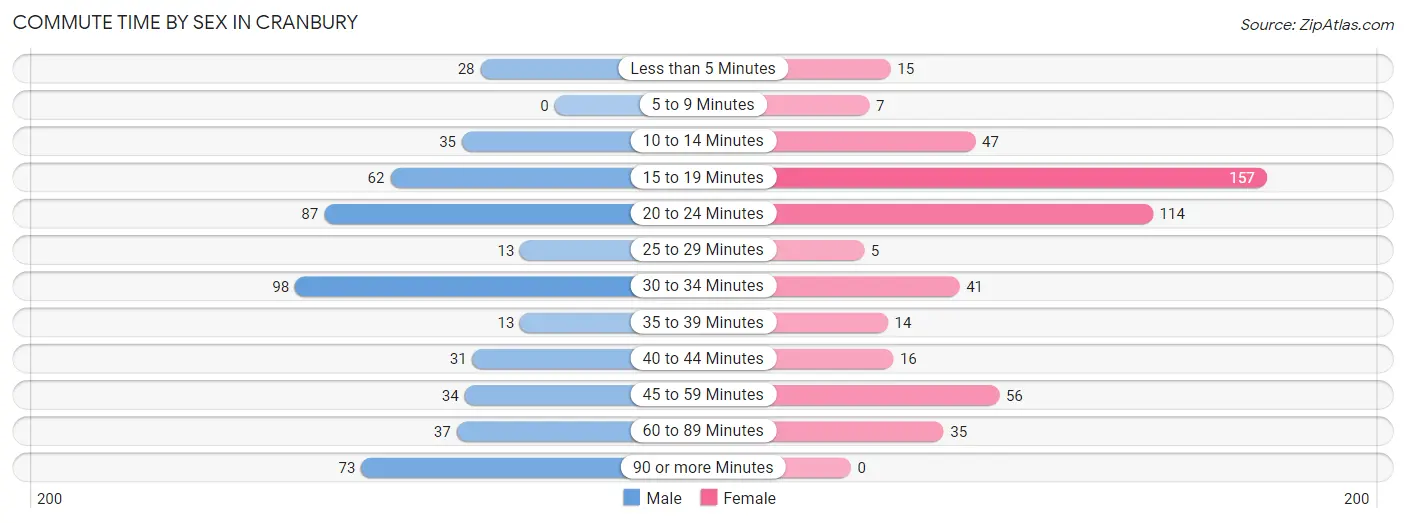
| Commute Time | Male | Female |
| Less than 5 Minutes | 28 (5.5%) | 15 (3.0%) |
| 5 to 9 Minutes | 0 (0.0%) | 7 (1.4%) |
| 10 to 14 Minutes | 35 (6.9%) | 47 (9.3%) |
| 15 to 19 Minutes | 62 (12.1%) | 157 (31.0%) |
| 20 to 24 Minutes | 87 (17.0%) | 114 (22.5%) |
| 25 to 29 Minutes | 13 (2.5%) | 5 (1.0%) |
| 30 to 34 Minutes | 98 (19.2%) | 41 (8.1%) |
| 35 to 39 Minutes | 13 (2.5%) | 14 (2.8%) |
| 40 to 44 Minutes | 31 (6.1%) | 16 (3.2%) |
| 45 to 59 Minutes | 34 (6.7%) | 56 (11.1%) |
| 60 to 89 Minutes | 37 (7.2%) | 35 (6.9%) |
| 90 or more Minutes | 73 (14.3%) | 0 (0.0%) |
Time of Departure to Work by Sex in Cranbury
The most frequent times of departure to work in Cranbury are 7:00 AM to 7:29 AM (164, 32.1%) for males and 8:00 AM to 8:29 AM (177, 34.9%) for females.
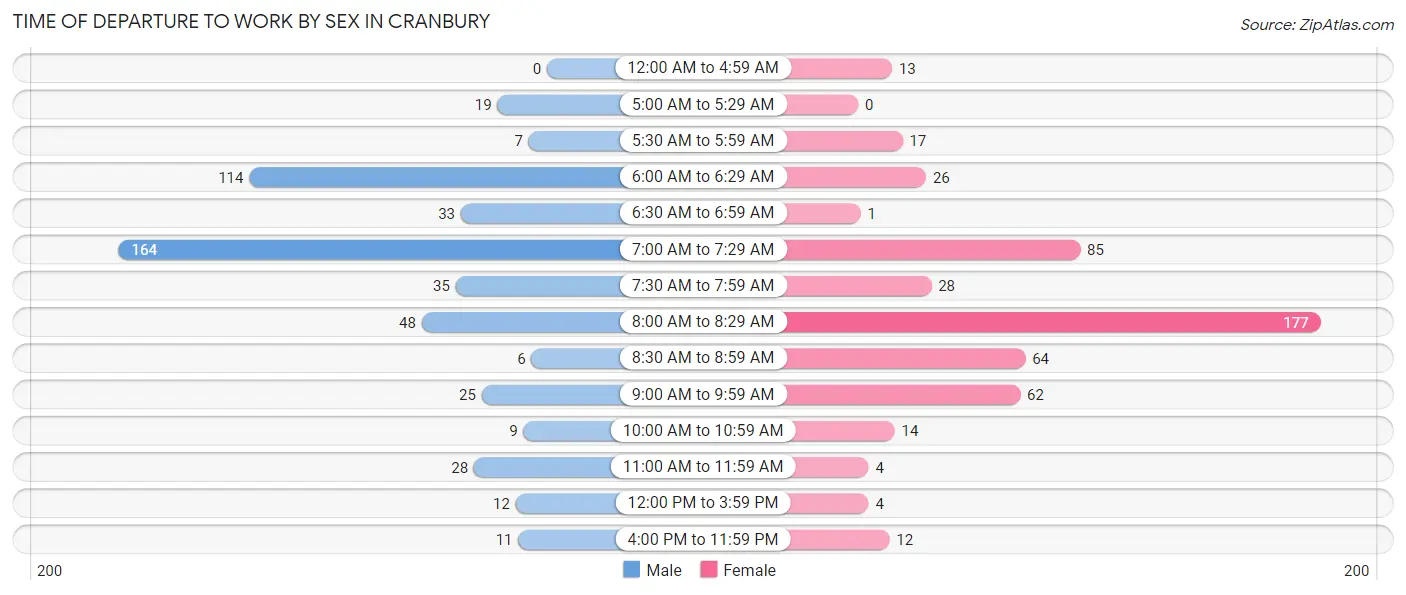
| Time of Departure | Male | Female |
| 12:00 AM to 4:59 AM | 0 (0.0%) | 13 (2.6%) |
| 5:00 AM to 5:29 AM | 19 (3.7%) | 0 (0.0%) |
| 5:30 AM to 5:59 AM | 7 (1.4%) | 17 (3.4%) |
| 6:00 AM to 6:29 AM | 114 (22.3%) | 26 (5.1%) |
| 6:30 AM to 6:59 AM | 33 (6.5%) | 1 (0.2%) |
| 7:00 AM to 7:29 AM | 164 (32.1%) | 85 (16.8%) |
| 7:30 AM to 7:59 AM | 35 (6.9%) | 28 (5.5%) |
| 8:00 AM to 8:29 AM | 48 (9.4%) | 177 (34.9%) |
| 8:30 AM to 8:59 AM | 6 (1.2%) | 64 (12.6%) |
| 9:00 AM to 9:59 AM | 25 (4.9%) | 62 (12.2%) |
| 10:00 AM to 10:59 AM | 9 (1.8%) | 14 (2.8%) |
| 11:00 AM to 11:59 AM | 28 (5.5%) | 4 (0.8%) |
| 12:00 PM to 3:59 PM | 12 (2.4%) | 4 (0.8%) |
| 4:00 PM to 11:59 PM | 11 (2.1%) | 12 (2.4%) |
| Total | 511 (100.0%) | 507 (100.0%) |
Housing Occupancy in Cranbury
Occupancy by Ownership in Cranbury
Of the total 835 dwellings in Cranbury, owner-occupied units account for 724 (86.7%), while renter-occupied units make up 111 (13.3%).
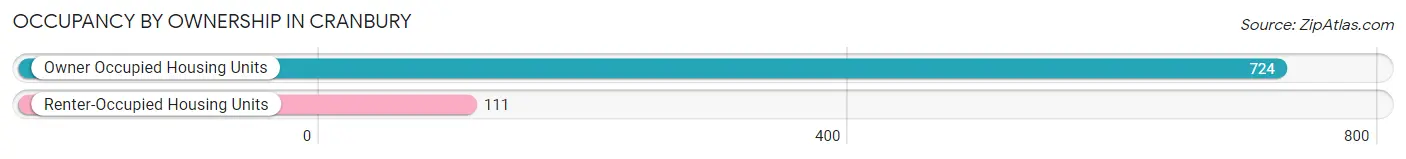
| Occupancy | # Housing Units | % Housing Units |
| Owner Occupied Housing Units | 724 | 86.7% |
| Renter-Occupied Housing Units | 111 | 13.3% |
| Total Occupied Housing Units | 835 | 100.0% |
Occupancy by Household Size in Cranbury
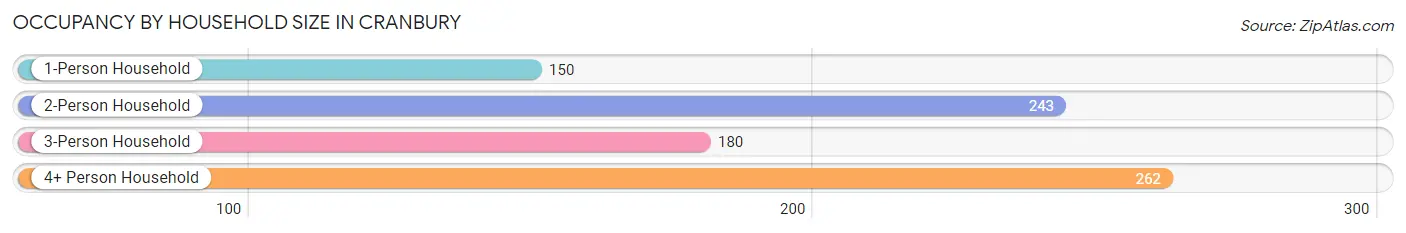
| Household Size | # Housing Units | % Housing Units |
| 1-Person Household | 150 | 18.0% |
| 2-Person Household | 243 | 29.1% |
| 3-Person Household | 180 | 21.6% |
| 4+ Person Household | 262 | 31.4% |
| Total Housing Units | 835 | 100.0% |
Occupancy by Ownership by Household Size in Cranbury
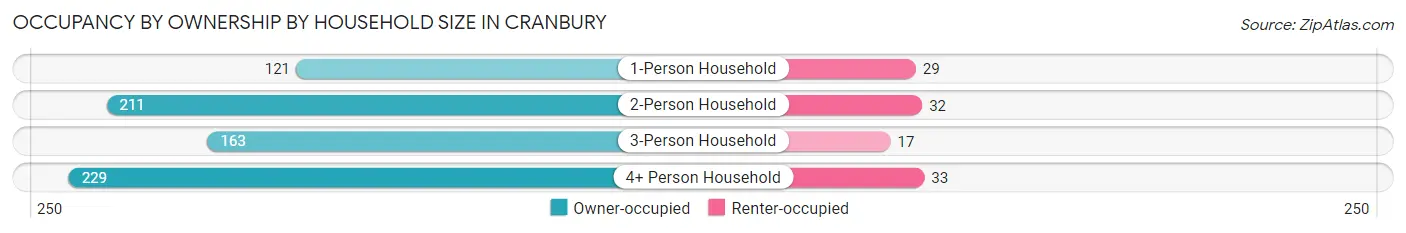
| Household Size | Owner-occupied | Renter-occupied |
| 1-Person Household | 121 (80.7%) | 29 (19.3%) |
| 2-Person Household | 211 (86.8%) | 32 (13.2%) |
| 3-Person Household | 163 (90.6%) | 17 (9.4%) |
| 4+ Person Household | 229 (87.4%) | 33 (12.6%) |
| Total Housing Units | 724 (86.7%) | 111 (13.3%) |
Occupancy by Educational Attainment in Cranbury
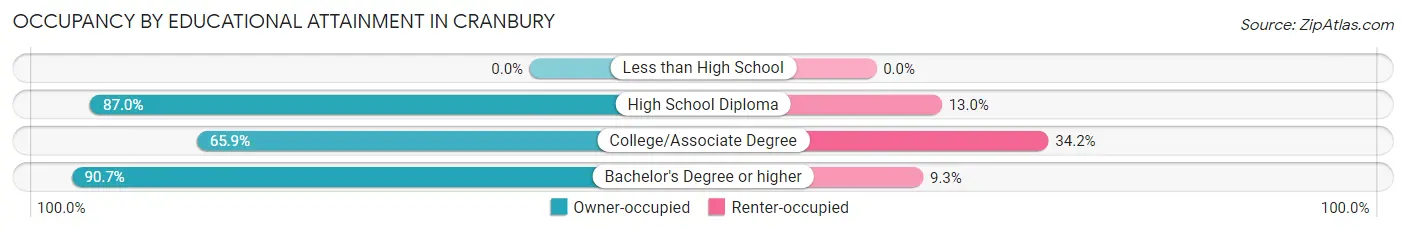
| Household Size | Owner-occupied | Renter-occupied |
| Less than High School | 0 (0.0%) | 0 (0.0%) |
| High School Diploma | 67 (87.0%) | 10 (13.0%) |
| College/Associate Degree | 81 (65.8%) | 42 (34.2%) |
| Bachelor's Degree or higher | 576 (90.7%) | 59 (9.3%) |
Occupancy by Age of Householder in Cranbury
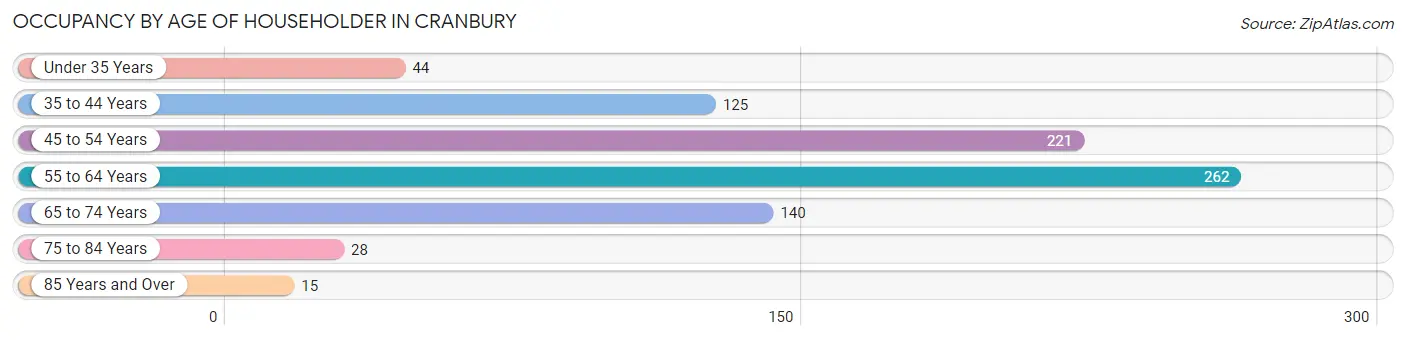
| Age Bracket | # Households | % Households |
| Under 35 Years | 44 | 5.3% |
| 35 to 44 Years | 125 | 15.0% |
| 45 to 54 Years | 221 | 26.5% |
| 55 to 64 Years | 262 | 31.4% |
| 65 to 74 Years | 140 | 16.8% |
| 75 to 84 Years | 28 | 3.4% |
| 85 Years and Over | 15 | 1.8% |
| Total | 835 | 100.0% |
Housing Finances in Cranbury
Median Income by Occupancy in Cranbury
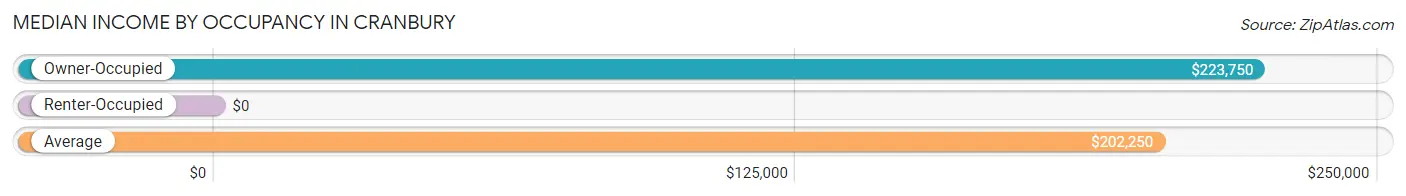
| Occupancy Type | # Households | Median Income |
| Owner-Occupied | 724 (86.7%) | $223,750 |
| Renter-Occupied | 111 (13.3%) | $0 |
| Average | 835 (100.0%) | $202,250 |
Occupancy by Householder Income Bracket in Cranbury
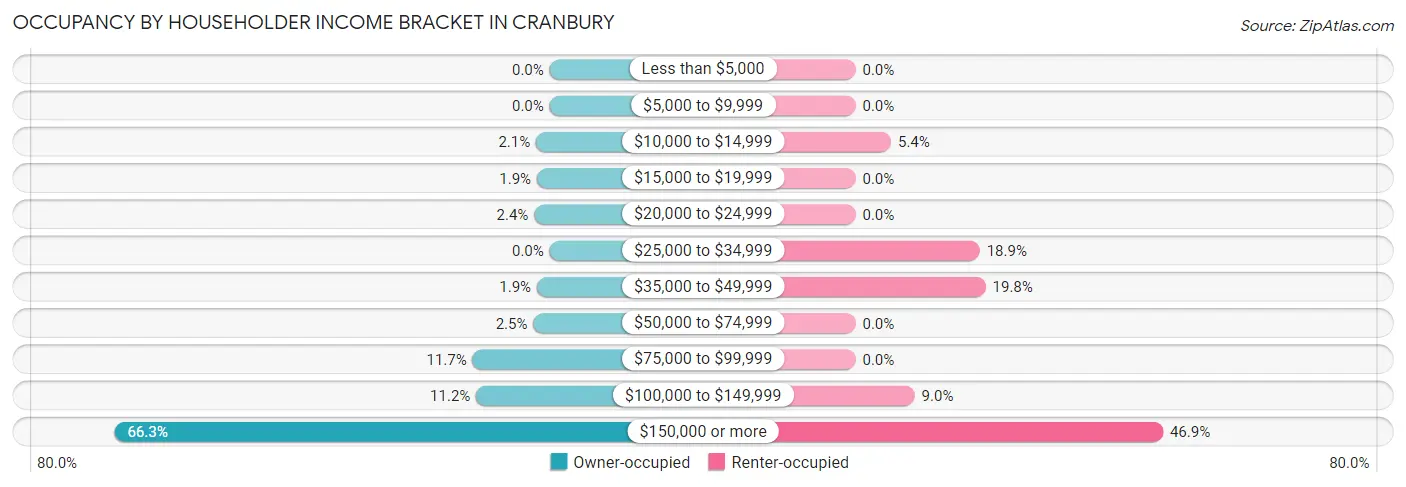
| Income Bracket | Owner-occupied | Renter-occupied |
| Less than $5,000 | 0 (0.0%) | 0 (0.0%) |
| $5,000 to $9,999 | 0 (0.0%) | 0 (0.0%) |
| $10,000 to $14,999 | 15 (2.1%) | 6 (5.4%) |
| $15,000 to $19,999 | 14 (1.9%) | 0 (0.0%) |
| $20,000 to $24,999 | 17 (2.4%) | 0 (0.0%) |
| $25,000 to $34,999 | 0 (0.0%) | 21 (18.9%) |
| $35,000 to $49,999 | 14 (1.9%) | 22 (19.8%) |
| $50,000 to $74,999 | 18 (2.5%) | 0 (0.0%) |
| $75,000 to $99,999 | 85 (11.7%) | 0 (0.0%) |
| $100,000 to $149,999 | 81 (11.2%) | 10 (9.0%) |
| $150,000 or more | 480 (66.3%) | 52 (46.9%) |
| Total | 724 (100.0%) | 111 (100.0%) |
Monthly Housing Cost Tiers in Cranbury
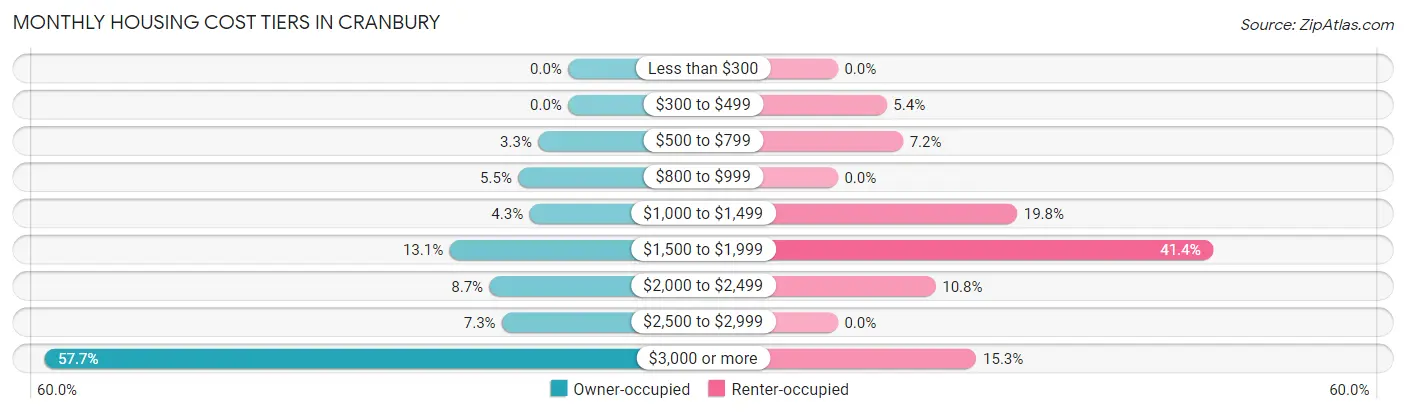
| Monthly Cost | Owner-occupied | Renter-occupied |
| Less than $300 | 0 (0.0%) | 0 (0.0%) |
| $300 to $499 | 0 (0.0%) | 6 (5.4%) |
| $500 to $799 | 24 (3.3%) | 8 (7.2%) |
| $800 to $999 | 40 (5.5%) | 0 (0.0%) |
| $1,000 to $1,499 | 31 (4.3%) | 22 (19.8%) |
| $1,500 to $1,999 | 95 (13.1%) | 46 (41.4%) |
| $2,000 to $2,499 | 63 (8.7%) | 12 (10.8%) |
| $2,500 to $2,999 | 53 (7.3%) | 0 (0.0%) |
| $3,000 or more | 418 (57.7%) | 17 (15.3%) |
| Total | 724 (100.0%) | 111 (100.0%) |
Physical Housing Characteristics in Cranbury
Housing Structures in Cranbury
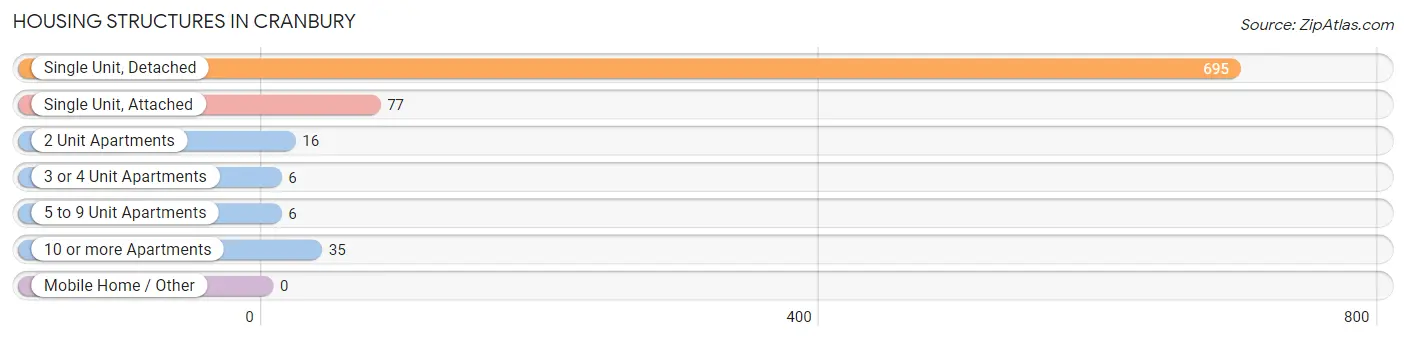
| Structure Type | # Housing Units | % Housing Units |
| Single Unit, Detached | 695 | 83.2% |
| Single Unit, Attached | 77 | 9.2% |
| 2 Unit Apartments | 16 | 1.9% |
| 3 or 4 Unit Apartments | 6 | 0.7% |
| 5 to 9 Unit Apartments | 6 | 0.7% |
| 10 or more Apartments | 35 | 4.2% |
| Mobile Home / Other | 0 | 0.0% |
| Total | 835 | 100.0% |
Housing Structures by Occupancy in Cranbury
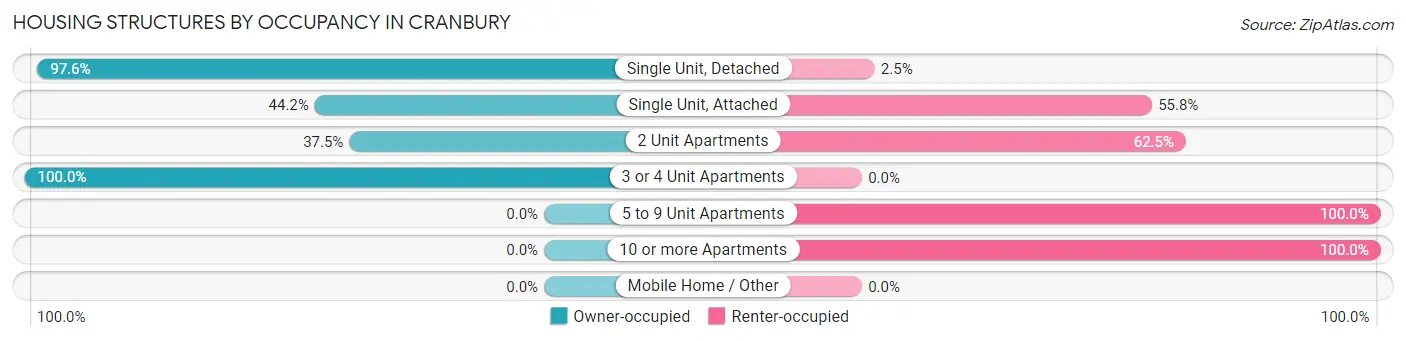
| Structure Type | Owner-occupied | Renter-occupied |
| Single Unit, Detached | 678 (97.6%) | 17 (2.5%) |
| Single Unit, Attached | 34 (44.2%) | 43 (55.8%) |
| 2 Unit Apartments | 6 (37.5%) | 10 (62.5%) |
| 3 or 4 Unit Apartments | 6 (100.0%) | 0 (0.0%) |
| 5 to 9 Unit Apartments | 0 (0.0%) | 6 (100.0%) |
| 10 or more Apartments | 0 (0.0%) | 35 (100.0%) |
| Mobile Home / Other | 0 (0.0%) | 0 (0.0%) |
| Total | 724 (86.7%) | 111 (13.3%) |
Housing Structures by Number of Rooms in Cranbury
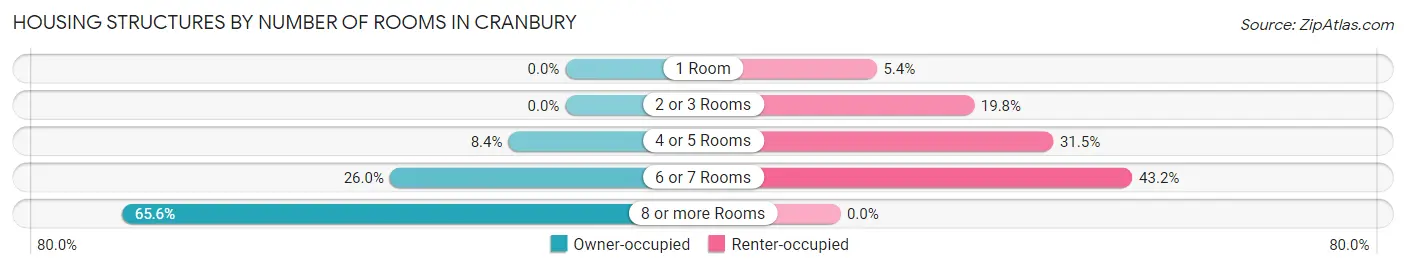
| Number of Rooms | Owner-occupied | Renter-occupied |
| 1 Room | 0 (0.0%) | 6 (5.4%) |
| 2 or 3 Rooms | 0 (0.0%) | 22 (19.8%) |
| 4 or 5 Rooms | 61 (8.4%) | 35 (31.5%) |
| 6 or 7 Rooms | 188 (26.0%) | 48 (43.2%) |
| 8 or more Rooms | 475 (65.6%) | 0 (0.0%) |
| Total | 724 (100.0%) | 111 (100.0%) |
Housing Structure by Heating Type in Cranbury
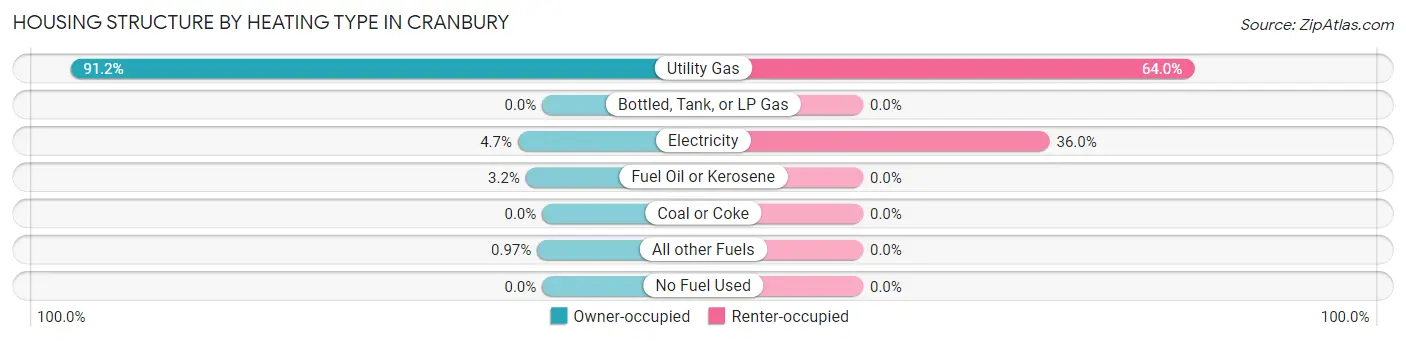
| Heating Type | Owner-occupied | Renter-occupied |
| Utility Gas | 660 (91.2%) | 71 (64.0%) |
| Bottled, Tank, or LP Gas | 0 (0.0%) | 0 (0.0%) |
| Electricity | 34 (4.7%) | 40 (36.0%) |
| Fuel Oil or Kerosene | 23 (3.2%) | 0 (0.0%) |
| Coal or Coke | 0 (0.0%) | 0 (0.0%) |
| All other Fuels | 7 (1.0%) | 0 (0.0%) |
| No Fuel Used | 0 (0.0%) | 0 (0.0%) |
| Total | 724 (100.0%) | 111 (100.0%) |
Household Vehicle Usage in Cranbury
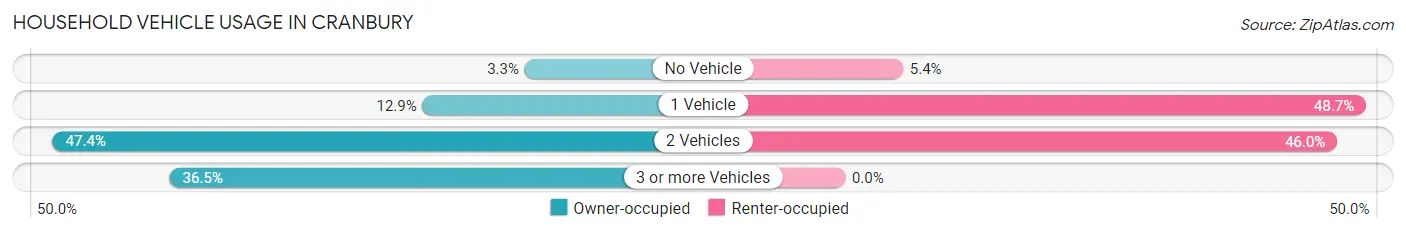
| Vehicles per Household | Owner-occupied | Renter-occupied |
| No Vehicle | 24 (3.3%) | 6 (5.4%) |
| 1 Vehicle | 93 (12.9%) | 54 (48.6%) |
| 2 Vehicles | 343 (47.4%) | 51 (46.0%) |
| 3 or more Vehicles | 264 (36.5%) | 0 (0.0%) |
| Total | 724 (100.0%) | 111 (100.0%) |
Real Estate & Mortgages in Cranbury
Real Estate and Mortgage Overview in Cranbury
| Characteristic | Without Mortgage | With Mortgage |
| Housing Units | 232 | 492 |
| Median Property Value | $649,000 | $798,000 |
| Median Household Income | - | - |
| Monthly Housing Costs | $1,501 | $418 |
| Real Estate Taxes | $10,001 | $0 |
Property Value by Mortgage Status in Cranbury
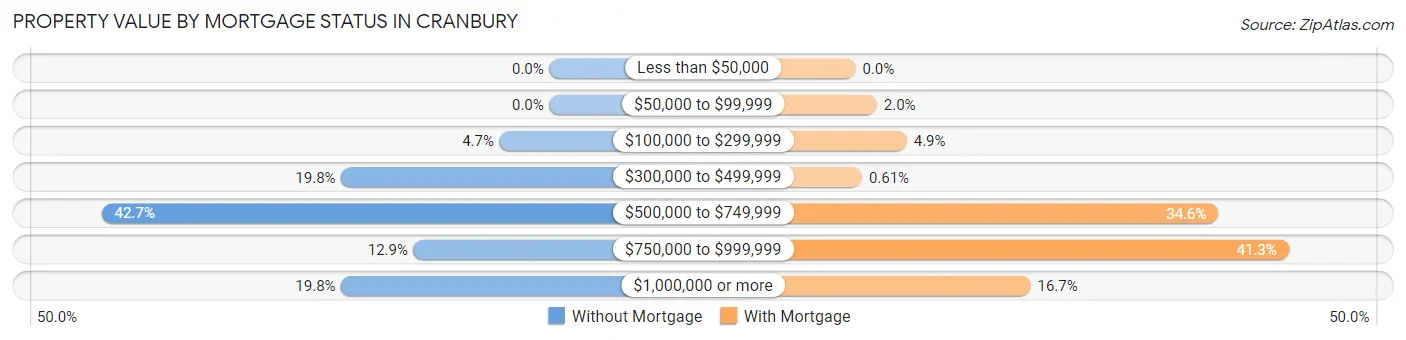
| Property Value | Without Mortgage | With Mortgage |
| Less than $50,000 | 0 (0.0%) | 0 (0.0%) |
| $50,000 to $99,999 | 0 (0.0%) | 10 (2.0%) |
| $100,000 to $299,999 | 11 (4.7%) | 24 (4.9%) |
| $300,000 to $499,999 | 46 (19.8%) | 3 (0.6%) |
| $500,000 to $749,999 | 99 (42.7%) | 170 (34.5%) |
| $750,000 to $999,999 | 30 (12.9%) | 203 (41.3%) |
| $1,000,000 or more | 46 (19.8%) | 82 (16.7%) |
| Total | 232 (100.0%) | 492 (100.0%) |
Household Income by Mortgage Status in Cranbury
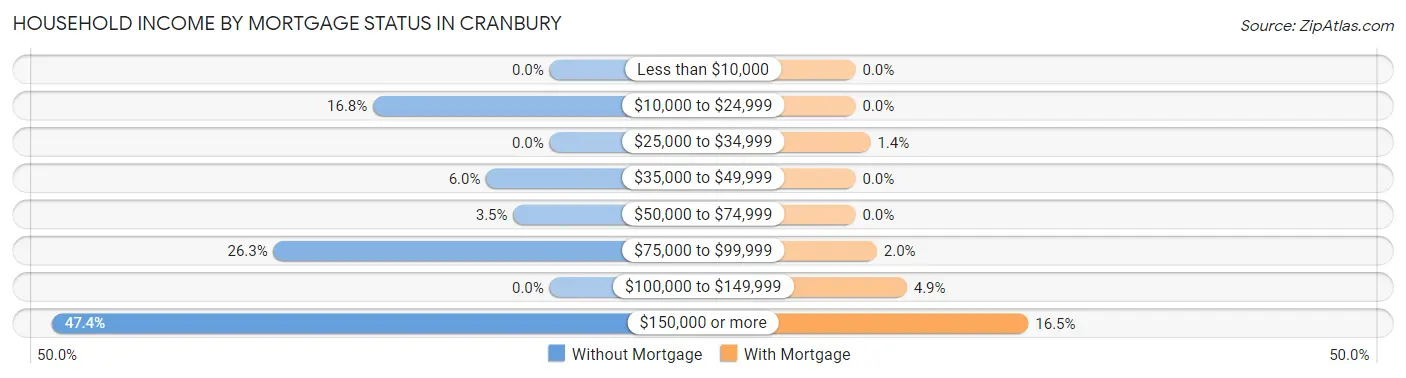
| Household Income | Without Mortgage | With Mortgage |
| Less than $10,000 | 0 (0.0%) | 0 (0.0%) |
| $10,000 to $24,999 | 39 (16.8%) | 0 (0.0%) |
| $25,000 to $34,999 | 0 (0.0%) | 7 (1.4%) |
| $35,000 to $49,999 | 14 (6.0%) | 0 (0.0%) |
| $50,000 to $74,999 | 8 (3.5%) | 0 (0.0%) |
| $75,000 to $99,999 | 61 (26.3%) | 10 (2.0%) |
| $100,000 to $149,999 | 0 (0.0%) | 24 (4.9%) |
| $150,000 or more | 110 (47.4%) | 81 (16.5%) |
| Total | 232 (100.0%) | 492 (100.0%) |
Property Value to Household Income Ratio in Cranbury
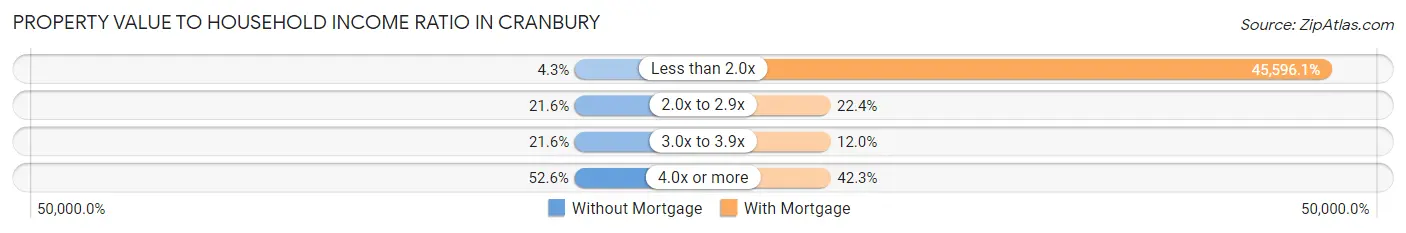
| Value-to-Income Ratio | Without Mortgage | With Mortgage |
| Less than 2.0x | 10 (4.3%) | 224,333 (45,596.1%) |
| 2.0x to 2.9x | 50 (21.5%) | 110 (22.4%) |
| 3.0x to 3.9x | 50 (21.5%) | 59 (12.0%) |
| 4.0x or more | 122 (52.6%) | 208 (42.3%) |
| Total | 232 (100.0%) | 492 (100.0%) |
Real Estate Taxes by Mortgage Status in Cranbury
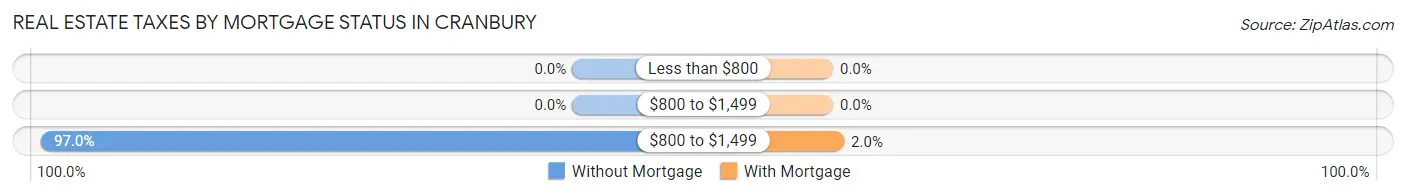
| Property Taxes | Without Mortgage | With Mortgage |
| Less than $800 | 0 (0.0%) | 0 (0.0%) |
| $800 to $1,499 | 0 (0.0%) | 0 (0.0%) |
| $800 to $1,499 | 225 (97.0%) | 10 (2.0%) |
| Total | 232 (100.0%) | 492 (100.0%) |
Health & Disability in Cranbury
Health Insurance Coverage by Age in Cranbury
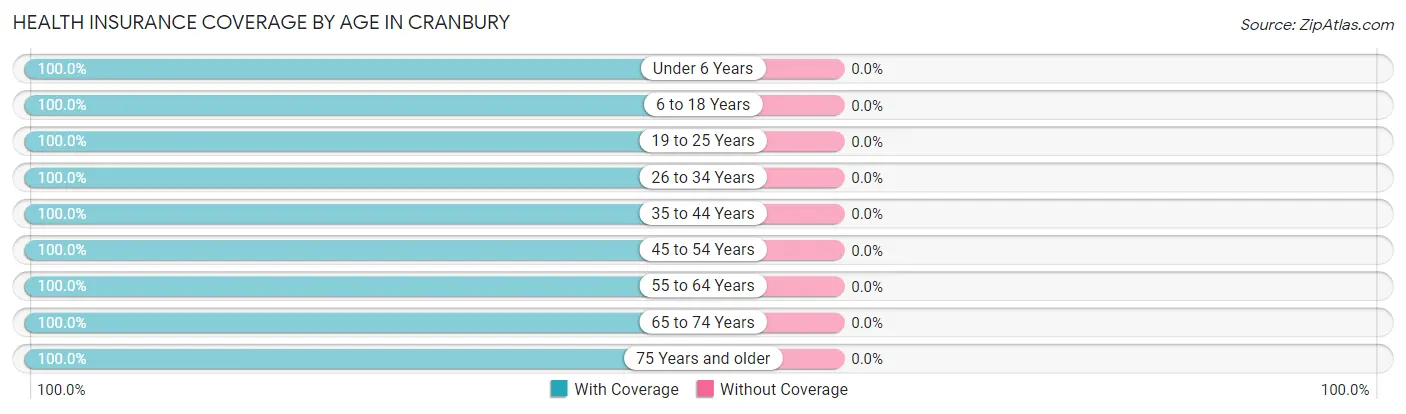
| Age Bracket | With Coverage | Without Coverage |
| Under 6 Years | 79 (100.0%) | 0 (0.0%) |
| 6 to 18 Years | 453 (100.0%) | 0 (0.0%) |
| 19 to 25 Years | 122 (100.0%) | 0 (0.0%) |
| 26 to 34 Years | 212 (100.0%) | 0 (0.0%) |
| 35 to 44 Years | 276 (100.0%) | 0 (0.0%) |
| 45 to 54 Years | 453 (100.0%) | 0 (0.0%) |
| 55 to 64 Years | 407 (100.0%) | 0 (0.0%) |
| 65 to 74 Years | 263 (100.0%) | 0 (0.0%) |
| 75 Years and older | 61 (100.0%) | 0 (0.0%) |
| Total | 2,326 (100.0%) | 0 (0.0%) |
Health Insurance Coverage by Citizenship Status in Cranbury
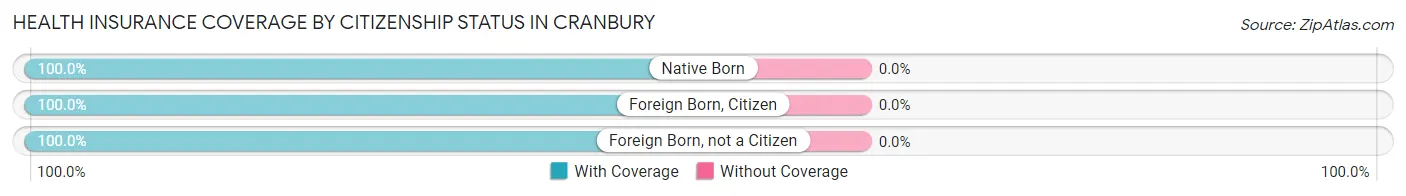
| Citizenship Status | With Coverage | Without Coverage |
| Native Born | 79 (100.0%) | 0 (0.0%) |
| Foreign Born, Citizen | 453 (100.0%) | 0 (0.0%) |
| Foreign Born, not a Citizen | 122 (100.0%) | 0 (0.0%) |
Health Insurance Coverage by Household Income in Cranbury
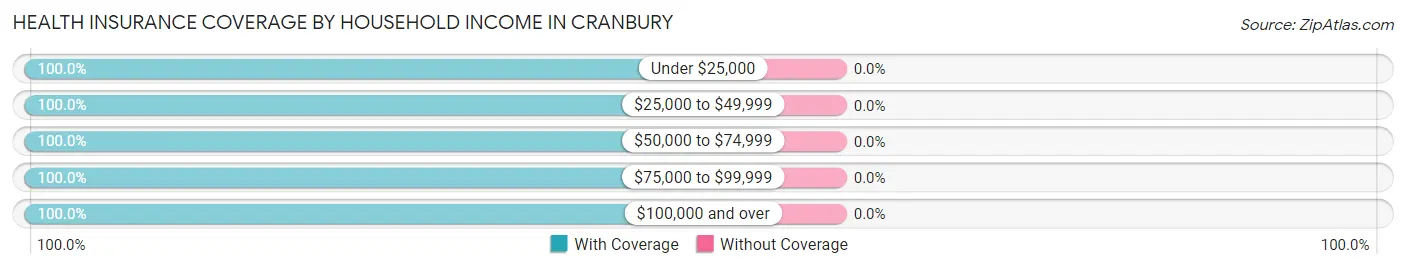
| Household Income | With Coverage | Without Coverage |
| Under $25,000 | 75 (100.0%) | 0 (0.0%) |
| $25,000 to $49,999 | 76 (100.0%) | 0 (0.0%) |
| $50,000 to $74,999 | 26 (100.0%) | 0 (0.0%) |
| $75,000 to $99,999 | 164 (100.0%) | 0 (0.0%) |
| $100,000 and over | 1,985 (100.0%) | 0 (0.0%) |
Public vs Private Health Insurance Coverage by Age in Cranbury
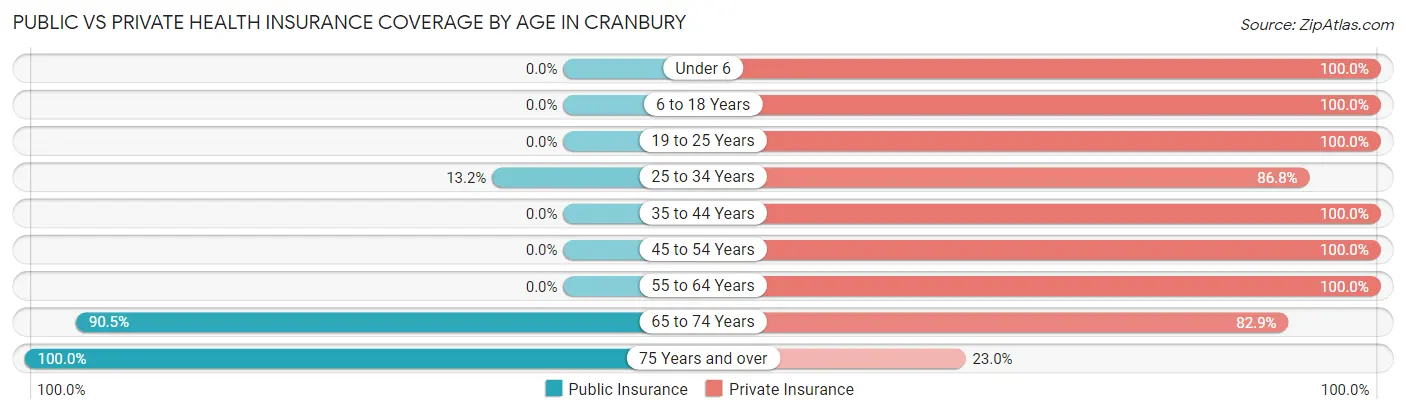
| Age Bracket | Public Insurance | Private Insurance |
| Under 6 | 0 (0.0%) | 79 (100.0%) |
| 6 to 18 Years | 0 (0.0%) | 453 (100.0%) |
| 19 to 25 Years | 0 (0.0%) | 122 (100.0%) |
| 25 to 34 Years | 28 (13.2%) | 184 (86.8%) |
| 35 to 44 Years | 0 (0.0%) | 276 (100.0%) |
| 45 to 54 Years | 0 (0.0%) | 453 (100.0%) |
| 55 to 64 Years | 0 (0.0%) | 407 (100.0%) |
| 65 to 74 Years | 238 (90.5%) | 218 (82.9%) |
| 75 Years and over | 61 (100.0%) | 14 (23.0%) |
| Total | 327 (14.1%) | 2,206 (94.8%) |
Disability Status by Sex by Age in Cranbury
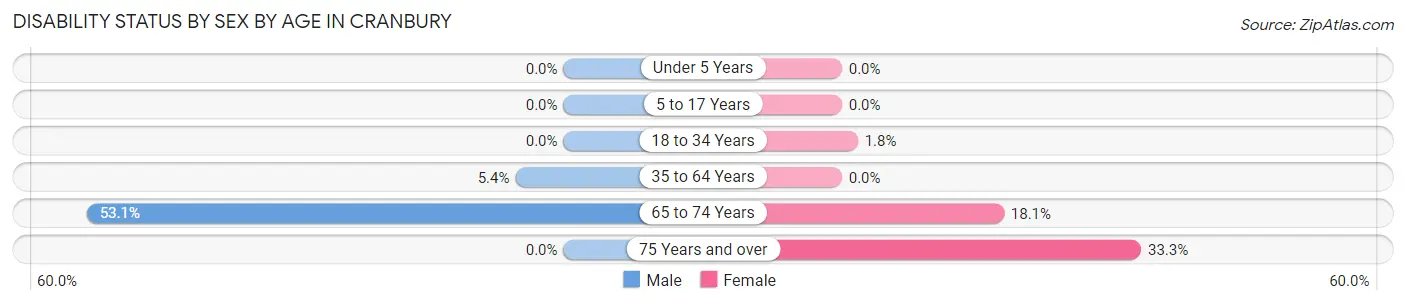
| Age Bracket | Male | Female |
| Under 5 Years | 0 (0.0%) | 0 (0.0%) |
| 5 to 17 Years | 0 (0.0%) | 0 (0.0%) |
| 18 to 34 Years | 0 (0.0%) | 4 (1.8%) |
| 35 to 64 Years | 31 (5.3%) | 0 (0.0%) |
| 65 to 74 Years | 69 (53.1%) | 24 (18.0%) |
| 75 Years and over | 0 (0.0%) | 13 (33.3%) |
Disability Class by Sex by Age in Cranbury
Disability Class: Hearing Difficulty
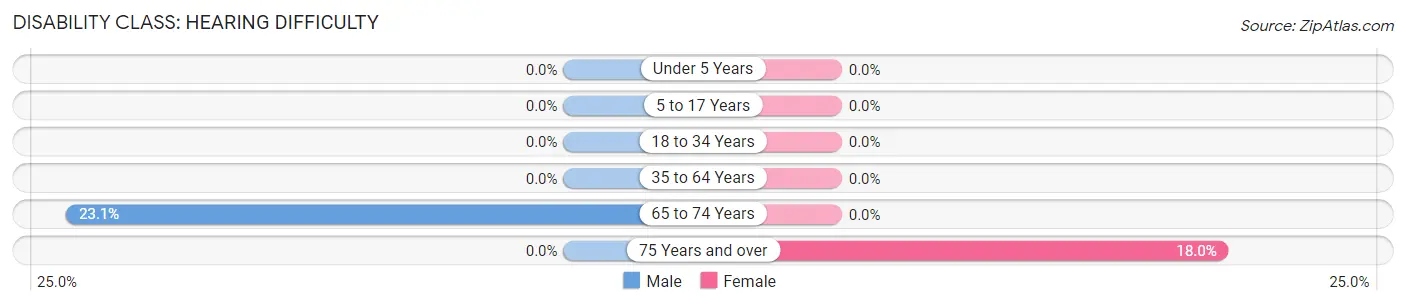
| Age Bracket | Male | Female |
| Under 5 Years | 0 (0.0%) | 0 (0.0%) |
| 5 to 17 Years | 0 (0.0%) | 0 (0.0%) |
| 18 to 34 Years | 0 (0.0%) | 0 (0.0%) |
| 35 to 64 Years | 0 (0.0%) | 0 (0.0%) |
| 65 to 74 Years | 30 (23.1%) | 0 (0.0%) |
| 75 Years and over | 0 (0.0%) | 7 (17.9%) |
Disability Class: Vision Difficulty
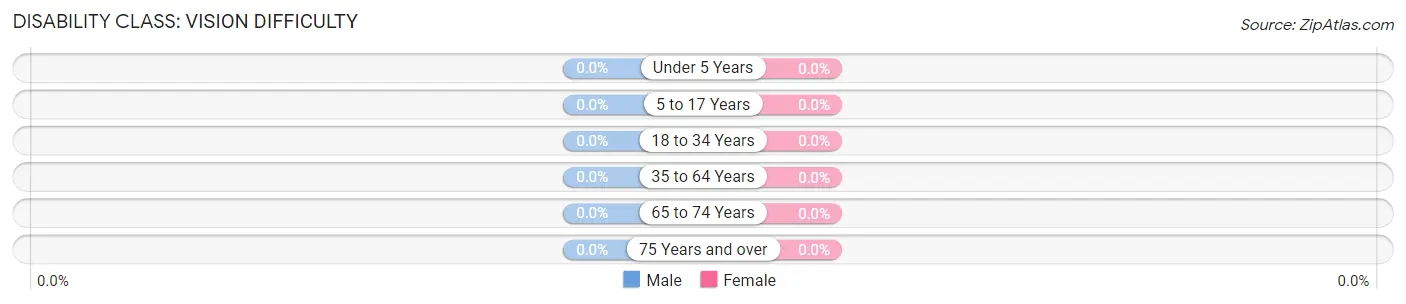
| Age Bracket | Male | Female |
| Under 5 Years | 0 (0.0%) | 0 (0.0%) |
| 5 to 17 Years | 0 (0.0%) | 0 (0.0%) |
| 18 to 34 Years | 0 (0.0%) | 0 (0.0%) |
| 35 to 64 Years | 0 (0.0%) | 0 (0.0%) |
| 65 to 74 Years | 0 (0.0%) | 0 (0.0%) |
| 75 Years and over | 0 (0.0%) | 0 (0.0%) |
Disability Class: Cognitive Difficulty
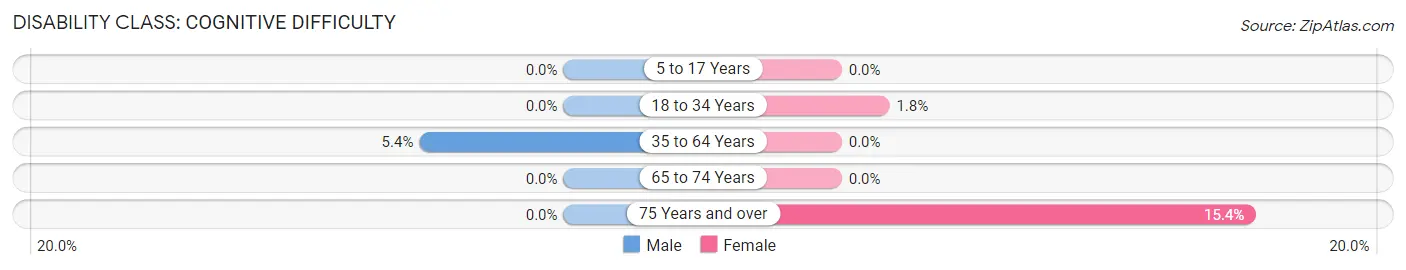
| Age Bracket | Male | Female |
| 5 to 17 Years | 0 (0.0%) | 0 (0.0%) |
| 18 to 34 Years | 0 (0.0%) | 4 (1.8%) |
| 35 to 64 Years | 31 (5.3%) | 0 (0.0%) |
| 65 to 74 Years | 0 (0.0%) | 0 (0.0%) |
| 75 Years and over | 0 (0.0%) | 6 (15.4%) |
Disability Class: Ambulatory Difficulty
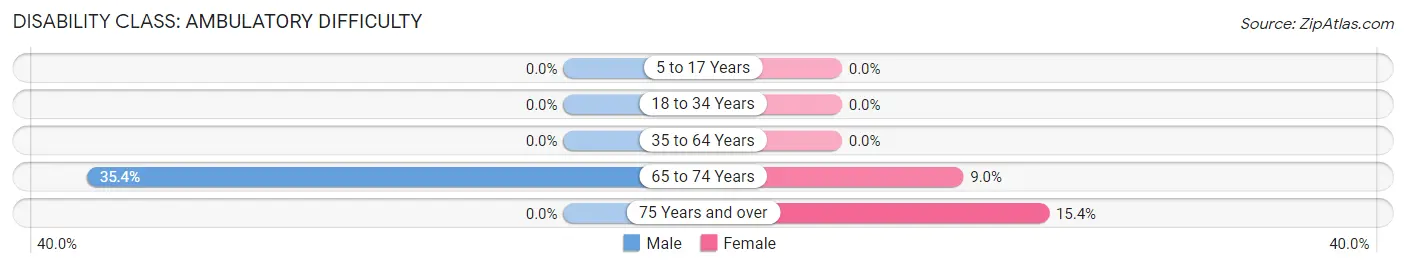
| Age Bracket | Male | Female |
| 5 to 17 Years | 0 (0.0%) | 0 (0.0%) |
| 18 to 34 Years | 0 (0.0%) | 0 (0.0%) |
| 35 to 64 Years | 0 (0.0%) | 0 (0.0%) |
| 65 to 74 Years | 46 (35.4%) | 12 (9.0%) |
| 75 Years and over | 0 (0.0%) | 6 (15.4%) |
Disability Class: Self-Care Difficulty
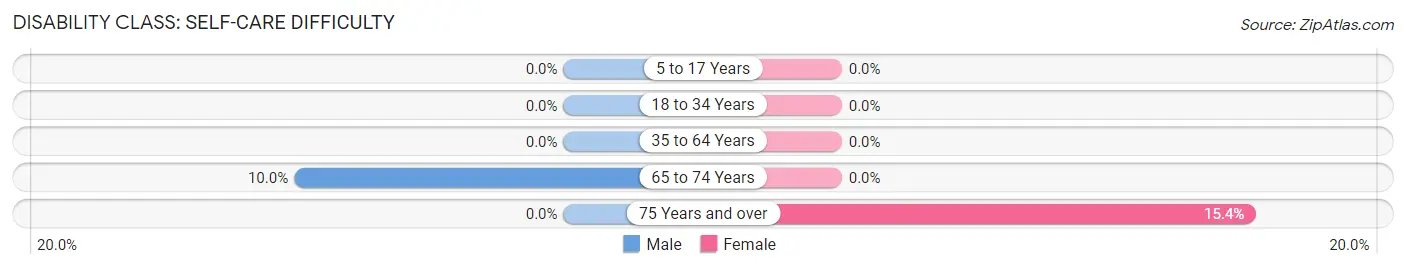
| Age Bracket | Male | Female |
| 5 to 17 Years | 0 (0.0%) | 0 (0.0%) |
| 18 to 34 Years | 0 (0.0%) | 0 (0.0%) |
| 35 to 64 Years | 0 (0.0%) | 0 (0.0%) |
| 65 to 74 Years | 13 (10.0%) | 0 (0.0%) |
| 75 Years and over | 0 (0.0%) | 6 (15.4%) |
Technology Access in Cranbury
Computing Device Access in Cranbury
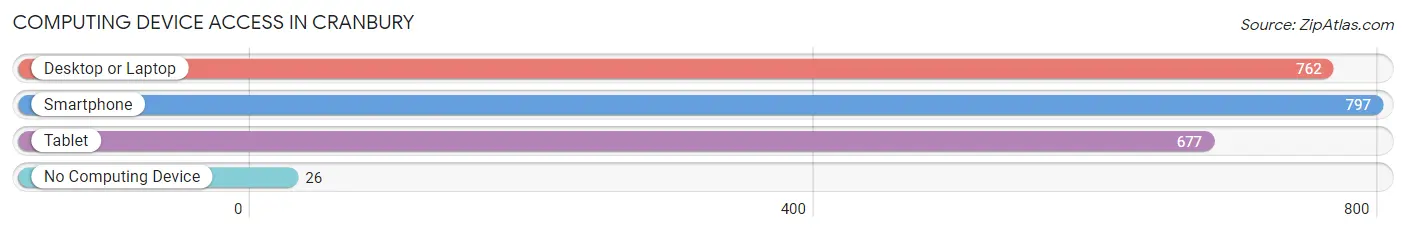
| Device Type | # Households | % Households |
| Desktop or Laptop | 762 | 91.3% |
| Smartphone | 797 | 95.5% |
| Tablet | 677 | 81.1% |
| No Computing Device | 26 | 3.1% |
| Total | 835 | 100.0% |
Internet Access in Cranbury
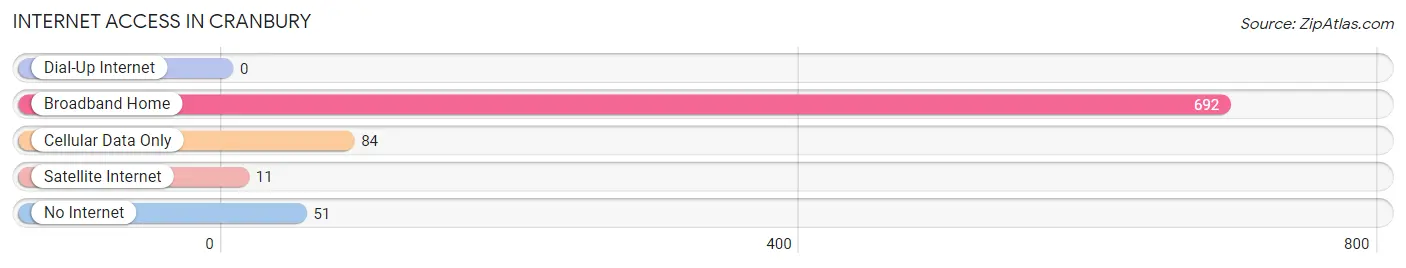
| Internet Type | # Households | % Households |
| Dial-Up Internet | 0 | 0.0% |
| Broadband Home | 692 | 82.9% |
| Cellular Data Only | 84 | 10.1% |
| Satellite Internet | 11 | 1.3% |
| No Internet | 51 | 6.1% |
| Total | 835 | 100.0% |
Cranbury Summary
Cranbury is a small township located in Middlesex County, New Jersey. It is situated in the heart of Central New Jersey, approximately 30 miles south of New York City and 40 miles north of Philadelphia. The township is bordered by East Windsor Township to the north, Monroe Township to the south, Plainsboro Township to the east, and South Brunswick Township to the west. Cranbury is a rural community with a population of approximately 4,000 people.
History
Cranbury was first settled in 1698 by a group of Quakers from Long Island, New York. The town was originally known as Cranberry, but the name was changed to Cranbury in 1838. The town was officially incorporated in 1872.
Cranbury was an agricultural community for much of its history. The town was known for its cranberry bogs, which were a major source of income for the townspeople. The cranberry industry declined in the late 19th century, and the town shifted to a more suburban lifestyle.
Geography
Cranbury is located in Central New Jersey, approximately 30 miles south of New York City and 40 miles north of Philadelphia. The township is bordered by East Windsor Township to the north, Monroe Township to the south, Plainsboro Township to the east, and South Brunswick Township to the west.
The township covers an area of 8.3 square miles, of which 8.2 square miles is land and 0.1 square miles is water. The terrain is mostly flat, with some rolling hills in the northern part of the township. The highest point in the township is the summit of Cranbury Mountain, which is located in the northern part of the township and has an elevation of approximately 200 feet.
Economy
Cranbury is a primarily residential community, with a small commercial district located in the center of town. The town is home to several small businesses, including restaurants, retail stores, and professional services.
The township is also home to several large employers, including the Princeton Plasma Physics Laboratory, a research facility operated by Princeton University, and the New Jersey Turnpike Authority, which operates the New Jersey Turnpike.
Demographics
As of the 2010 census, Cranbury had a population of 4,103 people. The racial makeup of the township was 87.3% White, 4.2% African American, 0.2% Native American, 5.2% Asian, and 2.9% from other races. Hispanic or Latino of any race were 8.2% of the population.
The median household income in Cranbury was $118,958, and the median family income was $133,958. The per capita income was $50,958. About 2.3% of families and 3.2% of the population were below the poverty line.
Common Questions
What is Per Capita Income in Cranbury?
Per Capita income in Cranbury is $85,161.
What is the Median Family Income in Cranbury?
Median Family Income in Cranbury is $223,917.
What is the Median Household income in Cranbury?
Median Household Income in Cranbury is $202,250.
What is Income or Wage Gap in Cranbury?
Income or Wage Gap in Cranbury is 39.9%.
Women in Cranbury earn 60.1 cents for every dollar earned by a man.
What is Inequality or Gini Index in Cranbury?
Inequality or Gini Index in Cranbury is 0.41.
What is the Total Population of Cranbury?
Total Population of Cranbury is 2,430.
What is the Total Male Population of Cranbury?
Total Male Population of Cranbury is 1,217.
What is the Total Female Population of Cranbury?
Total Female Population of Cranbury is 1,213.
What is the Ratio of Males per 100 Females in Cranbury?
There are 100.33 Males per 100 Females in Cranbury.
What is the Ratio of Females per 100 Males in Cranbury?
There are 99.67 Females per 100 Males in Cranbury.
What is the Median Population Age in Cranbury?
Median Population Age in Cranbury is 47.5 Years.
What is the Average Family Size in Cranbury
Average Family Size in Cranbury is 3.1 People.
What is the Average Household Size in Cranbury
Average Household Size in Cranbury is 2.8 People.
How Large is the Labor Force in Cranbury?
There are 1,529 People in the Labor Forcein in Cranbury.
What is the Percentage of People in the Labor Force in Cranbury?
74.5% of People are in the Labor Force in Cranbury.
What is the Unemployment Rate in Cranbury?
Unemployment Rate in Cranbury is 4.4%.