Cities with the Highest Percentage of Venezuelan Population in New Jersey
RELATED REPORTS & OPTIONS
Venezuelan
New Jersey
Compare Cities
Map of Cities with the Highest Percentage of Venezuelan Population in New Jersey
0.00%
4.00%
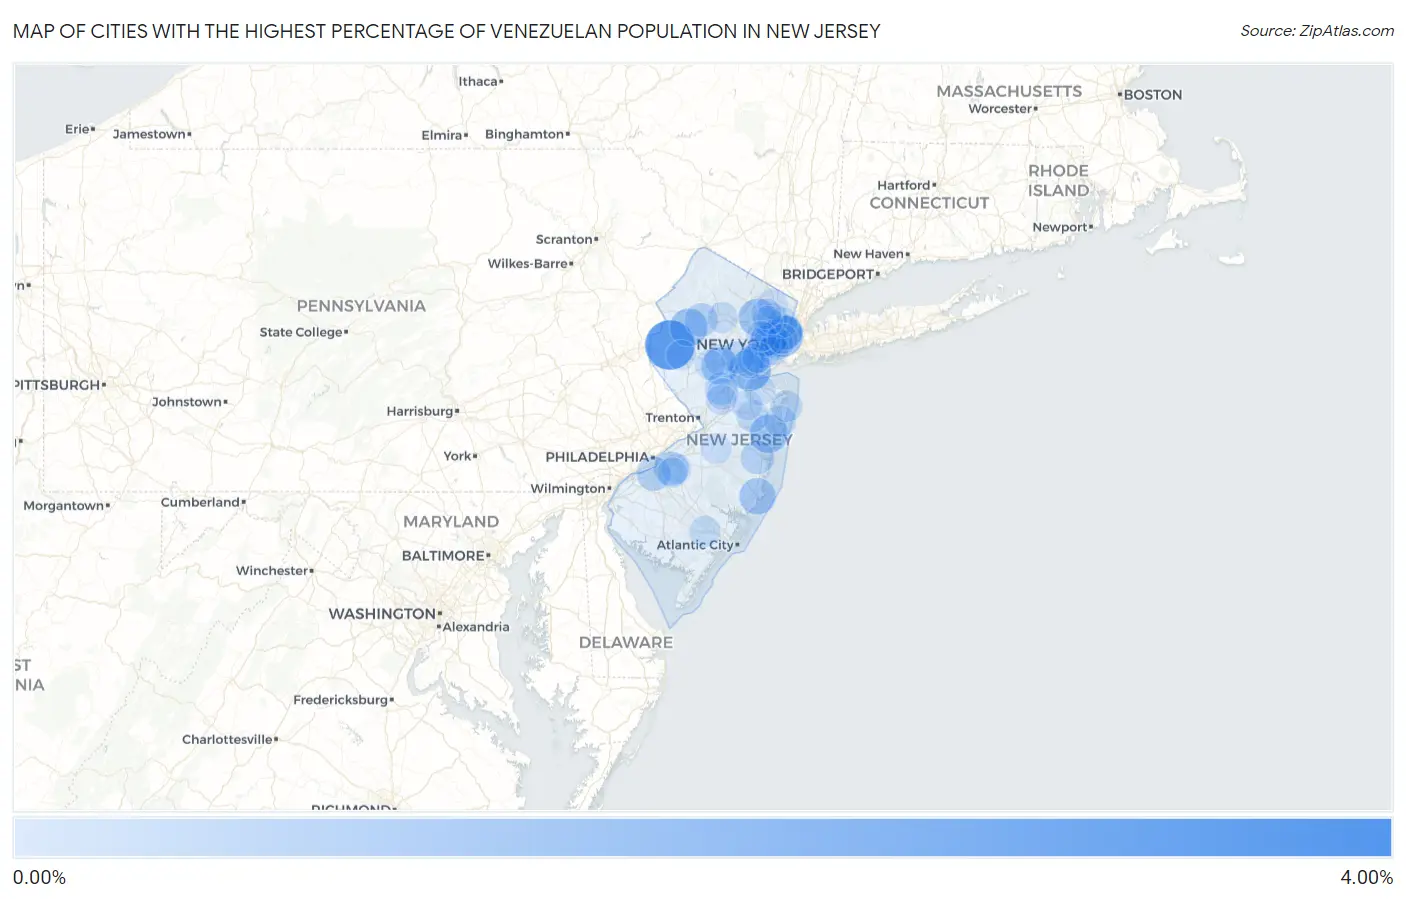
Cities with the Highest Percentage of Venezuelan Population in New Jersey
| City | Venezuelan | vs State | vs National | |
| 1. | Prospect Park Borough | 3.43% | 0.18% (+3.25)#1 | 0.19% (+3.24)#86 |
| 2. | Asbury | 2.96% | 0.18% (+2.78)#2 | 0.19% (+2.77)#103 |
| 3. | Waldwick Borough | 2.70% | 0.18% (+2.52)#3 | 0.19% (+2.51)#120 |
| 4. | Rockaway Borough | 2.46% | 0.18% (+2.28)#4 | 0.19% (+2.27)#136 |
| 5. | Great Notch | 2.04% | 0.18% (+1.86)#5 | 0.19% (+1.85)#182 |
| 6. | Wharton Borough | 1.87% | 0.18% (+1.69)#6 | 0.19% (+1.68)#196 |
| 7. | Lyons | 1.81% | 0.18% (+1.63)#7 | 0.19% (+1.62)#208 |
| 8. | Fords | 1.81% | 0.18% (+1.63)#8 | 0.19% (+1.62)#209 |
| 9. | Union City | 1.69% | 0.18% (+1.51)#9 | 0.19% (+1.50)#224 |
| 10. | Haledon Borough | 1.61% | 0.18% (+1.43)#10 | 0.19% (+1.42)#232 |
| 11. | Victory Gardens Borough | 1.59% | 0.18% (+1.41)#11 | 0.19% (+1.40)#233 |
| 12. | South Plainfield Borough | 1.48% | 0.18% (+1.30)#12 | 0.19% (+1.29)#250 |
| 13. | Cranford | 1.39% | 0.18% (+1.21)#13 | 0.19% (+1.20)#267 |
| 14. | Ringoes | 1.32% | 0.18% (+1.14)#14 | 0.19% (+1.13)#287 |
| 15. | Ramtown | 1.28% | 0.18% (+1.10)#15 | 0.19% (+1.09)#299 |
| 16. | Beattystown | 1.23% | 0.18% (+1.05)#16 | 0.19% (+1.04)#314 |
| 17. | Singac | 1.22% | 0.18% (+1.04)#17 | 0.19% (+1.03)#319 |
| 18. | Garwood Borough | 1.19% | 0.18% (+1.01)#18 | 0.19% (+0.999)#331 |
| 19. | Finderne | 1.16% | 0.18% (+0.977)#19 | 0.19% (+0.967)#343 |
| 20. | Hasbrouck Heights Borough | 1.12% | 0.18% (+0.938)#20 | 0.19% (+0.928)#348 |
| 21. | Manahawkin | 1.05% | 0.18% (+0.867)#21 | 0.19% (+0.857)#372 |
| 22. | South River Borough | 1.01% | 0.18% (+0.834)#22 | 0.19% (+0.824)#383 |
| 23. | Harrison | 0.97% | 0.18% (+0.788)#23 | 0.19% (+0.778)#402 |
| 24. | West New York | 0.95% | 0.18% (+0.768)#24 | 0.19% (+0.758)#412 |
| 25. | Cliffside Park Borough | 0.91% | 0.18% (+0.733)#25 | 0.19% (+0.722)#428 |
| 26. | New Milford Borough | 0.85% | 0.18% (+0.667)#26 | 0.19% (+0.657)#463 |
| 27. | Alpine Borough | 0.83% | 0.18% (+0.649)#27 | 0.19% (+0.638)#473 |
| 28. | Ramapo College Of New Jersey | 0.76% | 0.18% (+0.578)#28 | 0.19% (+0.568)#509 |
| 29. | Ashland | 0.76% | 0.18% (+0.577)#29 | 0.19% (+0.567)#510 |
| 30. | Woodbury | 0.73% | 0.18% (+0.552)#30 | 0.19% (+0.542)#532 |
| 31. | Guttenberg | 0.73% | 0.18% (+0.551)#31 | 0.19% (+0.541)#533 |
| 32. | Ship Bottom Borough | 0.70% | 0.18% (+0.524)#32 | 0.19% (+0.514)#559 |
| 33. | Leonia Borough | 0.68% | 0.18% (+0.500)#33 | 0.19% (+0.490)#572 |
| 34. | Sayreville Borough | 0.66% | 0.18% (+0.478)#34 | 0.19% (+0.468)#581 |
| 35. | Elizabeth | 0.66% | 0.18% (+0.478)#35 | 0.19% (+0.468)#582 |
| 36. | Flanders | 0.65% | 0.18% (+0.475)#36 | 0.19% (+0.465)#585 |
| 37. | Holiday City South | 0.63% | 0.18% (+0.455)#37 | 0.19% (+0.445)#604 |
| 38. | Budd Lake | 0.63% | 0.18% (+0.452)#38 | 0.19% (+0.441)#607 |
| 39. | Glassboro Borough | 0.60% | 0.18% (+0.424)#39 | 0.19% (+0.414)#632 |
| 40. | Kearny | 0.58% | 0.18% (+0.399)#40 | 0.19% (+0.389)#657 |
| 41. | Jamesburg Borough | 0.57% | 0.18% (+0.391)#41 | 0.19% (+0.381)#664 |
| 42. | Kendall Park | 0.55% | 0.18% (+0.366)#42 | 0.19% (+0.356)#685 |
| 43. | Robbinsville Center | 0.49% | 0.18% (+0.315)#43 | 0.19% (+0.305)#740 |
| 44. | Metuchen Borough | 0.46% | 0.18% (+0.282)#44 | 0.19% (+0.272)#775 |
| 45. | Plainfield | 0.46% | 0.18% (+0.277)#45 | 0.19% (+0.267)#781 |
| 46. | Hawthorne Borough | 0.45% | 0.18% (+0.273)#46 | 0.19% (+0.263)#788 |
| 47. | Lodi Borough | 0.45% | 0.18% (+0.267)#47 | 0.19% (+0.257)#794 |
| 48. | West Freehold | 0.43% | 0.18% (+0.250)#48 | 0.19% (+0.239)#814 |
| 49. | Lake Hopatcong | 0.42% | 0.18% (+0.240)#49 | 0.19% (+0.230)#823 |
| 50. | Shark River Hills | 0.40% | 0.18% (+0.219)#50 | 0.19% (+0.209)#856 |
| 51. | Rahway | 0.40% | 0.18% (+0.218)#51 | 0.19% (+0.208)#857 |
| 52. | Long Branch | 0.39% | 0.18% (+0.215)#52 | 0.19% (+0.205)#864 |
| 53. | Carlstadt Borough | 0.38% | 0.18% (+0.199)#53 | 0.19% (+0.189)#887 |
| 54. | Roselle Park Borough | 0.37% | 0.18% (+0.186)#54 | 0.19% (+0.176)#903 |
| 55. | North Plainfield Borough | 0.36% | 0.18% (+0.182)#55 | 0.19% (+0.172)#911 |
| 56. | Edgewater Borough | 0.36% | 0.18% (+0.182)#56 | 0.19% (+0.172)#912 |
| 57. | Jersey City | 0.36% | 0.18% (+0.179)#57 | 0.19% (+0.169)#920 |
| 58. | Packanack Lake | 0.35% | 0.18% (+0.171)#58 | 0.19% (+0.161)#937 |
| 59. | Colonia | 0.34% | 0.18% (+0.165)#59 | 0.19% (+0.155)#949 |
| 60. | Mountainside Borough | 0.34% | 0.18% (+0.164)#60 | 0.19% (+0.154)#953 |
| 61. | Monmouth Junction | 0.33% | 0.18% (+0.149)#61 | 0.19% (+0.139)#980 |
| 62. | Mays Landing | 0.32% | 0.18% (+0.144)#62 | 0.19% (+0.134)#992 |
| 63. | North Caldwell Borough | 0.32% | 0.18% (+0.137)#63 | 0.19% (+0.127)#1,005 |
| 64. | Westville Borough | 0.30% | 0.18% (+0.124)#64 | 0.19% (+0.114)#1,046 |
| 65. | Lindenwold Borough | 0.30% | 0.18% (+0.116)#65 | 0.19% (+0.106)#1,062 |
| 66. | Martinsville | 0.27% | 0.18% (+0.095)#66 | 0.19% (+0.085)#1,116 |
| 67. | Watsessing | 0.27% | 0.18% (+0.092)#67 | 0.19% (+0.082)#1,119 |
| 68. | Ampere North | 0.27% | 0.18% (+0.092)#68 | 0.19% (+0.081)#1,122 |
| 69. | Oakland Borough | 0.26% | 0.18% (+0.080)#69 | 0.19% (+0.069)#1,161 |
| 70. | Newark | 0.26% | 0.18% (+0.077)#70 | 0.19% (+0.067)#1,170 |
| 71. | Garfield | 0.26% | 0.18% (+0.076)#71 | 0.19% (+0.066)#1,174 |
| 72. | Dover | 0.25% | 0.18% (+0.070)#72 | 0.19% (+0.060)#1,191 |
| 73. | Allenhurst Borough | 0.24% | 0.18% (+0.063)#73 | 0.19% (+0.053)#1,210 |
| 74. | Cresskill Borough | 0.24% | 0.18% (+0.062)#74 | 0.19% (+0.052)#1,214 |
| 75. | Mckee | 0.23% | 0.18% (+0.050)#75 | 0.19% (+0.040)#1,246 |
| 76. | Ridgefield Park | 0.23% | 0.18% (+0.048)#76 | 0.19% (+0.038)#1,249 |
| 77. | Linden | 0.22% | 0.18% (+0.044)#77 | 0.19% (+0.033)#1,260 |
| 78. | Newfield Borough | 0.22% | 0.18% (+0.039)#78 | 0.19% (+0.029)#1,272 |
| 79. | River Edge Borough | 0.22% | 0.18% (+0.037)#79 | 0.19% (+0.027)#1,278 |
| 80. | Bayonne | 0.22% | 0.18% (+0.036)#80 | 0.19% (+0.026)#1,282 |
| 81. | Princeton Meadows | 0.21% | 0.18% (+0.032)#81 | 0.19% (+0.022)#1,294 |
| 82. | Ridgewood | 0.21% | 0.18% (+0.032)#82 | 0.19% (+0.022)#1,297 |
| 83. | Fort Dix | 0.21% | 0.18% (+0.026)#83 | 0.19% (+0.016)#1,317 |
| 84. | Strathmore | 0.20% | 0.18% (+0.023)#84 | 0.19% (+0.013)#1,330 |
| 85. | Clifton | 0.20% | 0.18% (+0.022)#85 | 0.19% (+0.012)#1,336 |
| 86. | Island Heights Borough | 0.20% | 0.18% (+0.018)#86 | 0.19% (+0.008)#1,353 |
| 87. | Paterson | 0.20% | 0.18% (+0.017)#87 | 0.19% (+0.007)#1,354 |
| 88. | Rumson Borough | 0.19% | 0.18% (+0.013)#88 | 0.19% (+0.003)#1,370 |
| 89. | The Hills | 0.19% | 0.18% (+0.012)#89 | 0.19% (+0.002)#1,371 |
| 90. | Springdale | 0.18% | 0.18% (+0.004)#90 | 0.19% (-0.006)#1,398 |
| 91. | Paramus Borough | 0.18% | 0.18% (+0.001)#91 | 0.19% (-0.009)#1,410 |
| 92. | Yorketown | 0.18% | 0.18% (+0.001)#92 | 0.19% (-0.009)#1,411 |
| 93. | East Orange | 0.18% | 0.18% (-0.004)#93 | 0.19% (-0.014)#1,431 |
| 94. | Bradley Gardens | 0.17% | 0.18% (-0.005)#94 | 0.19% (-0.015)#1,437 |
| 95. | Hoboken | 0.17% | 0.18% (-0.014)#95 | 0.19% (-0.025)#1,484 |
| 96. | Palisades Park Borough | 0.16% | 0.18% (-0.021)#96 | 0.19% (-0.031)#1,518 |
| 97. | Oaklyn Borough | 0.15% | 0.18% (-0.027)#97 | 0.19% (-0.037)#1,544 |
| 98. | Parsippany | 0.15% | 0.18% (-0.028)#98 | 0.19% (-0.038)#1,552 |
| 99. | Echelon | 0.15% | 0.18% (-0.032)#99 | 0.19% (-0.042)#1,570 |
| 100. | Clinton | 0.14% | 0.18% (-0.035)#100 | 0.19% (-0.046)#1,587 |
Common Questions
What are the Top 10 Cities with the Highest Percentage of Venezuelan Population in New Jersey?
Top 10 Cities with the Highest Percentage of Venezuelan Population in New Jersey are:
#1
2.96%
#2
1.81%
#3
1.69%
#4
1.28%
#5
1.23%
#6
1.22%
#7
1.16%
#8
1.05%
#9
0.97%
#10
0.95%
What city has the Highest Percentage of Venezuelan Population in New Jersey?
Asbury has the Highest Percentage of Venezuelan Population in New Jersey with 2.96%.
What is the Percentage of Venezuelan Population in the State of New Jersey?
Percentage of Venezuelan Population in New Jersey is 0.18%.
What is the Percentage of Venezuelan Population in the United States?
Percentage of Venezuelan Population in the United States is 0.19%.