Cities with the Most Immigrants from South Africa in New Jersey
RELATED REPORTS & OPTIONS
South Africa
New Jersey
Compare Cities
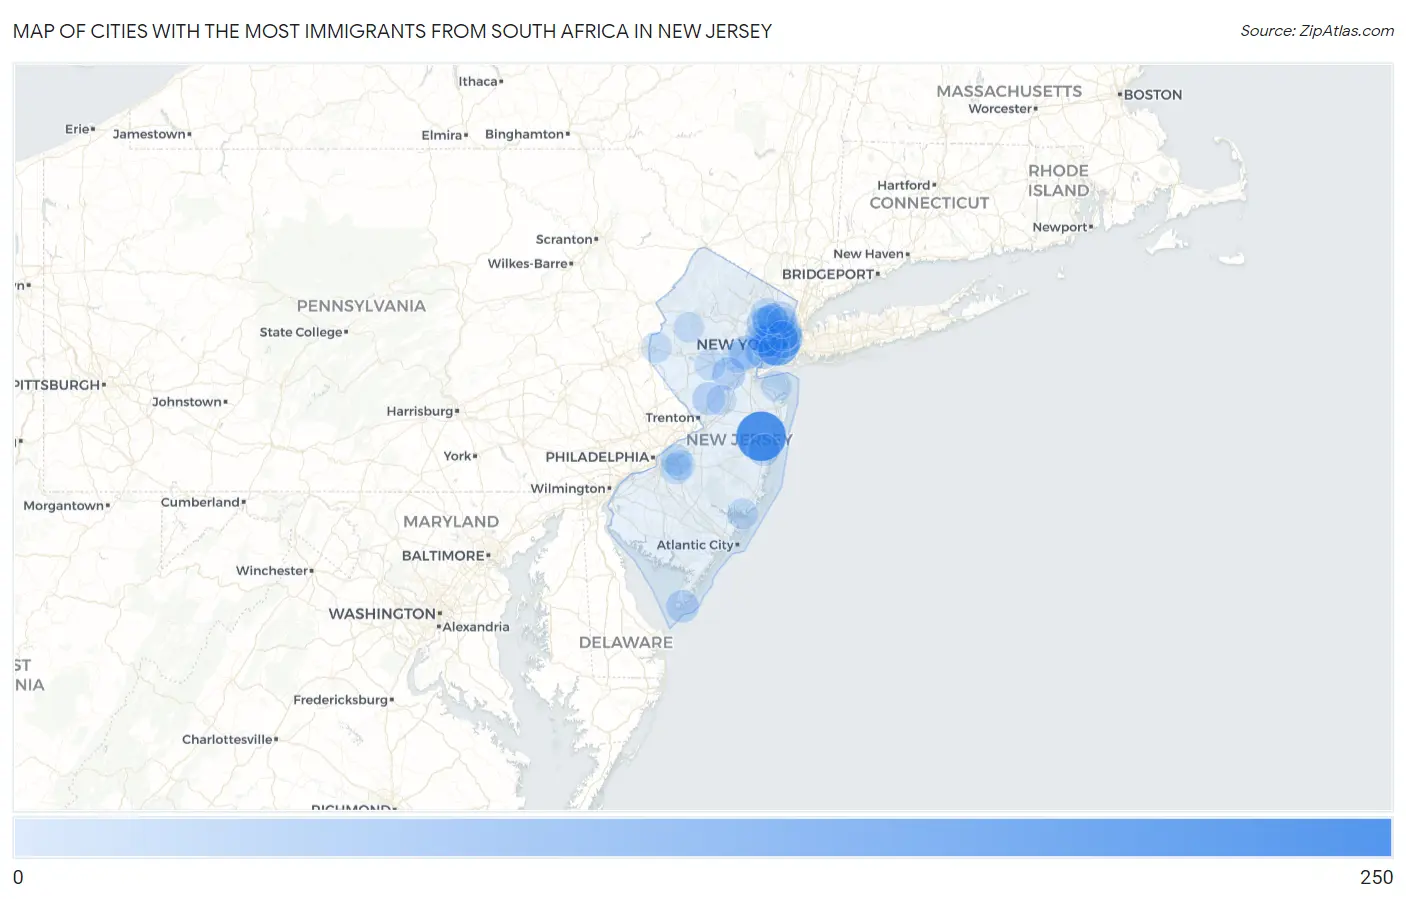
Map of Cities with the Most Immigrants from South Africa in New Jersey
0
250
Cities with the Most Immigrants from South Africa in New Jersey
| City | South Africa | vs State | vs National | |
| 1. | Lakewood | 206 | 3,369(6.11%)#1 | 117,055(0.18%)#64 |
| 2. | Jersey City | 145 | 3,369(4.30%)#2 | 117,055(0.12%)#104 |
| 3. | Hoboken | 97 | 3,369(2.88%)#3 | 117,055(0.08%)#187 |
| 4. | Edgewater Borough | 82 | 3,369(2.43%)#4 | 117,055(0.07%)#244 |
| 5. | Kearny | 56 | 3,369(1.66%)#5 | 117,055(0.05%)#397 |
| 6. | Elizabeth | 54 | 3,369(1.60%)#6 | 117,055(0.05%)#406 |
| 7. | Passaic | 53 | 3,369(1.57%)#7 | 117,055(0.05%)#416 |
| 8. | Mountain Lakes Borough | 49 | 3,369(1.45%)#8 | 117,055(0.04%)#459 |
| 9. | Madison Borough | 46 | 3,369(1.37%)#9 | 117,055(0.04%)#489 |
| 10. | Lincoln Park Borough | 45 | 3,369(1.34%)#10 | 117,055(0.04%)#505 |
| 11. | Tenafly Borough | 44 | 3,369(1.31%)#11 | 117,055(0.04%)#512 |
| 12. | The Hills | 43 | 3,369(1.28%)#12 | 117,055(0.04%)#524 |
| 13. | Westfield | 42 | 3,369(1.25%)#13 | 117,055(0.04%)#528 |
| 14. | West New York | 37 | 3,369(1.10%)#14 | 117,055(0.03%)#600 |
| 15. | Ringwood Borough | 36 | 3,369(1.07%)#15 | 117,055(0.03%)#625 |
| 16. | Chatham Borough | 36 | 3,369(1.07%)#16 | 117,055(0.03%)#627 |
| 17. | Glen Gardner Borough | 32 | 3,369(0.95%)#17 | 117,055(0.03%)#710 |
| 18. | Somerset | 30 | 3,369(0.89%)#18 | 117,055(0.03%)#741 |
| 19. | Newark | 29 | 3,369(0.86%)#19 | 117,055(0.02%)#748 |
| 20. | Princeton | 29 | 3,369(0.86%)#20 | 117,055(0.02%)#759 |
| 21. | Ramsey Borough | 29 | 3,369(0.86%)#21 | 117,055(0.02%)#763 |
| 22. | Mendham Borough | 29 | 3,369(0.86%)#22 | 117,055(0.02%)#768 |
| 23. | Landing | 27 | 3,369(0.80%)#23 | 117,055(0.02%)#808 |
| 24. | Cape May | 27 | 3,369(0.80%)#24 | 117,055(0.02%)#809 |
| 25. | Hillsborough | 26 | 3,369(0.77%)#25 | 117,055(0.02%)#823 |
| 26. | Palisades Park Borough | 23 | 3,369(0.68%)#26 | 117,055(0.02%)#893 |
| 27. | Hackensack | 22 | 3,369(0.65%)#27 | 117,055(0.02%)#908 |
| 28. | Cranford | 22 | 3,369(0.65%)#28 | 117,055(0.02%)#929 |
| 29. | Upper Montclair | 21 | 3,369(0.62%)#29 | 117,055(0.02%)#951 |
| 30. | Toms River | 19 | 3,369(0.56%)#30 | 117,055(0.02%)#992 |
| 31. | Paramus Borough | 19 | 3,369(0.56%)#31 | 117,055(0.02%)#999 |
| 32. | Leonia Borough | 19 | 3,369(0.56%)#32 | 117,055(0.02%)#1,011 |
| 33. | East Orange | 17 | 3,369(0.50%)#33 | 117,055(0.01%)#1,071 |
| 34. | North Caldwell Borough | 17 | 3,369(0.50%)#34 | 117,055(0.01%)#1,105 |
| 35. | Oak Ridge | 16 | 3,369(0.47%)#35 | 117,055(0.01%)#1,136 |
| 36. | Packanack Lake | 16 | 3,369(0.47%)#36 | 117,055(0.01%)#1,145 |
| 37. | Sayreville Borough | 15 | 3,369(0.45%)#37 | 117,055(0.01%)#1,171 |
| 38. | Fair Lawn Borough | 15 | 3,369(0.45%)#38 | 117,055(0.01%)#1,176 |
| 39. | Paterson | 13 | 3,369(0.39%)#39 | 117,055(0.01%)#1,268 |
| 40. | Clifton | 13 | 3,369(0.39%)#40 | 117,055(0.01%)#1,276 |
| 41. | Bayonne | 13 | 3,369(0.39%)#41 | 117,055(0.01%)#1,279 |
| 42. | Springdale | 13 | 3,369(0.39%)#42 | 117,055(0.01%)#1,306 |
| 43. | Maywood Borough | 13 | 3,369(0.39%)#43 | 117,055(0.01%)#1,311 |
| 44. | Ramblewood | 13 | 3,369(0.39%)#44 | 117,055(0.01%)#1,319 |
| 45. | Bergenfield Borough | 12 | 3,369(0.36%)#45 | 117,055(0.01%)#1,345 |
| 46. | Glen Rock Borough | 12 | 3,369(0.36%)#46 | 117,055(0.01%)#1,359 |
| 47. | Old Tappan Borough | 12 | 3,369(0.36%)#47 | 117,055(0.01%)#1,367 |
| 48. | Peapack And Gladstone Borough | 12 | 3,369(0.36%)#48 | 117,055(0.01%)#1,374 |
| 49. | Liberty Corner | 12 | 3,369(0.36%)#49 | 117,055(0.01%)#1,376 |
| 50. | Plainfield | 11 | 3,369(0.33%)#50 | 117,055(0.01%)#1,394 |
| 51. | Garfield | 11 | 3,369(0.33%)#51 | 117,055(0.01%)#1,402 |
| 52. | Bradley Gardens | 10 | 3,369(0.30%)#52 | 117,055(0.01%)#1,464 |
| 53. | Monmouth Beach Borough | 10 | 3,369(0.30%)#53 | 117,055(0.01%)#1,477 |
| 54. | Thorofare | 10 | 3,369(0.30%)#54 | 117,055(0.01%)#1,479 |
| 55. | Bloomsbury Borough | 10 | 3,369(0.30%)#55 | 117,055(0.01%)#1,488 |
| 56. | Mystic Island | 9 | 3,369(0.27%)#56 | 117,055(0.01%)#1,532 |
| 57. | Essex Fells Borough | 9 | 3,369(0.27%)#57 | 117,055(0.01%)#1,550 |
| 58. | Belford | 9 | 3,369(0.27%)#58 | 117,055(0.01%)#1,552 |
| 59. | Ridgefield Park | 8 | 3,369(0.24%)#59 | 117,055(0.01%)#1,593 |
| 60. | Greenwich | 8 | 3,369(0.24%)#60 | 117,055(0.01%)#1,619 |
| 61. | Neshanic Station | 7 | 3,369(0.21%)#61 | 117,055(0.01%)#1,658 |
| 62. | Chester Borough | 7 | 3,369(0.21%)#62 | 117,055(0.01%)#1,673 |
| 63. | Marlton | 6 | 3,369(0.18%)#63 | 117,055(0.01%)#1,708 |
| 64. | Belmar Borough | 6 | 3,369(0.18%)#64 | 117,055(0.01%)#1,719 |
| 65. | Beattystown | 6 | 3,369(0.18%)#65 | 117,055(0.01%)#1,723 |
| 66. | Bedminster | 6 | 3,369(0.18%)#66 | 117,055(0.01%)#1,738 |
| 67. | Union City | 5 | 3,369(0.15%)#67 | 117,055(0.00%)#1,760 |
| 68. | Princeton Meadows | 5 | 3,369(0.15%)#68 | 117,055(0.00%)#1,776 |
| 69. | Point Pleasant Beach Borough | 4 | 3,369(0.12%)#69 | 117,055(0.00%)#1,854 |
| 70. | Andover Borough | 2 | 3,369(0.06%)#70 | 117,055(0.00%)#1,984 |
| 71. | Califon Borough | 1 | 3,369(0.03%)#71 | 117,055(0.00%)#2,027 |
Common Questions
What are the Top 10 Cities with the Most Immigrants from South Africa in New Jersey?
Top 10 Cities with the Most Immigrants from South Africa in New Jersey are:
#1
206
#2
145
#3
97
#4
56
#5
54
#6
53
#7
42
#8
37
#9
30
#10
29
What city has the Most Immigrants from South Africa in New Jersey?
Lakewood has the Most Immigrants from South Africa in New Jersey with 206.
What is the Total Immigrants from South Africa in the State of New Jersey?
Total Immigrants from South Africa in New Jersey is 3,369.
What is the Total Immigrants from South Africa in the United States?
Total Immigrants from South Africa in the United States is 117,055.