Cities with the Highest Poverty Level Among Single Fathers in New Jersey
RELATED REPORTS & OPTIONS
Highest Poverty | Single Father
New Jersey
Compare Cities
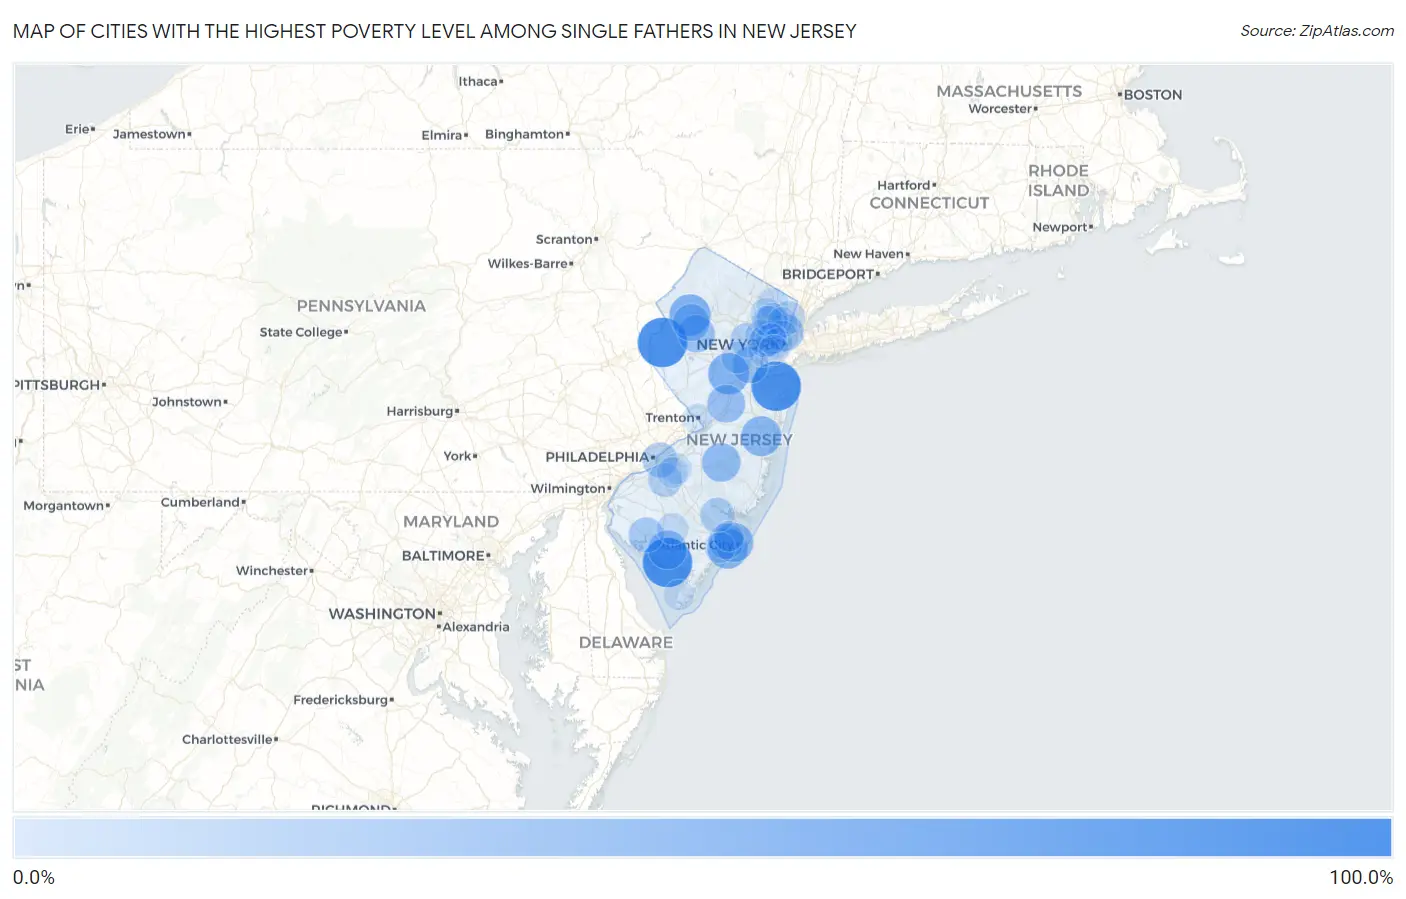
Map of Cities with the Highest Poverty Level Among Single Fathers in New Jersey
0.0%
100.0%
Cities with the Highest Poverty Level Among Single Fathers in New Jersey
| City | Single Father Poverty | vs State | vs National | |
| 1. | Chatham Borough | 100.0% | 11.7%(+88.3)#1 | 13.7%(+86.3)#19 |
| 2. | Kenilworth Borough | 100.0% | 11.7%(+88.3)#2 | 13.7%(+86.3)#24 |
| 3. | Woodcliff Lake Borough | 100.0% | 11.7%(+88.3)#3 | 13.7%(+86.3)#52 |
| 4. | Harrington Park Borough | 100.0% | 11.7%(+88.3)#4 | 13.7%(+86.3)#81 |
| 5. | Saddle River Borough | 100.0% | 11.7%(+88.3)#5 | 13.7%(+86.3)#145 |
| 6. | Keasbey | 100.0% | 11.7%(+88.3)#6 | 13.7%(+86.3)#189 |
| 7. | Pine Beach Borough | 100.0% | 11.7%(+88.3)#7 | 13.7%(+86.3)#220 |
| 8. | Seaside Heights Borough | 100.0% | 11.7%(+88.3)#8 | 13.7%(+86.3)#264 |
| 9. | Belford | 100.0% | 11.7%(+88.3)#9 | 13.7%(+86.3)#276 |
| 10. | Port Norris | 100.0% | 11.7%(+88.3)#10 | 13.7%(+86.3)#306 |
| 11. | New Village | 100.0% | 11.7%(+88.3)#11 | 13.7%(+86.3)#747 |
| 12. | Dorchester | 100.0% | 11.7%(+88.3)#12 | 13.7%(+86.3)#1,060 |
| 13. | Basking Ridge | 81.6% | 11.7%(+69.9)#13 | 13.7%(+67.9)#1,347 |
| 14. | Northvale Borough | 81.6% | 11.7%(+69.9)#14 | 13.7%(+67.9)#1,348 |
| 15. | Carlstadt Borough | 73.7% | 11.7%(+62.0)#15 | 13.7%(+60.0)#1,503 |
| 16. | Rockaway Borough | 67.9% | 11.7%(+56.1)#16 | 13.7%(+54.1)#1,660 |
| 17. | Tenafly Borough | 66.1% | 11.7%(+54.3)#17 | 13.7%(+52.3)#1,757 |
| 18. | Atco | 63.4% | 11.7%(+51.7)#18 | 13.7%(+49.7)#1,822 |
| 19. | Panther Valley | 62.1% | 11.7%(+50.4)#19 | 13.7%(+48.4)#1,855 |
| 20. | Somerset | 61.8% | 11.7%(+50.1)#20 | 13.7%(+48.1)#1,865 |
| 21. | Netcong Borough | 61.5% | 11.7%(+49.8)#21 | 13.7%(+47.8)#1,872 |
| 22. | Collingswood Borough | 56.5% | 11.7%(+44.8)#22 | 13.7%(+42.8)#2,094 |
| 23. | Margate City | 56.2% | 11.7%(+44.5)#23 | 13.7%(+42.5)#2,097 |
| 24. | Lakewood | 55.6% | 11.7%(+43.9)#24 | 13.7%(+41.9)#2,114 |
| 25. | Sussex Borough | 54.5% | 11.7%(+42.8)#25 | 13.7%(+40.8)#2,162 |
| 26. | Hampton Borough | 54.5% | 11.7%(+42.8)#26 | 13.7%(+40.8)#2,166 |
| 27. | Keansburg Borough | 53.9% | 11.7%(+42.2)#27 | 13.7%(+40.2)#2,190 |
| 28. | Atlantic City | 52.4% | 11.7%(+40.7)#28 | 13.7%(+38.7)#2,264 |
| 29. | Woodbine Borough | 52.2% | 11.7%(+40.5)#29 | 13.7%(+38.5)#2,268 |
| 30. | West Park | 52.2% | 11.7%(+40.5)#30 | 13.7%(+38.5)#2,270 |
| 31. | South Toms River Borough | 51.3% | 11.7%(+39.6)#31 | 13.7%(+37.6)#2,301 |
| 32. | Presidential Lakes Estates | 49.3% | 11.7%(+37.6)#32 | 13.7%(+35.6)#2,520 |
| 33. | Laurel Lake | 49.1% | 11.7%(+37.4)#33 | 13.7%(+35.4)#2,528 |
| 34. | Hamburg Borough | 47.7% | 11.7%(+36.0)#34 | 13.7%(+34.0)#2,576 |
| 35. | Cranbury | 46.2% | 11.7%(+34.4)#35 | 13.7%(+32.4)#2,637 |
| 36. | Caldwell Borough | 43.6% | 11.7%(+31.9)#36 | 13.7%(+29.9)#2,759 |
| 37. | Bellmawr Borough | 43.1% | 11.7%(+31.4)#37 | 13.7%(+29.4)#2,786 |
| 38. | Long Valley | 42.9% | 11.7%(+31.1)#38 | 13.7%(+29.1)#2,798 |
| 39. | Guttenberg | 42.4% | 11.7%(+30.6)#39 | 13.7%(+28.6)#2,833 |
| 40. | Hackettstown | 42.0% | 11.7%(+30.3)#40 | 13.7%(+28.3)#2,855 |
| 41. | Hasbrouck Heights Borough | 41.8% | 11.7%(+30.1)#41 | 13.7%(+28.1)#2,868 |
| 42. | Wallington Borough | 40.3% | 11.7%(+28.6)#42 | 13.7%(+26.6)#2,937 |
| 43. | Millstone Borough | 40.0% | 11.7%(+28.3)#43 | 13.7%(+26.3)#2,991 |
| 44. | Iselin | 38.8% | 11.7%(+27.1)#44 | 13.7%(+25.1)#3,071 |
| 45. | Ringwood Borough | 38.2% | 11.7%(+26.5)#45 | 13.7%(+24.5)#3,098 |
| 46. | Troy Hills | 38.1% | 11.7%(+26.4)#46 | 13.7%(+24.4)#3,104 |
| 47. | Neptune City Borough | 38.0% | 11.7%(+26.3)#47 | 13.7%(+24.3)#3,112 |
| 48. | Pleasantville | 36.0% | 11.7%(+24.3)#48 | 13.7%(+22.3)#3,253 |
| 49. | Laurel Springs Borough | 34.8% | 11.7%(+23.1)#49 | 13.7%(+21.1)#3,349 |
| 50. | Camden | 33.7% | 11.7%(+22.0)#50 | 13.7%(+20.0)#3,420 |
| 51. | Bridgeton | 33.4% | 11.7%(+21.7)#51 | 13.7%(+19.7)#3,429 |
| 52. | Brooklawn Borough | 32.1% | 11.7%(+20.4)#52 | 13.7%(+18.4)#3,616 |
| 53. | Harrison | 31.5% | 11.7%(+19.8)#53 | 13.7%(+17.8)#3,666 |
| 54. | Egg Harbor City | 30.8% | 11.7%(+19.1)#54 | 13.7%(+17.1)#3,723 |
| 55. | Bogota Borough | 30.5% | 11.7%(+18.7)#55 | 13.7%(+16.7)#3,751 |
| 56. | Short Hills | 29.6% | 11.7%(+17.9)#56 | 13.7%(+15.9)#3,834 |
| 57. | Blackwood | 27.6% | 11.7%(+15.9)#57 | 13.7%(+13.9)#4,014 |
| 58. | Fairview Borough | 27.0% | 11.7%(+15.3)#58 | 13.7%(+13.3)#4,063 |
| 59. | Edgewater Borough | 26.3% | 11.7%(+14.6)#59 | 13.7%(+12.6)#4,129 |
| 60. | Carteret Borough | 25.0% | 11.7%(+13.3)#60 | 13.7%(+11.3)#4,224 |
| 61. | Passaic | 25.0% | 11.7%(+13.2)#61 | 13.7%(+11.2)#4,299 |
| 62. | Sicklerville | 24.1% | 11.7%(+12.4)#62 | 13.7%(+10.4)#4,353 |
| 63. | South Bound Brook Borough | 23.7% | 11.7%(+12.0)#63 | 13.7%(+9.97)#4,384 |
| 64. | Englewood | 23.7% | 11.7%(+11.9)#64 | 13.7%(+9.94)#4,389 |
| 65. | Fair Lawn Borough | 23.4% | 11.7%(+11.7)#65 | 13.7%(+9.73)#4,411 |
| 66. | Fieldsboro Borough | 21.7% | 11.7%(+10.0)#66 | 13.7%(+8.03)#4,605 |
| 67. | East Orange | 20.3% | 11.7%(+8.59)#67 | 13.7%(+6.59)#4,779 |
| 68. | Newark | 19.5% | 11.7%(+7.78)#68 | 13.7%(+5.78)#4,918 |
| 69. | Plainfield | 19.5% | 11.7%(+7.75)#69 | 13.7%(+5.75)#4,924 |
| 70. | Freehold Borough | 19.3% | 11.7%(+7.61)#70 | 13.7%(+5.61)#4,937 |
| 71. | Ridgewood | 18.4% | 11.7%(+6.65)#71 | 13.7%(+4.65)#5,056 |
| 72. | Lake Hopatcong | 17.7% | 11.7%(+5.97)#72 | 13.7%(+3.97)#5,148 |
| 73. | Vineland | 17.7% | 11.7%(+5.96)#73 | 13.7%(+3.96)#5,149 |
| 74. | Bound Brook Borough | 17.3% | 11.7%(+5.60)#74 | 13.7%(+3.60)#5,202 |
| 75. | Woodlynne Borough | 17.2% | 11.7%(+5.48)#75 | 13.7%(+3.48)#5,215 |
| 76. | Paterson | 16.9% | 11.7%(+5.14)#76 | 13.7%(+3.14)#5,250 |
| 77. | Garfield | 16.8% | 11.7%(+5.06)#77 | 13.7%(+3.06)#5,258 |
| 78. | Hillsborough | 15.4% | 11.7%(+3.67)#78 | 13.7%(+1.67)#5,484 |
| 79. | Upper Saddle River Borough | 15.4% | 11.7%(+3.67)#79 | 13.7%(+1.67)#5,485 |
| 80. | Gouldtown | 15.0% | 11.7%(+3.29)#80 | 13.7%(+1.29)#5,544 |
| 81. | Springdale | 14.9% | 11.7%(+3.21)#81 | 13.7%(+1.21)#5,557 |
| 82. | Union City | 14.5% | 11.7%(+2.77)#82 | 13.7%(+0.773)#5,609 |
| 83. | Elizabeth | 14.4% | 11.7%(+2.73)#83 | 13.7%(+0.732)#5,615 |
| 84. | Clifton | 14.3% | 11.7%(+2.59)#84 | 13.7%(+0.592)#5,624 |
| 85. | Linwood | 14.3% | 11.7%(+2.57)#85 | 13.7%(+0.573)#5,632 |
| 86. | Jersey City | 14.3% | 11.7%(+2.54)#86 | 13.7%(+0.542)#5,669 |
| 87. | Echelon | 14.1% | 11.7%(+2.42)#87 | 13.7%(+0.418)#5,681 |
| 88. | Red Bank Borough | 13.8% | 11.7%(+2.12)#88 | 13.7%(+0.122)#5,718 |
| 89. | Ridgefield Park | 12.9% | 11.7%(+1.21)#89 | 13.7%(-0.787)#5,870 |
| 90. | Woodland Park Borough | 12.8% | 11.7%(+1.04)#90 | 13.7%(-0.961)#5,891 |
| 91. | Kearny | 12.7% | 11.7%(+0.986)#91 | 13.7%(-1.01)#5,893 |
| 92. | Leonia Borough | 12.5% | 11.7%(+0.788)#92 | 13.7%(-1.21)#5,919 |
| 93. | Parsippany | 12.2% | 11.7%(+0.461)#93 | 13.7%(-1.54)#5,994 |
| 94. | Manville Borough | 12.1% | 11.7%(+0.409)#94 | 13.7%(-1.59)#6,001 |
| 95. | Absecon | 12.0% | 11.7%(+0.313)#95 | 13.7%(-1.69)#6,014 |
| 96. | Trenton | 11.8% | 11.7%(+0.131)#96 | 13.7%(-1.87)#6,044 |
| 97. | Pompton Lakes Borough | 11.7% | 11.7%(-0.001)#97 | 13.7%(-2.00)#6,066 |
| 98. | Villas | 11.5% | 11.7%(-0.237)#98 | 13.7%(-2.24)#6,094 |
| 99. | Stanhope Borough | 10.9% | 11.7%(-0.843)#99 | 13.7%(-2.84)#6,193 |
| 100. | Bayonne | 10.9% | 11.7%(-0.854)#100 | 13.7%(-2.85)#6,194 |
Common Questions
What are the Top 10 Cities with the Highest Poverty Level Among Single Fathers in New Jersey?
Top 10 Cities with the Highest Poverty Level Among Single Fathers in New Jersey are:
#1
100.0%
#2
100.0%
#3
100.0%
#4
62.1%
#5
61.8%
#6
56.2%
#7
55.6%
#8
52.4%
#9
49.3%
#10
49.1%
What city has the Highest Poverty Level Among Single Fathers in New Jersey?
Belford has the Highest Poverty Level Among Single Fathers in New Jersey with 100.0%.
What is the Poverty Level Among Single Fathers in the State of New Jersey?
Poverty Level Among Single Fathers in New Jersey is 11.7%.
What is the Poverty Level Among Single Fathers in the United States?
Poverty Level Among Single Fathers in the United States is 13.7%.