Cities with the Lowest Costs of Housing as Percentage of Income in New Jersey
RELATED REPORTS & OPTIONS
Lowest Housing Costs / Income
New Jersey
Compare Cities
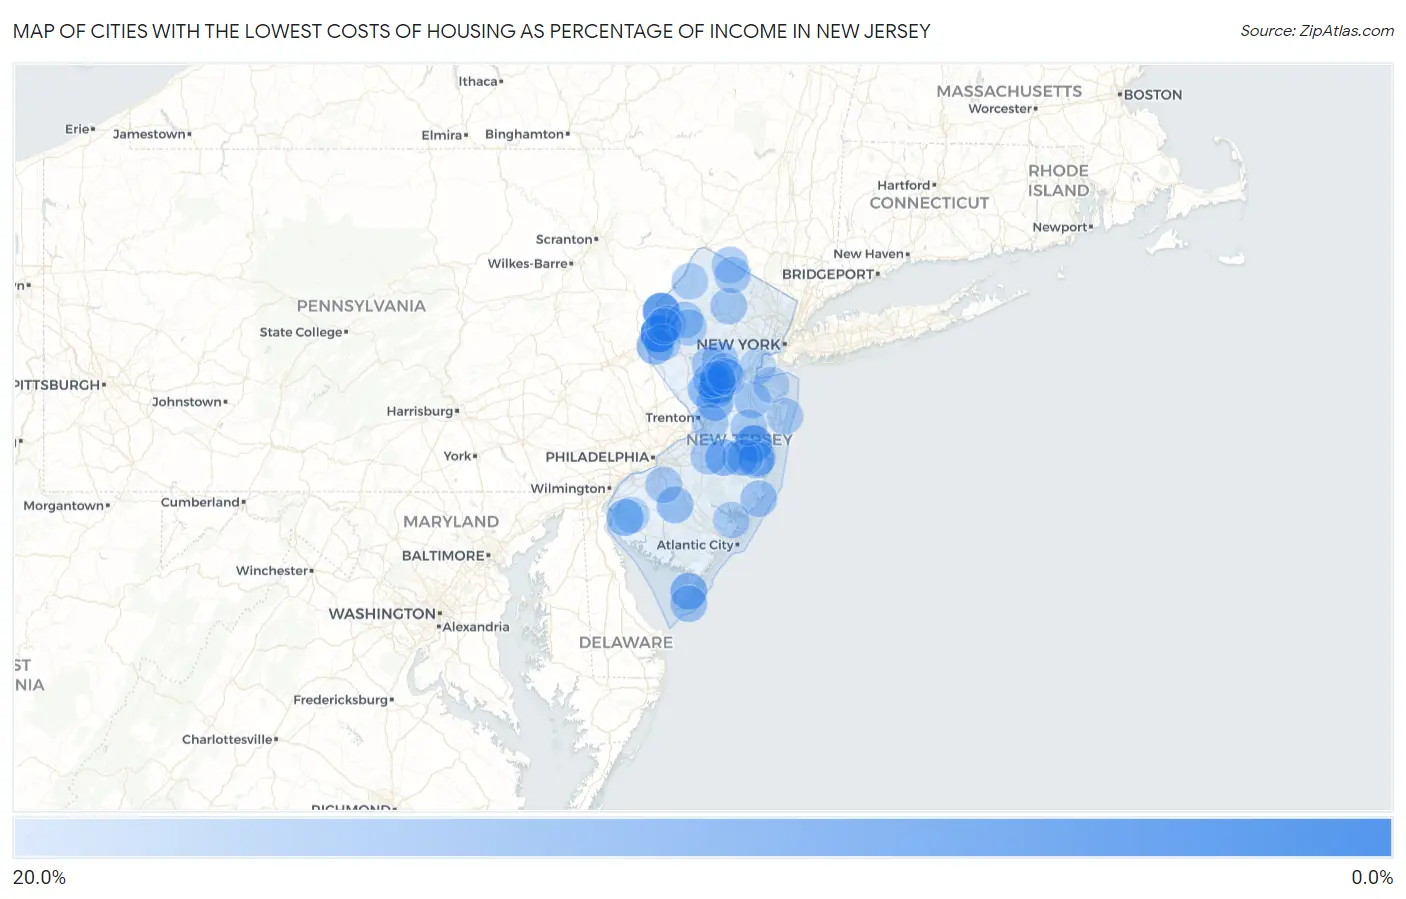
Map of Cities with the Lowest Costs of Housing as Percentage of Income in New Jersey
20.0%
0.0%
Cities with the Lowest Costs of Housing as Percentage of Income in New Jersey
| City | Housing Costs / Income | vs State | vs National | |
| 1. | Port Elizabeth | 6.0% | 22.5%(-16.4)#1 | 20.4%(-14.3)#169 |
| 2. | Hutchinson | 7.1% | 22.5%(-15.3)#2 | 20.4%(-13.2)#365 |
| 3. | Columbia | 9.7% | 22.5%(-12.7)#3 | 20.4%(-10.6)#1,253 |
| 4. | Marshallville | 9.8% | 22.5%(-12.7)#4 | 20.4%(-10.6)#1,305 |
| 5. | Neshanic | 10.1% | 22.5%(-12.4)#5 | 20.4%(-10.3)#1,463 |
| 6. | Griggstown | 10.3% | 22.5%(-12.2)#6 | 20.4%(-10.1)#1,571 |
| 7. | Cedar Glen West | 11.2% | 22.5%(-11.3)#7 | 20.4%(-9.20)#2,222 |
| 8. | Tuckahoe | 12.4% | 22.5%(-10.1)#8 | 20.4%(-8.02)#3,420 |
| 9. | South Seaville | 13.3% | 22.5%(-9.20)#9 | 20.4%(-7.11)#4,559 |
| 10. | Burleigh | 13.4% | 22.5%(-9.07)#10 | 20.4%(-6.98)#4,734 |
| 11. | Connecticut Farms | 13.4% | 22.5%(-9.02)#11 | 20.4%(-6.94)#4,802 |
| 12. | Quinton | 13.7% | 22.5%(-8.79)#12 | 20.4%(-6.70)#5,150 |
| 13. | Country Lake Estates | 13.8% | 22.5%(-8.71)#13 | 20.4%(-6.62)#5,287 |
| 14. | Cookstown | 13.8% | 22.5%(-8.64)#14 | 20.4%(-6.56)#5,388 |
| 15. | Renaissance At Monroe | 13.8% | 22.5%(-8.63)#15 | 20.4%(-6.54)#5,412 |
| 16. | Newfoundland | 14.0% | 22.5%(-8.44)#16 | 20.4%(-6.36)#5,697 |
| 17. | Roadstown | 14.1% | 22.5%(-8.39)#17 | 20.4%(-6.30)#5,798 |
| 18. | Titusville | 14.1% | 22.5%(-8.36)#18 | 20.4%(-6.28)#5,837 |
| 19. | Lopatcong Overlook | 14.2% | 22.5%(-8.29)#19 | 20.4%(-6.20)#5,982 |
| 20. | Mantoloking Borough | 14.2% | 22.5%(-8.26)#20 | 20.4%(-6.17)#6,039 |
| 21. | Princeton Junction | 14.4% | 22.5%(-8.09)#21 | 20.4%(-6.00)#6,323 |
| 22. | Blawenburg | 14.6% | 22.5%(-7.85)#22 | 20.4%(-5.76)#6,710 |
| 23. | Beesleys Point | 14.7% | 22.5%(-7.77)#23 | 20.4%(-5.68)#6,840 |
| 24. | Stonebridge | 14.7% | 22.5%(-7.75)#24 | 20.4%(-5.67)#6,868 |
| 25. | South Dennis | 14.8% | 22.5%(-7.68)#25 | 20.4%(-5.59)#7,008 |
| 26. | Gandys Beach | 14.8% | 22.5%(-7.67)#26 | 20.4%(-5.58)#7,032 |
| 27. | East Rocky Hill | 14.8% | 22.5%(-7.66)#27 | 20.4%(-5.58)#7,041 |
| 28. | Dividing Creek | 14.8% | 22.5%(-7.64)#28 | 20.4%(-5.55)#7,072 |
| 29. | Sea Girt Borough | 14.8% | 22.5%(-7.62)#29 | 20.4%(-5.54)#7,106 |
| 30. | Lyons | 14.9% | 22.5%(-7.54)#30 | 20.4%(-5.46)#7,251 |
| 31. | Forsgate | 15.0% | 22.5%(-7.47)#31 | 20.4%(-5.38)#7,376 |
| 32. | Shiloh Borough | 15.0% | 22.5%(-7.46)#32 | 20.4%(-5.38)#7,394 |
| 33. | Auburn | 15.0% | 22.5%(-7.43)#33 | 20.4%(-5.34)#7,469 |
| 34. | Leesburg | 15.0% | 22.5%(-7.43)#34 | 20.4%(-5.34)#7,470 |
| 35. | Holiday City South | 15.2% | 22.5%(-7.31)#35 | 20.4%(-5.22)#7,678 |
| 36. | Victory Lakes | 15.2% | 22.5%(-7.22)#36 | 20.4%(-5.14)#7,844 |
| 37. | Avalon Borough | 15.3% | 22.5%(-7.18)#37 | 20.4%(-5.10)#7,927 |
| 38. | Bridgeville | 15.4% | 22.5%(-7.03)#38 | 20.4%(-4.95)#8,198 |
| 39. | Holiday Heights | 15.4% | 22.5%(-7.02)#39 | 20.4%(-4.93)#8,229 |
| 40. | Millington | 15.5% | 22.5%(-7.01)#40 | 20.4%(-4.92)#8,259 |
| 41. | Diamond Beach | 15.5% | 22.5%(-6.98)#41 | 20.4%(-4.89)#8,327 |
| 42. | Englewood Cliffs Borough | 15.5% | 22.5%(-6.93)#42 | 20.4%(-4.84)#8,446 |
| 43. | Delmont | 15.6% | 22.5%(-6.89)#43 | 20.4%(-4.80)#8,513 |
| 44. | Chatham Borough | 15.6% | 22.5%(-6.84)#44 | 20.4%(-4.76)#8,601 |
| 45. | Basking Ridge | 15.7% | 22.5%(-6.76)#45 | 20.4%(-4.68)#8,756 |
| 46. | Lavallette Borough | 15.8% | 22.5%(-6.69)#46 | 20.4%(-4.61)#8,894 |
| 47. | Robertsville | 15.9% | 22.5%(-6.59)#47 | 20.4%(-4.51)#9,107 |
| 48. | Beach Haven West | 15.9% | 22.5%(-6.57)#48 | 20.4%(-4.48)#9,175 |
| 49. | Harvey Cedars Borough | 16.0% | 22.5%(-6.50)#49 | 20.4%(-4.41)#9,316 |
| 50. | Bradley Gardens | 16.0% | 22.5%(-6.45)#50 | 20.4%(-4.36)#9,410 |
| 51. | Hewitt | 16.2% | 22.5%(-6.28)#51 | 20.4%(-4.20)#9,781 |
| 52. | Vienna | 16.2% | 22.5%(-6.23)#52 | 20.4%(-4.15)#9,893 |
| 53. | Lake Telemark | 16.3% | 22.5%(-6.20)#53 | 20.4%(-4.11)#9,967 |
| 54. | Cedar Glen Lakes | 16.3% | 22.5%(-6.15)#54 | 20.4%(-4.06)#10,085 |
| 55. | Yardville | 16.3% | 22.5%(-6.14)#55 | 20.4%(-4.06)#10,089 |
| 56. | Vernon Valley | 16.3% | 22.5%(-6.11)#56 | 20.4%(-4.03)#10,158 |
| 57. | Clyde | 16.4% | 22.5%(-6.06)#57 | 20.4%(-3.97)#10,285 |
| 58. | Martinsville | 16.4% | 22.5%(-6.03)#58 | 20.4%(-3.94)#10,352 |
| 59. | Germania | 16.4% | 22.5%(-6.01)#59 | 20.4%(-3.93)#10,382 |
| 60. | Seeley | 16.5% | 22.5%(-5.96)#60 | 20.4%(-3.88)#10,480 |
| 61. | Pemberton Heights | 16.5% | 22.5%(-5.92)#61 | 20.4%(-3.84)#10,562 |
| 62. | Turnersville | 16.6% | 22.5%(-5.90)#62 | 20.4%(-3.82)#10,620 |
| 63. | Franklin Borough | 16.6% | 22.5%(-5.88)#63 | 20.4%(-3.79)#10,682 |
| 64. | Belle Mead | 16.6% | 22.5%(-5.82)#64 | 20.4%(-3.74)#10,826 |
| 65. | Interlaken Borough | 16.7% | 22.5%(-5.80)#65 | 20.4%(-3.71)#10,886 |
| 66. | Beattystown | 16.7% | 22.5%(-5.73)#66 | 20.4%(-3.65)#11,021 |
| 67. | Loch Arbour | 16.7% | 22.5%(-5.73)#67 | 20.4%(-3.64)#11,030 |
| 68. | Highland Lakes | 16.7% | 22.5%(-5.71)#68 | 20.4%(-3.63)#11,064 |
| 69. | Vista Center | 16.8% | 22.5%(-5.71)#69 | 20.4%(-3.62)#11,087 |
| 70. | New Village | 16.8% | 22.5%(-5.63)#70 | 20.4%(-3.55)#11,225 |
| 71. | Cape May Point Borough | 16.9% | 22.5%(-5.61)#71 | 20.4%(-3.52)#11,271 |
| 72. | Neshanic Station | 16.9% | 22.5%(-5.55)#72 | 20.4%(-3.46)#11,413 |
| 73. | Point Pleasant Beach Borough | 17.0% | 22.5%(-5.46)#73 | 20.4%(-3.38)#11,610 |
| 74. | Port Republic | 17.0% | 22.5%(-5.45)#74 | 20.4%(-3.37)#11,637 |
| 75. | Crandon Lakes | 17.0% | 22.5%(-5.45)#75 | 20.4%(-3.37)#11,638 |
| 76. | Newtonville | 17.0% | 22.5%(-5.45)#76 | 20.4%(-3.37)#11,640 |
| 77. | Robbinsville Center | 17.0% | 22.5%(-5.41)#77 | 20.4%(-3.33)#11,730 |
| 78. | Franklin Center | 17.1% | 22.5%(-5.38)#78 | 20.4%(-3.30)#11,795 |
| 79. | The Hills | 17.1% | 22.5%(-5.35)#79 | 20.4%(-3.27)#11,852 |
| 80. | Oceanville | 17.1% | 22.5%(-5.33)#80 | 20.4%(-3.25)#11,898 |
| 81. | Mount Tabor | 17.2% | 22.5%(-5.30)#81 | 20.4%(-3.21)#11,969 |
| 82. | Carlls Corner | 17.2% | 22.5%(-5.28)#82 | 20.4%(-3.19)#12,005 |
| 83. | Pennington Borough | 17.2% | 22.5%(-5.25)#83 | 20.4%(-3.17)#12,058 |
| 84. | Woodcliff Lake Borough | 17.3% | 22.5%(-5.21)#84 | 20.4%(-3.12)#12,161 |
| 85. | West Cape May Borough | 17.3% | 22.5%(-5.17)#85 | 20.4%(-3.08)#12,260 |
| 86. | Bridgewater Center | 17.3% | 22.5%(-5.14)#86 | 20.4%(-3.05)#12,321 |
| 87. | Folsom Borough | 17.3% | 22.5%(-5.12)#87 | 20.4%(-3.03)#12,369 |
| 88. | Belvidere | 17.4% | 22.5%(-5.09)#88 | 20.4%(-3.00)#12,437 |
| 89. | Bernardsville Borough | 17.4% | 22.5%(-5.04)#89 | 20.4%(-2.95)#12,545 |
| 90. | Alloway | 17.5% | 22.5%(-5.00)#90 | 20.4%(-2.91)#12,635 |
| 91. | Marmora | 17.5% | 22.5%(-4.96)#91 | 20.4%(-2.87)#12,727 |
| 92. | Port Reading | 17.5% | 22.5%(-4.95)#92 | 20.4%(-2.86)#12,747 |
| 93. | Spotswood Borough | 17.6% | 22.5%(-4.86)#93 | 20.4%(-2.78)#12,933 |
| 94. | Troy Hills | 17.7% | 22.5%(-4.81)#94 | 20.4%(-2.72)#13,057 |
| 95. | Crestwood Village | 17.7% | 22.5%(-4.79)#95 | 20.4%(-2.70)#13,092 |
| 96. | Middlebush | 17.7% | 22.5%(-4.79)#96 | 20.4%(-2.70)#13,093 |
| 97. | Blackwells Mills | 17.7% | 22.5%(-4.78)#97 | 20.4%(-2.70)#13,099 |
| 98. | Park Ridge Borough | 17.7% | 22.5%(-4.78)#98 | 20.4%(-2.69)#13,110 |
| 99. | Whippany | 17.7% | 22.5%(-4.74)#99 | 20.4%(-2.65)#13,207 |
| 100. | North Middletown | 17.7% | 22.5%(-4.72)#100 | 20.4%(-2.63)#13,246 |
Common Questions
What are the Top 10 Cities with the Lowest Costs of Housing as Percentage of Income in New Jersey?
Top 10 Cities with the Lowest Costs of Housing as Percentage of Income in New Jersey are:
#1
7.1%
#2
9.7%
#3
10.3%
#4
11.2%
#5
13.4%
#6
13.7%
#7
13.8%
#8
14.2%
#9
14.4%
#10
14.6%
What city has the Lowest Costs of Housing as Percentage of Income in New Jersey?
Hutchinson has the Lowest Costs of Housing as Percentage of Income in New Jersey with 7.1%.
What is the Average Housing Costs as Percentage of Income in the State of New Jersey?
Average Housing Costs as Percentage of Income in New Jersey is 22.5%.
What is the Average Housing Costs as Percentage of Income in the United States?
Average Housing Costs as Percentage of Income in the United States is 20.4%.