Cities with the Most Immigrants from Iraq in New Jersey
RELATED REPORTS & OPTIONS
Iraq
New Jersey
Compare Cities
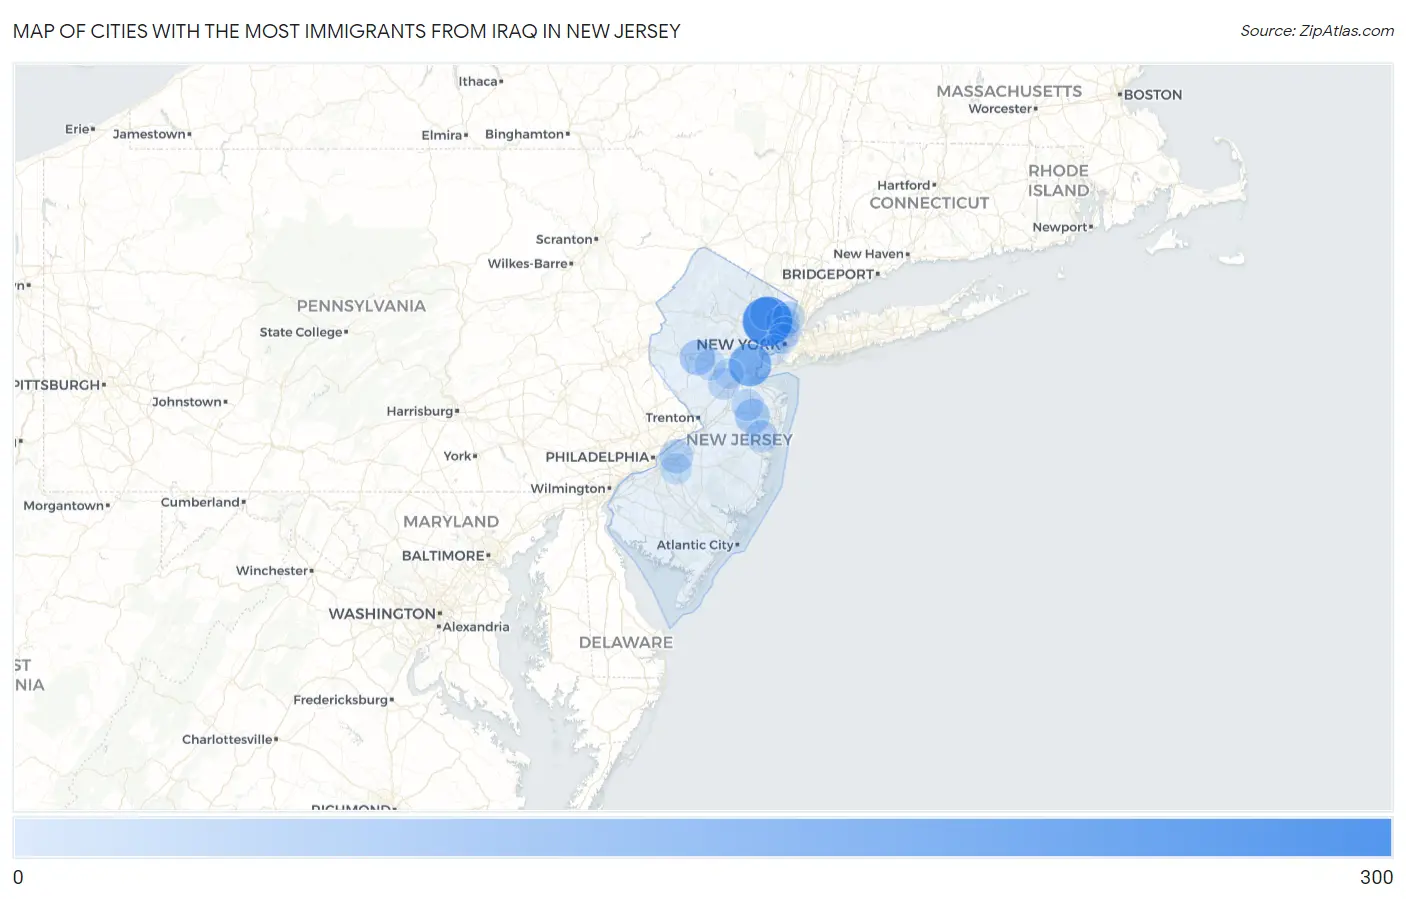
Map of Cities with the Most Immigrants from Iraq in New Jersey
0
300
Cities with the Most Immigrants from Iraq in New Jersey
| City | Iraq | vs State | vs National | |
| 1. | Clifton | 254 | 1,815(13.99%)#1 | 234,088(0.11%)#137 |
| 2. | Iselin | 161 | 1,815(8.87%)#2 | 234,088(0.07%)#206 |
| 3. | Woodland Park Borough | 90 | 1,815(4.96%)#3 | 234,088(0.04%)#322 |
| 4. | White House Station | 69 | 1,815(3.80%)#4 | 234,088(0.03%)#392 |
| 5. | West Freehold | 63 | 1,815(3.47%)#5 | 234,088(0.03%)#420 |
| 6. | Troy Hills | 57 | 1,815(3.14%)#6 | 234,088(0.02%)#456 |
| 7. | Moorestown Lenola | 48 | 1,815(2.64%)#7 | 234,088(0.02%)#520 |
| 8. | Ridgefield Park | 45 | 1,815(2.48%)#8 | 234,088(0.02%)#552 |
| 9. | Lindenwold Borough | 41 | 1,815(2.26%)#9 | 234,088(0.02%)#585 |
| 10. | Paterson | 39 | 1,815(2.15%)#10 | 234,088(0.02%)#595 |
| 11. | Bergenfield Borough | 35 | 1,815(1.93%)#11 | 234,088(0.01%)#632 |
| 12. | Rumson Borough | 33 | 1,815(1.82%)#12 | 234,088(0.01%)#657 |
| 13. | Lakewood | 28 | 1,815(1.54%)#13 | 234,088(0.01%)#699 |
| 14. | Englewood | 28 | 1,815(1.54%)#14 | 234,088(0.01%)#704 |
| 15. | Franklin Park | 26 | 1,815(1.43%)#15 | 234,088(0.01%)#732 |
| 16. | Paramus Borough | 25 | 1,815(1.38%)#16 | 234,088(0.01%)#741 |
| 17. | Yorketown | 25 | 1,815(1.38%)#17 | 234,088(0.01%)#748 |
| 18. | Fort Lee Borough | 22 | 1,815(1.21%)#18 | 234,088(0.01%)#791 |
| 19. | Closter Borough | 22 | 1,815(1.21%)#19 | 234,088(0.01%)#798 |
| 20. | Guttenberg | 21 | 1,815(1.16%)#20 | 234,088(0.01%)#815 |
| 21. | Northvale Borough | 20 | 1,815(1.10%)#21 | 234,088(0.01%)#836 |
| 22. | Springdale | 18 | 1,815(0.99%)#22 | 234,088(0.01%)#868 |
| 23. | Ridgefield Borough | 17 | 1,815(0.94%)#23 | 234,088(0.01%)#882 |
| 24. | Bradley Gardens | 15 | 1,815(0.83%)#24 | 234,088(0.01%)#919 |
| 25. | Lincoln Park Borough | 13 | 1,815(0.72%)#25 | 234,088(0.01%)#961 |
| 26. | Upper Saddle River Borough | 11 | 1,815(0.61%)#26 | 234,088(0.00%)#1,020 |
| 27. | Hillsborough | 10 | 1,815(0.55%)#27 | 234,088(0.00%)#1,041 |
| 28. | Leonia Borough | 10 | 1,815(0.55%)#28 | 234,088(0.00%)#1,049 |
| 29. | Spotswood Borough | 10 | 1,815(0.55%)#29 | 234,088(0.00%)#1,051 |
| 30. | Bayonne | 9 | 1,815(0.50%)#30 | 234,088(0.00%)#1,056 |
| 31. | Somerset | 9 | 1,815(0.50%)#31 | 234,088(0.00%)#1,066 |
| 32. | Hoboken | 8 | 1,815(0.44%)#32 | 234,088(0.00%)#1,093 |
| 33. | Menlo Park Terrace | 8 | 1,815(0.44%)#33 | 234,088(0.00%)#1,112 |
| 34. | Allendale Borough | 5 | 1,815(0.28%)#34 | 234,088(0.00%)#1,176 |
| 35. | Layton | 3 | 1,815(0.17%)#35 | 234,088(0.00%)#1,222 |
Common Questions
What are the Top 10 Cities with the Most Immigrants from Iraq in New Jersey?
Top 10 Cities with the Most Immigrants from Iraq in New Jersey are:
#1
254
#2
161
#3
69
#4
63
#5
48
#6
45
#7
39
#8
28
#9
28
#10
26
What city has the Most Immigrants from Iraq in New Jersey?
Clifton has the Most Immigrants from Iraq in New Jersey with 254.
What is the Total Immigrants from Iraq in the State of New Jersey?
Total Immigrants from Iraq in New Jersey is 1,815.
What is the Total Immigrants from Iraq in the United States?
Total Immigrants from Iraq in the United States is 234,088.