Cities with the Most Immigrants from Hungary in New Jersey
RELATED REPORTS & OPTIONS
Hungary
New Jersey
Compare Cities
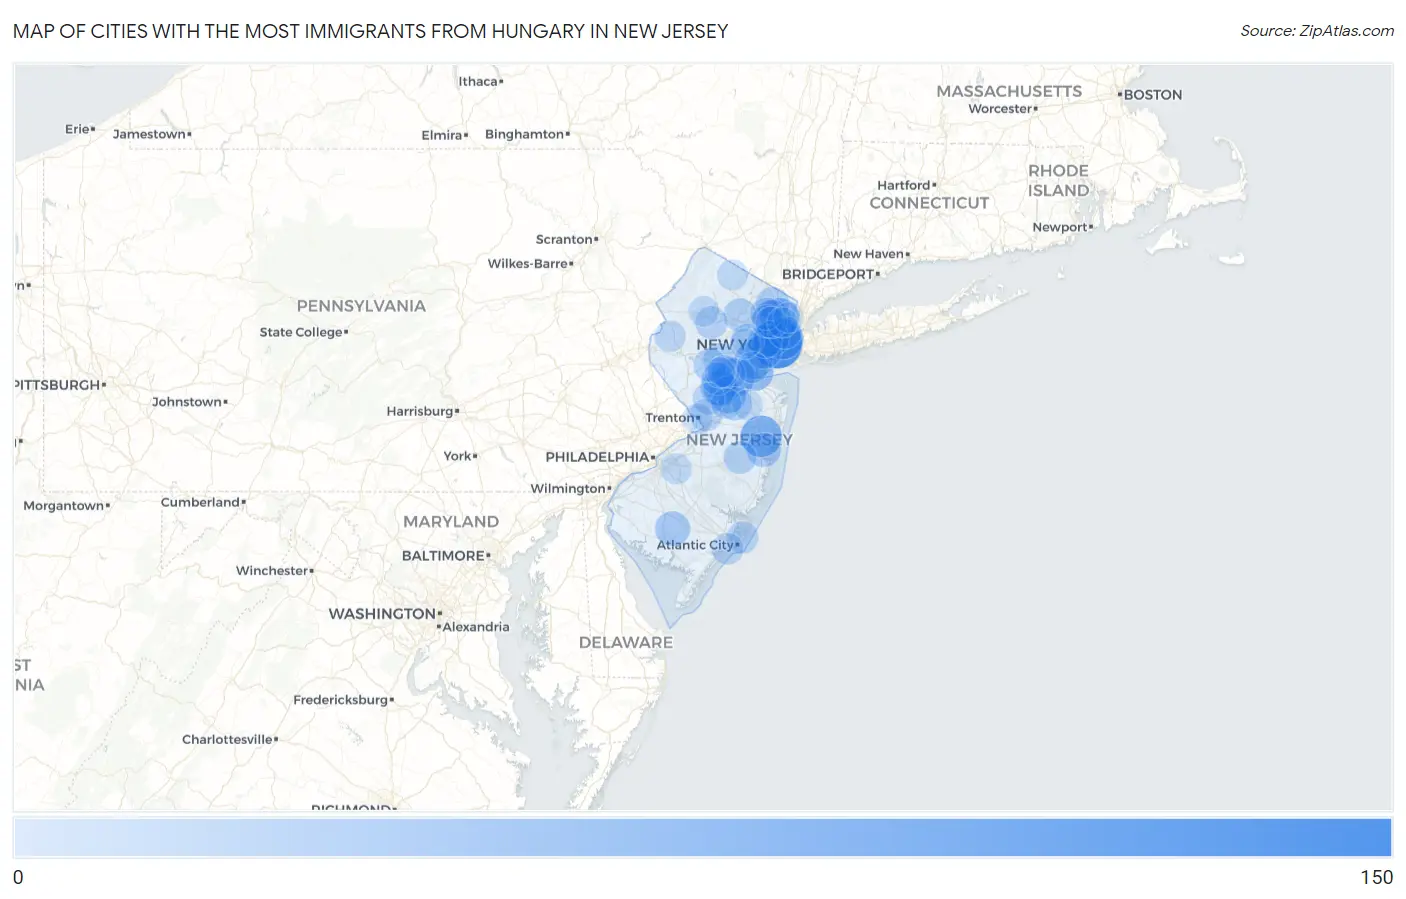
Map of Cities with the Most Immigrants from Hungary in New Jersey
0
150
Cities with the Most Immigrants from Hungary in New Jersey
| City | Hungary | vs State | vs National | |
| 1. | Jersey City | 147 | 4,659(3.16%)#1 | 64,894(0.23%)#35 |
| 2. | High Bridge Borough | 108 | 4,659(2.32%)#2 | 64,894(0.17%)#65 |
| 3. | Lakewood | 86 | 4,659(1.85%)#3 | 64,894(0.13%)#104 |
| 4. | Hoboken | 86 | 4,659(1.85%)#4 | 64,894(0.13%)#105 |
| 5. | Robbinsville Center | 86 | 4,659(1.85%)#5 | 64,894(0.13%)#108 |
| 6. | New Brunswick | 68 | 4,659(1.46%)#6 | 64,894(0.10%)#150 |
| 7. | Hackensack | 68 | 4,659(1.46%)#7 | 64,894(0.10%)#151 |
| 8. | Rahway | 61 | 4,659(1.31%)#8 | 64,894(0.09%)#171 |
| 9. | Garfield | 60 | 4,659(1.29%)#9 | 64,894(0.09%)#177 |
| 10. | Chatham Borough | 58 | 4,659(1.24%)#10 | 64,894(0.09%)#191 |
| 11. | Highland Park Borough | 56 | 4,659(1.20%)#11 | 64,894(0.09%)#200 |
| 12. | Ramsey Borough | 55 | 4,659(1.18%)#12 | 64,894(0.08%)#208 |
| 13. | Wallington Borough | 55 | 4,659(1.18%)#13 | 64,894(0.08%)#210 |
| 14. | Sayreville Borough | 54 | 4,659(1.16%)#14 | 64,894(0.08%)#216 |
| 15. | Perth Amboy | 53 | 4,659(1.14%)#15 | 64,894(0.08%)#222 |
| 16. | Dayton | 51 | 4,659(1.09%)#16 | 64,894(0.08%)#234 |
| 17. | Elmwood Park Borough | 50 | 4,659(1.07%)#17 | 64,894(0.08%)#237 |
| 18. | South River Borough | 50 | 4,659(1.07%)#18 | 64,894(0.08%)#239 |
| 19. | Ten Mile Run | 49 | 4,659(1.05%)#19 | 64,894(0.08%)#245 |
| 20. | Lake Hopatcong | 46 | 4,659(0.99%)#20 | 64,894(0.07%)#258 |
| 21. | Kearny | 44 | 4,659(0.94%)#21 | 64,894(0.07%)#273 |
| 22. | Kendall Park | 44 | 4,659(0.94%)#22 | 64,894(0.07%)#275 |
| 23. | Cresskill Borough | 44 | 4,659(0.94%)#23 | 64,894(0.07%)#276 |
| 24. | Hillsdale Borough | 42 | 4,659(0.90%)#24 | 64,894(0.06%)#292 |
| 25. | Elizabeth | 41 | 4,659(0.88%)#25 | 64,894(0.06%)#297 |
| 26. | Vineland | 40 | 4,659(0.86%)#26 | 64,894(0.06%)#306 |
| 27. | Haledon Borough | 40 | 4,659(0.86%)#27 | 64,894(0.06%)#311 |
| 28. | Pleasantdale | 39 | 4,659(0.84%)#28 | 64,894(0.06%)#323 |
| 29. | Milltown Borough | 37 | 4,659(0.79%)#29 | 64,894(0.06%)#346 |
| 30. | Toms River | 35 | 4,659(0.75%)#30 | 64,894(0.05%)#358 |
| 31. | Cliffside Park Borough | 35 | 4,659(0.75%)#31 | 64,894(0.05%)#362 |
| 32. | Netcong Borough | 34 | 4,659(0.73%)#32 | 64,894(0.05%)#383 |
| 33. | Glen Ridge Borough | 32 | 4,659(0.69%)#33 | 64,894(0.05%)#404 |
| 34. | Newark | 30 | 4,659(0.64%)#34 | 64,894(0.05%)#421 |
| 35. | Ridgewood | 30 | 4,659(0.64%)#35 | 64,894(0.05%)#431 |
| 36. | Somerset | 30 | 4,659(0.64%)#36 | 64,894(0.05%)#432 |
| 37. | Concordia | 30 | 4,659(0.64%)#37 | 64,894(0.05%)#435 |
| 38. | Martinsville | 29 | 4,659(0.62%)#38 | 64,894(0.04%)#446 |
| 39. | Lincoln Park Borough | 28 | 4,659(0.60%)#39 | 64,894(0.04%)#466 |
| 40. | Bradley Gardens | 27 | 4,659(0.58%)#40 | 64,894(0.04%)#481 |
| 41. | Boonton | 27 | 4,659(0.58%)#41 | 64,894(0.04%)#484 |
| 42. | Washington Borough | 25 | 4,659(0.54%)#42 | 64,894(0.04%)#525 |
| 43. | Cedar Glen Lakes | 25 | 4,659(0.54%)#43 | 64,894(0.04%)#530 |
| 44. | West New York | 24 | 4,659(0.52%)#44 | 64,894(0.04%)#536 |
| 45. | Short Hills | 24 | 4,659(0.52%)#45 | 64,894(0.04%)#542 |
| 46. | Emerson Borough | 24 | 4,659(0.52%)#46 | 64,894(0.04%)#548 |
| 47. | Succasunna | 23 | 4,659(0.49%)#47 | 64,894(0.04%)#566 |
| 48. | Clifton | 22 | 4,659(0.47%)#48 | 64,894(0.03%)#574 |
| 49. | Blackwells Mills | 22 | 4,659(0.47%)#49 | 64,894(0.03%)#591 |
| 50. | Paterson | 20 | 4,659(0.43%)#50 | 64,894(0.03%)#622 |
| 51. | Mercerville | 20 | 4,659(0.43%)#51 | 64,894(0.03%)#636 |
| 52. | Saddle River Borough | 20 | 4,659(0.43%)#52 | 64,894(0.03%)#645 |
| 53. | Bergenfield Borough | 19 | 4,659(0.41%)#53 | 64,894(0.03%)#656 |
| 54. | New Milford Borough | 19 | 4,659(0.41%)#54 | 64,894(0.03%)#660 |
| 55. | Wanaque Borough | 19 | 4,659(0.41%)#55 | 64,894(0.03%)#667 |
| 56. | Brigantine | 19 | 4,659(0.41%)#56 | 64,894(0.03%)#668 |
| 57. | Englewood Cliffs Borough | 19 | 4,659(0.41%)#57 | 64,894(0.03%)#671 |
| 58. | Cedar Knolls | 19 | 4,659(0.41%)#58 | 64,894(0.03%)#675 |
| 59. | Princeton | 18 | 4,659(0.39%)#59 | 64,894(0.03%)#690 |
| 60. | Franklin Center | 18 | 4,659(0.39%)#60 | 64,894(0.03%)#703 |
| 61. | Woodland Park Borough | 17 | 4,659(0.36%)#61 | 64,894(0.03%)#725 |
| 62. | Margate City | 17 | 4,659(0.36%)#62 | 64,894(0.03%)#731 |
| 63. | Morris Plains Borough | 16 | 4,659(0.34%)#63 | 64,894(0.02%)#764 |
| 64. | National Park Borough | 16 | 4,659(0.34%)#64 | 64,894(0.02%)#767 |
| 65. | Passaic | 15 | 4,659(0.32%)#65 | 64,894(0.02%)#775 |
| 66. | Woodbridge | 15 | 4,659(0.32%)#66 | 64,894(0.02%)#784 |
| 67. | Carteret Borough | 14 | 4,659(0.30%)#67 | 64,894(0.02%)#821 |
| 68. | Caldwell Borough | 14 | 4,659(0.30%)#68 | 64,894(0.02%)#833 |
| 69. | Brass Castle | 14 | 4,659(0.30%)#69 | 64,894(0.02%)#842 |
| 70. | Metuchen Borough | 13 | 4,659(0.28%)#70 | 64,894(0.02%)#866 |
| 71. | Edgewater Borough | 13 | 4,659(0.28%)#71 | 64,894(0.02%)#867 |
| 72. | Ringwood Borough | 13 | 4,659(0.28%)#72 | 64,894(0.02%)#868 |
| 73. | Mckee | 13 | 4,659(0.28%)#73 | 64,894(0.02%)#870 |
| 74. | Landing | 13 | 4,659(0.28%)#74 | 64,894(0.02%)#879 |
| 75. | Preakness | 12 | 4,659(0.26%)#75 | 64,894(0.02%)#911 |
| 76. | Springdale | 12 | 4,659(0.26%)#76 | 64,894(0.02%)#915 |
| 77. | Spotswood Borough | 12 | 4,659(0.26%)#77 | 64,894(0.02%)#923 |
| 78. | Bradley Beach Borough | 12 | 4,659(0.26%)#78 | 64,894(0.02%)#928 |
| 79. | Macopin | 12 | 4,659(0.26%)#79 | 64,894(0.02%)#929 |
| 80. | Cranford | 12 | 4,659(0.26%)#80 | 64,894(0.02%)#932 |
| 81. | Roselle Borough | 11 | 4,659(0.24%)#81 | 64,894(0.02%)#956 |
| 82. | Fair Lawn Borough | 10 | 4,659(0.21%)#82 | 64,894(0.02%)#1,000 |
| 83. | Little Ferry Borough | 10 | 4,659(0.21%)#83 | 64,894(0.02%)#1,019 |
| 84. | Highland Lakes | 10 | 4,659(0.21%)#84 | 64,894(0.02%)#1,036 |
| 85. | Byram Center | 10 | 4,659(0.21%)#85 | 64,894(0.02%)#1,043 |
| 86. | Trenton | 9 | 4,659(0.19%)#86 | 64,894(0.01%)#1,055 |
| 87. | Englewood | 9 | 4,659(0.19%)#87 | 64,894(0.01%)#1,070 |
| 88. | Manville Borough | 9 | 4,659(0.19%)#88 | 64,894(0.01%)#1,089 |
| 89. | Closter Borough | 9 | 4,659(0.19%)#89 | 64,894(0.01%)#1,091 |
| 90. | Yorketown | 9 | 4,659(0.19%)#90 | 64,894(0.01%)#1,094 |
| 91. | Summit | 8 | 4,659(0.17%)#91 | 64,894(0.01%)#1,134 |
| 92. | Glen Rock Borough | 8 | 4,659(0.17%)#92 | 64,894(0.01%)#1,148 |
| 93. | Pompton Lakes Borough | 8 | 4,659(0.17%)#93 | 64,894(0.01%)#1,150 |
| 94. | Atlantic Highlands Borough | 8 | 4,659(0.17%)#94 | 64,894(0.01%)#1,168 |
| 95. | Cranbury | 8 | 4,659(0.17%)#95 | 64,894(0.01%)#1,174 |
| 96. | Weston | 7 | 4,659(0.15%)#96 | 64,894(0.01%)#1,247 |
| 97. | Tinton Falls Borough | 6 | 4,659(0.13%)#97 | 64,894(0.01%)#1,273 |
| 98. | Ridgefield Park | 6 | 4,659(0.13%)#98 | 64,894(0.01%)#1,278 |
| 99. | Old Tappan Borough | 6 | 4,659(0.13%)#99 | 64,894(0.01%)#1,290 |
| 100. | Paramus Borough | 5 | 4,659(0.11%)#100 | 64,894(0.01%)#1,327 |
Common Questions
What are the Top 10 Cities with the Most Immigrants from Hungary in New Jersey?
Top 10 Cities with the Most Immigrants from Hungary in New Jersey are:
#1
147
#2
86
#3
86
#4
68
#5
68
#6
61
#7
60
#8
53
#9
51
#10
49
What city has the Most Immigrants from Hungary in New Jersey?
Jersey City has the Most Immigrants from Hungary in New Jersey with 147.
What is the Total Immigrants from Hungary in the State of New Jersey?
Total Immigrants from Hungary in New Jersey is 4,659.
What is the Total Immigrants from Hungary in the United States?
Total Immigrants from Hungary in the United States is 64,894.