Cities with the Highest Percentage of Not-for-profit Organizations in New Jersey
RELATED REPORTS & OPTIONS
Not-for-profit Organizations
New Jersey
Compare Cities
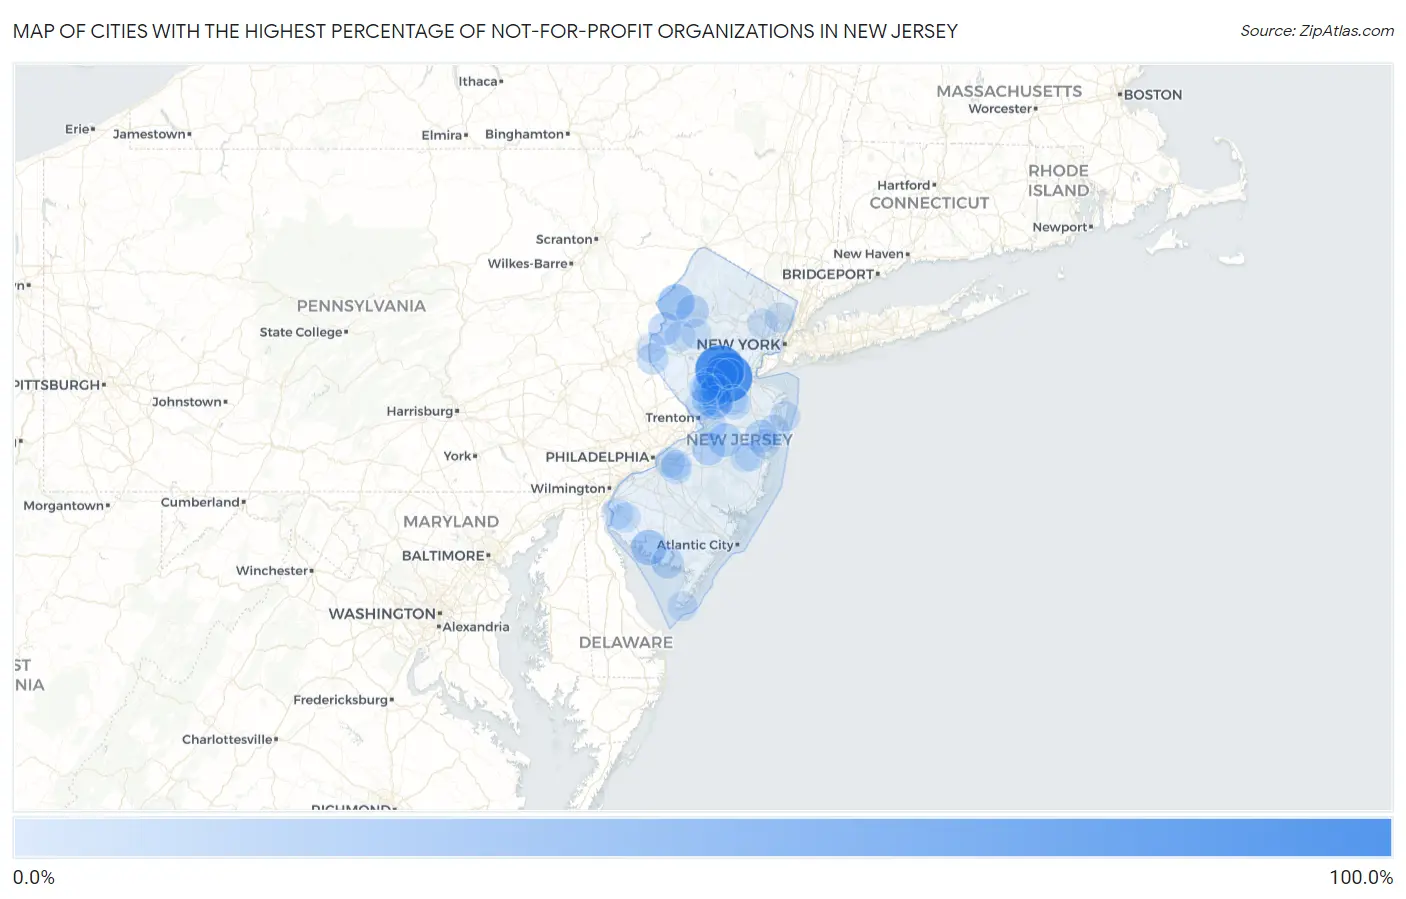
Map of Cities with the Highest Percentage of Not-for-profit Organizations in New Jersey
0.0%
100.0%
Cities with the Highest Percentage of Not-for-profit Organizations in New Jersey
| City | % Employed in Not-for-profit | vs State | vs National | |
| 1. | Clyde | 100.0% | 7.4%(+92.6)#1 | 8.4%(+91.6)#15 |
| 2. | Zarephath | 100.0% | 7.4%(+92.6)#2 | 8.4%(+91.6)#16 |
| 3. | Money Island | 100.0% | 7.4%(+92.6)#3 | 8.4%(+91.6)#41 |
| 4. | Rutgers University-Busch Campus | 57.1% | 7.4%(+49.7)#4 | 8.4%(+48.7)#123 |
| 5. | Rutgers University-Livingston Campus | 55.8% | 7.4%(+48.4)#5 | 8.4%(+47.4)#127 |
| 6. | Blairstown | 39.5% | 7.4%(+32.1)#6 | 8.4%(+31.1)#297 |
| 7. | Cedarville | 35.2% | 7.4%(+27.8)#7 | 8.4%(+26.7)#388 |
| 8. | Kingston | 31.7% | 7.4%(+24.3)#8 | 8.4%(+23.3)#510 |
| 9. | Princeton Junction | 29.6% | 7.4%(+22.2)#9 | 8.4%(+21.2)#601 |
| 10. | Newtonville | 29.1% | 7.4%(+21.7)#10 | 8.4%(+20.7)#627 |
| 11. | New Egypt | 27.7% | 7.4%(+20.3)#11 | 8.4%(+19.3)#700 |
| 12. | New Gretna | 27.2% | 7.4%(+19.8)#12 | 8.4%(+18.7)#736 |
| 13. | Princeton | 27.1% | 7.4%(+19.7)#13 | 8.4%(+18.6)#744 |
| 14. | Regency At Monroe | 27.0% | 7.4%(+19.6)#14 | 8.4%(+18.6)#745 |
| 15. | Dorothy | 26.6% | 7.4%(+19.2)#15 | 8.4%(+18.2)#775 |
| 16. | Juliustown | 25.8% | 7.4%(+18.4)#16 | 8.4%(+17.4)#827 |
| 17. | Brookfield | 25.3% | 7.4%(+17.8)#17 | 8.4%(+16.8)#866 |
| 18. | Goshen | 24.6% | 7.4%(+17.2)#18 | 8.4%(+16.2)#930 |
| 19. | Allamuchy | 23.8% | 7.4%(+16.4)#19 | 8.4%(+15.4)#1,018 |
| 20. | Lakewood | 23.0% | 7.4%(+15.6)#20 | 8.4%(+14.6)#1,100 |
| 21. | Harlingen | 21.8% | 7.4%(+14.3)#21 | 8.4%(+13.3)#1,257 |
| 22. | Connecticut Farms | 21.6% | 7.4%(+14.2)#22 | 8.4%(+13.2)#1,281 |
| 23. | Rocky Hill Borough | 21.1% | 7.4%(+13.7)#23 | 8.4%(+12.7)#1,357 |
| 24. | Lamington | 20.9% | 7.4%(+13.5)#24 | 8.4%(+12.5)#1,389 |
| 25. | Port Norris | 20.8% | 7.4%(+13.3)#25 | 8.4%(+12.3)#1,423 |
| 26. | East Millstone | 20.1% | 7.4%(+12.7)#26 | 8.4%(+11.7)#1,519 |
| 27. | The College Of New Jersey | 20.0% | 7.4%(+12.5)#27 | 8.4%(+11.5)#1,578 |
| 28. | Concordia | 18.3% | 7.4%(+10.9)#28 | 8.4%(+9.85)#1,949 |
| 29. | Sheppards Mill | 18.2% | 7.4%(+10.8)#29 | 8.4%(+9.74)#1,981 |
| 30. | Pennington Borough | 18.1% | 7.4%(+10.7)#30 | 8.4%(+9.64)#2,020 |
| 31. | Plainsboro Center | 18.1% | 7.4%(+10.6)#31 | 8.4%(+9.61)#2,025 |
| 32. | Finesville | 18.0% | 7.4%(+10.6)#32 | 8.4%(+9.54)#2,049 |
| 33. | Tuckahoe | 17.9% | 7.4%(+10.5)#33 | 8.4%(+9.50)#2,063 |
| 34. | Hopewell Borough | 17.9% | 7.4%(+10.5)#34 | 8.4%(+9.48)#2,072 |
| 35. | Cape May Point Borough | 17.4% | 7.4%(+9.98)#35 | 8.4%(+8.95)#2,237 |
| 36. | Pleasantdale | 17.3% | 7.4%(+9.92)#36 | 8.4%(+8.88)#2,263 |
| 37. | Montclair State University | 17.2% | 7.4%(+9.82)#37 | 8.4%(+8.78)#2,286 |
| 38. | Woodbine Borough | 17.0% | 7.4%(+9.58)#38 | 8.4%(+8.55)#2,366 |
| 39. | Springdale | 16.8% | 7.4%(+9.39)#39 | 8.4%(+8.36)#2,431 |
| 40. | Lawrenceville | 16.4% | 7.4%(+9.00)#40 | 8.4%(+7.97)#2,587 |
| 41. | Thorofare | 16.3% | 7.4%(+8.94)#41 | 8.4%(+7.90)#2,619 |
| 42. | South Seaville | 16.1% | 7.4%(+8.72)#42 | 8.4%(+7.68)#2,721 |
| 43. | Beach Haven Borough | 16.1% | 7.4%(+8.65)#43 | 8.4%(+7.62)#2,751 |
| 44. | Springfield | 15.9% | 7.4%(+8.54)#44 | 8.4%(+7.50)#2,815 |
| 45. | East Rocky Hill | 15.9% | 7.4%(+8.47)#45 | 8.4%(+7.44)#2,845 |
| 46. | Deal Borough | 15.8% | 7.4%(+8.40)#46 | 8.4%(+7.36)#2,880 |
| 47. | Beesleys Point | 15.2% | 7.4%(+7.83)#47 | 8.4%(+6.80)#3,179 |
| 48. | Salem | 15.1% | 7.4%(+7.73)#48 | 8.4%(+6.69)#3,242 |
| 49. | Ramapo College Of New Jersey | 15.0% | 7.4%(+7.61)#49 | 8.4%(+6.57)#3,316 |
| 50. | Groveville | 15.0% | 7.4%(+7.56)#50 | 8.4%(+6.52)#3,351 |
| 51. | Midland Park Borough | 14.9% | 7.4%(+7.48)#51 | 8.4%(+6.45)#3,391 |
| 52. | Pottersville | 14.9% | 7.4%(+7.47)#52 | 8.4%(+6.44)#3,397 |
| 53. | Kean University | 14.6% | 7.4%(+7.19)#53 | 8.4%(+6.15)#3,588 |
| 54. | Anderson | 14.4% | 7.4%(+7.02)#54 | 8.4%(+5.99)#3,696 |
| 55. | Allenhurst Borough | 14.2% | 7.4%(+6.81)#55 | 8.4%(+5.78)#3,870 |
| 56. | Woodstown Borough | 14.1% | 7.4%(+6.73)#56 | 8.4%(+5.70)#3,914 |
| 57. | Blawenburg | 14.1% | 7.4%(+6.73)#57 | 8.4%(+5.70)#3,918 |
| 58. | Barrington Borough | 14.1% | 7.4%(+6.67)#58 | 8.4%(+5.64)#3,959 |
| 59. | Bedminster | 14.0% | 7.4%(+6.63)#59 | 8.4%(+5.60)#3,989 |
| 60. | Bargaintown | 13.8% | 7.4%(+6.38)#60 | 8.4%(+5.35)#4,167 |
| 61. | Morris Plains Borough | 13.8% | 7.4%(+6.35)#61 | 8.4%(+5.31)#4,185 |
| 62. | Allenwood | 13.7% | 7.4%(+6.32)#62 | 8.4%(+5.29)#4,205 |
| 63. | Loch Arbour | 13.7% | 7.4%(+6.27)#63 | 8.4%(+5.24)#4,239 |
| 64. | Brielle Borough | 13.5% | 7.4%(+6.12)#64 | 8.4%(+5.09)#4,366 |
| 65. | Interlaken Borough | 13.5% | 7.4%(+6.06)#65 | 8.4%(+5.03)#4,406 |
| 66. | Seaville | 13.3% | 7.4%(+5.94)#66 | 8.4%(+4.90)#4,499 |
| 67. | Quinton | 13.3% | 7.4%(+5.90)#67 | 8.4%(+4.86)#4,543 |
| 68. | Highland Park Borough | 13.3% | 7.4%(+5.84)#68 | 8.4%(+4.81)#4,585 |
| 69. | Ellisburg | 13.2% | 7.4%(+5.79)#69 | 8.4%(+4.75)#4,621 |
| 70. | Haddonfield Borough | 13.1% | 7.4%(+5.69)#70 | 8.4%(+4.66)#4,691 |
| 71. | Closter Borough | 13.1% | 7.4%(+5.69)#71 | 8.4%(+4.65)#4,697 |
| 72. | Cream Ridge | 13.1% | 7.4%(+5.65)#72 | 8.4%(+4.62)#4,723 |
| 73. | Saddle River Borough | 13.0% | 7.4%(+5.55)#73 | 8.4%(+4.51)#4,815 |
| 74. | Llewellyn Park | 12.9% | 7.4%(+5.52)#74 | 8.4%(+4.48)#4,848 |
| 75. | Upper Montclair | 12.8% | 7.4%(+5.36)#75 | 8.4%(+4.32)#5,014 |
| 76. | Cape May | 12.8% | 7.4%(+5.34)#76 | 8.4%(+4.31)#5,031 |
| 77. | Tenafly Borough | 12.6% | 7.4%(+5.14)#77 | 8.4%(+4.11)#5,204 |
| 78. | Stockton University | 12.4% | 7.4%(+5.03)#78 | 8.4%(+3.99)#5,333 |
| 79. | Rossmoor | 12.4% | 7.4%(+4.97)#79 | 8.4%(+3.94)#5,390 |
| 80. | Long Valley | 12.2% | 7.4%(+4.76)#80 | 8.4%(+3.72)#5,614 |
| 81. | Somerville Borough | 12.2% | 7.4%(+4.75)#81 | 8.4%(+3.72)#5,629 |
| 82. | Skillman | 12.2% | 7.4%(+4.74)#82 | 8.4%(+3.71)#5,637 |
| 83. | Phillipsburg | 12.2% | 7.4%(+4.74)#83 | 8.4%(+3.71)#5,638 |
| 84. | Collingswood Borough | 12.1% | 7.4%(+4.65)#84 | 8.4%(+3.62)#5,722 |
| 85. | Rockleigh Borough | 11.9% | 7.4%(+4.45)#85 | 8.4%(+3.42)#5,928 |
| 86. | Pitman Borough | 11.8% | 7.4%(+4.44)#86 | 8.4%(+3.40)#5,946 |
| 87. | Wenonah Borough | 11.8% | 7.4%(+4.37)#87 | 8.4%(+3.34)#6,006 |
| 88. | Crestwood Village | 11.6% | 7.4%(+4.24)#88 | 8.4%(+3.20)#6,165 |
| 89. | Grenloch | 11.6% | 7.4%(+4.22)#89 | 8.4%(+3.18)#6,188 |
| 90. | Mendham Borough | 11.6% | 7.4%(+4.19)#90 | 8.4%(+3.15)#6,233 |
| 91. | Riverdale Borough | 11.6% | 7.4%(+4.17)#91 | 8.4%(+3.14)#6,252 |
| 92. | Alpine Borough | 11.6% | 7.4%(+4.15)#92 | 8.4%(+3.11)#6,282 |
| 93. | Caldwell Borough | 11.6% | 7.4%(+4.14)#93 | 8.4%(+3.11)#6,290 |
| 94. | Riverton Borough | 11.5% | 7.4%(+4.12)#94 | 8.4%(+3.08)#6,326 |
| 95. | Greentree | 11.5% | 7.4%(+4.11)#95 | 8.4%(+3.08)#6,330 |
| 96. | Pine Ridge At Crestwood | 11.4% | 7.4%(+4.02)#96 | 8.4%(+2.98)#6,438 |
| 97. | Somerset | 11.4% | 7.4%(+3.98)#97 | 8.4%(+2.95)#6,483 |
| 98. | Leisure Village | 11.3% | 7.4%(+3.93)#98 | 8.4%(+2.89)#6,550 |
| 99. | Highlands Borough | 11.3% | 7.4%(+3.90)#99 | 8.4%(+2.87)#6,575 |
| 100. | Hackensack | 11.3% | 7.4%(+3.87)#100 | 8.4%(+2.84)#6,618 |
Common Questions
What are the Top 10 Cities with the Highest Percentage of Not-for-profit Organizations in New Jersey?
Top 10 Cities with the Highest Percentage of Not-for-profit Organizations in New Jersey are:
#1
100.0%
#2
100.0%
#3
39.5%
#4
35.2%
#5
31.7%
#6
29.6%
#7
27.7%
#8
27.1%
#9
25.8%
#10
25.3%
What city has the Highest Percentage of Not-for-profit Organizations in New Jersey?
Clyde has the Highest Percentage of Not-for-profit Organizations in New Jersey with 100.0%.
What is the Percentage of Not-for-profit Organizations in the State of New Jersey?
Percentage of Not-for-profit Organizations in New Jersey is 7.4%.
What is the Percentage of Not-for-profit Organizations in the United States?
Percentage of Not-for-profit Organizations in the United States is 8.4%.