Cities with the Highest Percentage of Immigrants from Portugal in New Jersey
RELATED REPORTS & OPTIONS
Portugal
New Jersey
Compare Cities
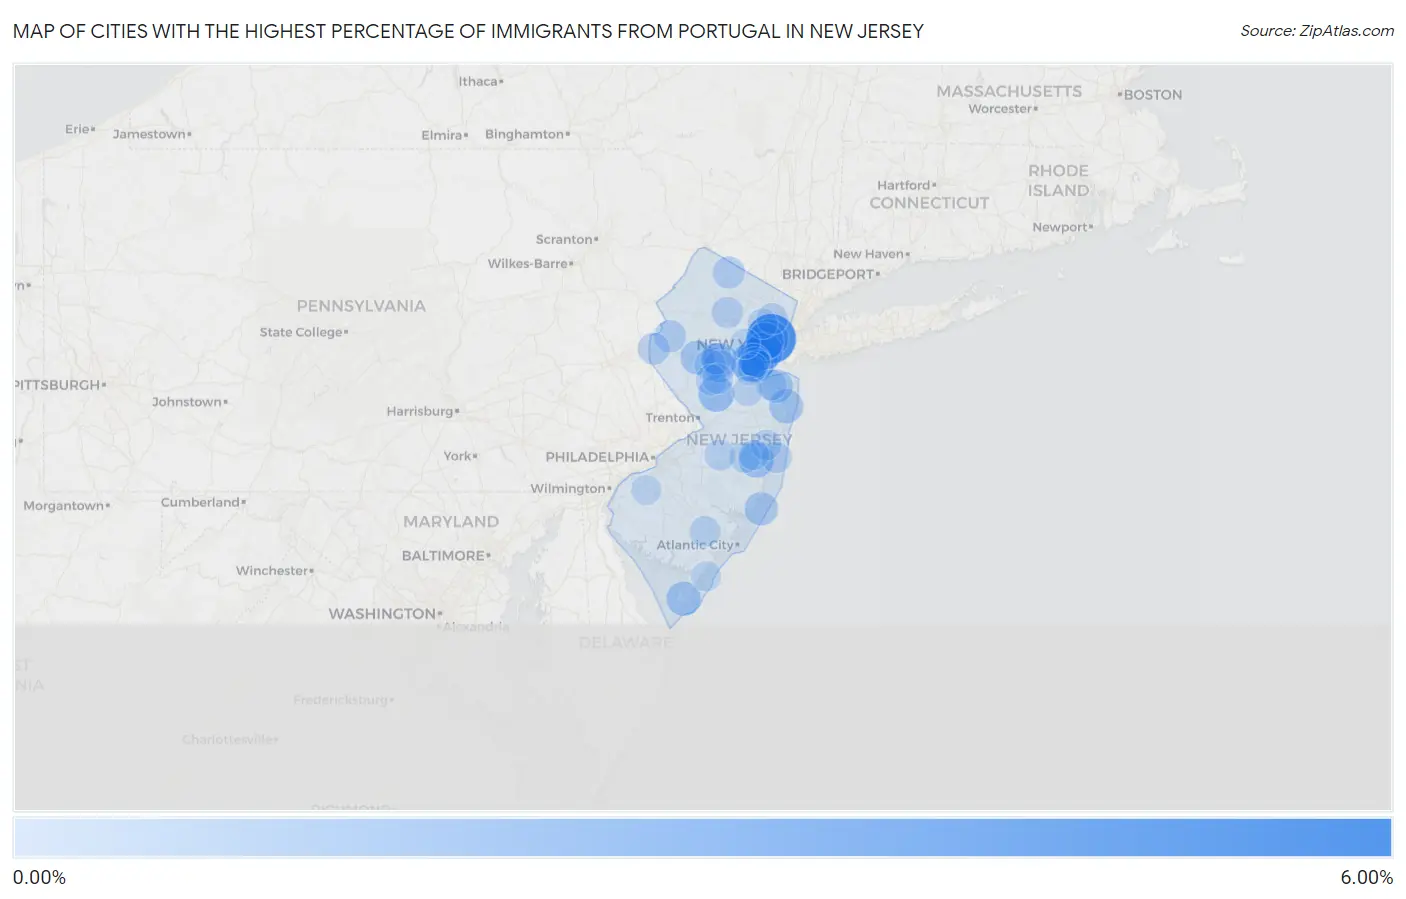
Map of Cities with the Highest Percentage of Immigrants from Portugal in New Jersey
0.00%
6.00%
Cities with the Highest Percentage of Immigrants from Portugal in New Jersey
| City | Portugal | vs State | vs National | |
| 1. | Kearny | 5.17% | 0.31%(+4.85)#1 | 0.051%(+5.11)#20 |
| 2. | North Arlington Borough | 4.20% | 0.31%(+3.89)#2 | 0.051%(+4.15)#24 |
| 3. | South River Borough | 4.12% | 0.31%(+3.81)#3 | 0.051%(+4.07)#26 |
| 4. | Springfield | 2.94% | 0.31%(+2.63)#4 | 0.051%(+2.89)#35 |
| 5. | Linden | 2.91% | 0.31%(+2.60)#5 | 0.051%(+2.86)#36 |
| 6. | Harrison | 2.51% | 0.31%(+2.20)#6 | 0.051%(+2.46)#44 |
| 7. | Colonia | 2.20% | 0.31%(+1.89)#7 | 0.051%(+2.15)#54 |
| 8. | Elizabeth | 2.19% | 0.31%(+1.88)#8 | 0.051%(+2.14)#55 |
| 9. | Newark | 2.04% | 0.31%(+1.73)#9 | 0.051%(+1.99)#61 |
| 10. | East Newark Borough | 1.73% | 0.31%(+1.42)#10 | 0.051%(+1.68)#70 |
| 11. | Kingston | 1.71% | 0.31%(+1.39)#11 | 0.051%(+1.66)#71 |
| 12. | Holiday Heights | 1.51% | 0.31%(+1.20)#12 | 0.051%(+1.46)#82 |
| 13. | Lodi Borough | 1.48% | 0.31%(+1.17)#13 | 0.051%(+1.43)#83 |
| 14. | Flanders | 1.43% | 0.31%(+1.12)#14 | 0.051%(+1.38)#85 |
| 15. | Union | 1.38% | 0.31%(+1.07)#15 | 0.051%(+1.33)#90 |
| 16. | Martinsville | 1.37% | 0.31%(+1.06)#16 | 0.051%(+1.32)#91 |
| 17. | Erma | 1.30% | 0.31%(+0.989)#17 | 0.051%(+1.25)#99 |
| 18. | Gillette | 1.21% | 0.31%(+0.903)#18 | 0.051%(+1.16)#104 |
| 19. | White House Station | 1.21% | 0.31%(+0.902)#19 | 0.051%(+1.16)#105 |
| 20. | Long Branch | 1.19% | 0.31%(+0.875)#20 | 0.051%(+1.14)#109 |
| 21. | Belford | 1.09% | 0.31%(+0.773)#21 | 0.051%(+1.03)#118 |
| 22. | North Beach Haven | 1.07% | 0.31%(+0.755)#22 | 0.051%(+1.02)#122 |
| 23. | Towaco | 1.06% | 0.31%(+0.750)#23 | 0.051%(+1.01)#123 |
| 24. | Menlo Park Terrace | 0.99% | 0.31%(+0.682)#24 | 0.051%(+0.943)#130 |
| 25. | Sayreville Borough | 0.99% | 0.31%(+0.676)#25 | 0.051%(+0.937)#133 |
| 26. | Cranford | 0.98% | 0.31%(+0.672)#26 | 0.051%(+0.933)#134 |
| 27. | Carteret Borough | 0.91% | 0.31%(+0.602)#27 | 0.051%(+0.863)#143 |
| 28. | Avon By The Sea Borough | 0.89% | 0.31%(+0.581)#28 | 0.051%(+0.842)#146 |
| 29. | Seaside Park Borough | 0.89% | 0.31%(+0.577)#29 | 0.051%(+0.838)#148 |
| 30. | Mountainside Borough | 0.89% | 0.31%(+0.575)#30 | 0.051%(+0.836)#149 |
| 31. | Keasbey | 0.87% | 0.31%(+0.562)#31 | 0.051%(+0.823)#153 |
| 32. | Rahway | 0.82% | 0.31%(+0.504)#32 | 0.051%(+0.765)#158 |
| 33. | Chesilhurst Borough | 0.79% | 0.31%(+0.483)#33 | 0.051%(+0.744)#161 |
| 34. | Hopelawn | 0.79% | 0.31%(+0.478)#34 | 0.051%(+0.739)#163 |
| 35. | Troy Hills | 0.75% | 0.31%(+0.437)#35 | 0.051%(+0.698)#170 |
| 36. | Brass Castle | 0.75% | 0.31%(+0.436)#36 | 0.051%(+0.697)#171 |
| 37. | Vernon Center | 0.74% | 0.31%(+0.425)#37 | 0.051%(+0.686)#178 |
| 38. | Port Reading | 0.72% | 0.31%(+0.406)#38 | 0.051%(+0.667)#181 |
| 39. | Ampere North | 0.72% | 0.31%(+0.404)#39 | 0.051%(+0.665)#183 |
| 40. | Finderne | 0.71% | 0.31%(+0.402)#40 | 0.051%(+0.663)#185 |
| 41. | Eatontown Borough | 0.71% | 0.31%(+0.398)#41 | 0.051%(+0.659)#188 |
| 42. | Jamesburg Borough | 0.71% | 0.31%(+0.397)#42 | 0.051%(+0.658)#189 |
| 43. | Upper Pohatcong | 0.68% | 0.31%(+0.365)#43 | 0.051%(+0.626)#197 |
| 44. | Lake Hopatcong | 0.64% | 0.31%(+0.327)#44 | 0.051%(+0.588)#207 |
| 45. | Bradley Gardens | 0.60% | 0.31%(+0.287)#45 | 0.051%(+0.548)#216 |
| 46. | Brielle Borough | 0.59% | 0.31%(+0.273)#46 | 0.051%(+0.534)#221 |
| 47. | White Meadow Lake | 0.55% | 0.31%(+0.241)#47 | 0.051%(+0.502)#236 |
| 48. | Bound Brook Borough | 0.55% | 0.31%(+0.234)#48 | 0.051%(+0.495)#237 |
| 49. | Landing | 0.54% | 0.31%(+0.229)#49 | 0.051%(+0.490)#241 |
| 50. | Garfield | 0.53% | 0.31%(+0.218)#50 | 0.051%(+0.479)#246 |
| 51. | Green Knoll | 0.53% | 0.31%(+0.215)#51 | 0.051%(+0.476)#248 |
| 52. | Garwood Borough | 0.51% | 0.31%(+0.194)#52 | 0.051%(+0.455)#256 |
| 53. | Hightstown Borough | 0.49% | 0.31%(+0.182)#53 | 0.051%(+0.443)#266 |
| 54. | Stanhope Borough | 0.48% | 0.31%(+0.169)#54 | 0.051%(+0.430)#272 |
| 55. | Dover Beaches South | 0.47% | 0.31%(+0.163)#55 | 0.051%(+0.424)#273 |
| 56. | Crestwood Village | 0.47% | 0.31%(+0.160)#56 | 0.051%(+0.421)#276 |
| 57. | Belle Mead | 0.46% | 0.31%(+0.148)#57 | 0.051%(+0.409)#281 |
| 58. | Kenilworth Borough | 0.44% | 0.31%(+0.131)#58 | 0.051%(+0.392)#290 |
| 59. | Belmar Borough | 0.44% | 0.31%(+0.130)#59 | 0.051%(+0.391)#292 |
| 60. | Browns Mills | 0.44% | 0.31%(+0.125)#60 | 0.051%(+0.386)#293 |
| 61. | Mays Landing | 0.44% | 0.31%(+0.125)#61 | 0.051%(+0.386)#295 |
| 62. | Bedminster | 0.43% | 0.31%(+0.121)#62 | 0.051%(+0.382)#297 |
| 63. | Watchung Borough | 0.42% | 0.31%(+0.109)#63 | 0.051%(+0.370)#306 |
| 64. | Cliffside Park Borough | 0.42% | 0.31%(+0.107)#64 | 0.051%(+0.368)#308 |
| 65. | Harvey Cedars Borough | 0.42% | 0.31%(+0.105)#65 | 0.051%(+0.366)#309 |
| 66. | Vauxhall | 0.41% | 0.31%(+0.101)#66 | 0.051%(+0.362)#311 |
| 67. | North Middletown | 0.41% | 0.31%(+0.100)#67 | 0.051%(+0.361)#314 |
| 68. | Seaside Heights Borough | 0.39% | 0.31%(+0.083)#68 | 0.051%(+0.344)#324 |
| 69. | Fords | 0.39% | 0.31%(+0.075)#69 | 0.051%(+0.336)#327 |
| 70. | Avenel | 0.38% | 0.31%(+0.071)#70 | 0.051%(+0.332)#328 |
| 71. | Westwood Borough | 0.38% | 0.31%(+0.070)#71 | 0.051%(+0.331)#329 |
| 72. | Far Hills Borough | 0.38% | 0.31%(+0.070)#72 | 0.051%(+0.331)#332 |
| 73. | The Hills | 0.37% | 0.31%(+0.054)#73 | 0.051%(+0.315)#342 |
| 74. | Ogdensburg Borough | 0.36% | 0.31%(+0.049)#74 | 0.051%(+0.310)#349 |
| 75. | Barrington Borough | 0.36% | 0.31%(+0.044)#75 | 0.051%(+0.305)#357 |
| 76. | Bloomsbury Borough | 0.35% | 0.31%(+0.037)#76 | 0.051%(+0.298)#364 |
| 77. | Chatham Borough | 0.35% | 0.31%(+0.036)#77 | 0.051%(+0.297)#365 |
| 78. | Leisure Village East | 0.34% | 0.31%(+0.032)#78 | 0.051%(+0.293)#368 |
| 79. | Milford Borough | 0.32% | 0.31%(+0.009)#79 | 0.051%(+0.270)#381 |
| 80. | Spotswood Borough | 0.31% | 0.31%(-0.005)#80 | 0.051%(+0.256)#392 |
| 81. | Helmetta Borough | 0.30% | 0.31%(-0.008)#81 | 0.051%(+0.253)#396 |
| 82. | Holiday City Berkeley | 0.30% | 0.31%(-0.011)#82 | 0.051%(+0.250)#399 |
| 83. | Upper Montclair | 0.30% | 0.31%(-0.015)#83 | 0.051%(+0.246)#403 |
| 84. | Somerdale Borough | 0.29% | 0.31%(-0.023)#84 | 0.051%(+0.239)#409 |
| 85. | Blackwells Mills | 0.29% | 0.31%(-0.024)#85 | 0.051%(+0.238)#410 |
| 86. | Rockaway Borough | 0.29% | 0.31%(-0.024)#86 | 0.051%(+0.237)#411 |
| 87. | Fairview Borough | 0.29% | 0.31%(-0.024)#87 | 0.051%(+0.237)#413 |
| 88. | Madison Borough | 0.28% | 0.31%(-0.028)#88 | 0.051%(+0.233)#419 |
| 89. | Beach Haven Borough | 0.28% | 0.31%(-0.029)#89 | 0.051%(+0.232)#420 |
| 90. | Ringwood Borough | 0.27% | 0.31%(-0.038)#90 | 0.051%(+0.223)#428 |
| 91. | Florham Park Borough | 0.27% | 0.31%(-0.038)#91 | 0.051%(+0.223)#429 |
| 92. | Millington | 0.27% | 0.31%(-0.040)#92 | 0.051%(+0.221)#433 |
| 93. | Mullica Hill | 0.27% | 0.31%(-0.043)#93 | 0.051%(+0.218)#438 |
| 94. | Lebanon Borough | 0.27% | 0.31%(-0.044)#94 | 0.051%(+0.217)#440 |
| 95. | Woodbridge | 0.26% | 0.31%(-0.049)#95 | 0.051%(+0.212)#450 |
| 96. | Summit | 0.26% | 0.31%(-0.055)#96 | 0.051%(+0.206)#457 |
| 97. | Sea Isle City | 0.24% | 0.31%(-0.068)#97 | 0.051%(+0.193)#475 |
| 98. | South Plainfield Borough | 0.24% | 0.31%(-0.069)#98 | 0.051%(+0.192)#478 |
| 99. | Middlesex Borough | 0.24% | 0.31%(-0.071)#99 | 0.051%(+0.190)#483 |
| 100. | Old Bridge | 0.23% | 0.31%(-0.077)#100 | 0.051%(+0.184)#490 |
Common Questions
What are the Top 10 Cities with the Highest Percentage of Immigrants from Portugal in New Jersey?
Top 10 Cities with the Highest Percentage of Immigrants from Portugal in New Jersey are:
#1
5.17%
#2
2.91%
#3
2.51%
#4
2.20%
#5
2.19%
#6
2.04%
#7
1.71%
#8
1.51%
#9
1.37%
#10
1.30%
What city has the Highest Percentage of Immigrants from Portugal in New Jersey?
Kearny has the Highest Percentage of Immigrants from Portugal in New Jersey with 5.17%.
What is the Percentage of Immigrants from Portugal in the State of New Jersey?
Percentage of Immigrants from Portugal in New Jersey is 0.31%.
What is the Percentage of Immigrants from Portugal in the United States?
Percentage of Immigrants from Portugal in the United States is 0.051%.