Cities with the Highest Percentage of African Population in New Jersey
RELATED REPORTS & OPTIONS
African
New Jersey
Compare Cities
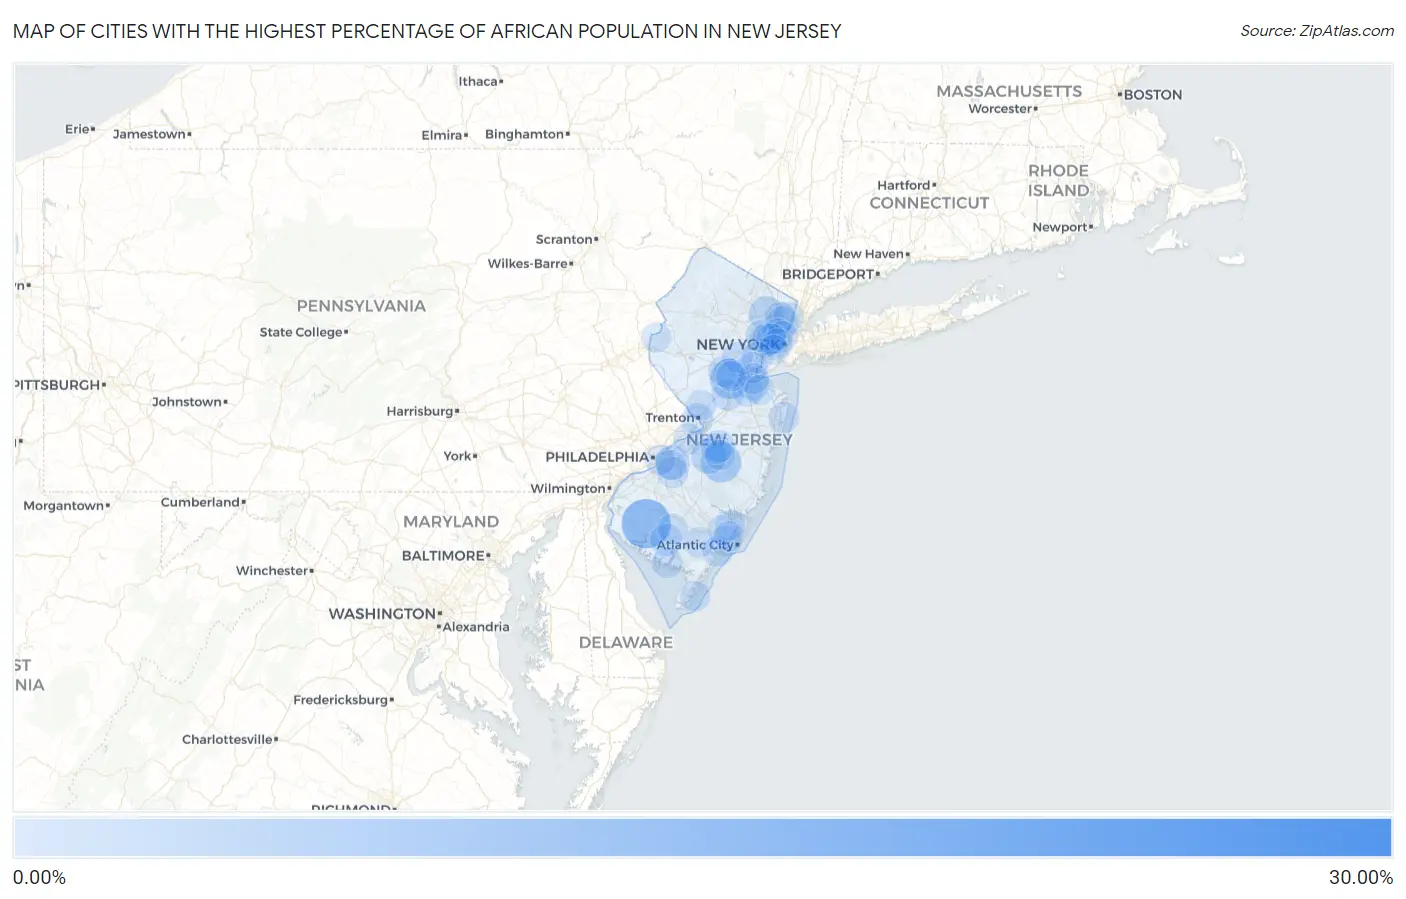
Map of Cities with the Highest Percentage of African Population in New Jersey
0.00%
30.00%
Cities with the Highest Percentage of African Population in New Jersey
| City | African | vs State | vs National | |
| 1. | Goshen | 25.47% | 0.55%(+24.9)#1 | 0.57%(+24.9)#18 |
| 2. | Seabrook Farms | 11.68% | 0.55%(+11.1)#2 | 0.57%(+11.1)#75 |
| 3. | Voorhees | 6.34% | 0.55%(+5.79)#3 | 0.57%(+5.78)#220 |
| 4. | Presidential Lakes Estates | 6.22% | 0.55%(+5.67)#4 | 0.57%(+5.65)#229 |
| 5. | Pemberton Heights | 3.53% | 0.55%(+2.98)#5 | 0.57%(+2.96)#502 |
| 6. | Paterson | 3.49% | 0.55%(+2.94)#6 | 0.57%(+2.92)#513 |
| 7. | North Plainfield Borough | 3.19% | 0.55%(+2.65)#7 | 0.57%(+2.63)#569 |
| 8. | Kingston Estates | 3.03% | 0.55%(+2.48)#8 | 0.57%(+2.46)#620 |
| 9. | Dorothy | 2.36% | 0.55%(+1.81)#9 | 0.57%(+1.79)#838 |
| 10. | Lawnside Borough | 2.32% | 0.55%(+1.77)#10 | 0.57%(+1.76)#858 |
| 11. | Roselle Borough | 2.23% | 0.55%(+1.69)#11 | 0.57%(+1.67)#892 |
| 12. | Newark | 2.22% | 0.55%(+1.68)#12 | 0.57%(+1.66)#898 |
| 13. | Madison Park | 2.21% | 0.55%(+1.66)#13 | 0.57%(+1.64)#908 |
| 14. | Berlin Borough | 1.95% | 0.55%(+1.40)#14 | 0.57%(+1.38)#1,057 |
| 15. | Allenhurst Borough | 1.94% | 0.55%(+1.40)#15 | 0.57%(+1.38)#1,061 |
| 16. | Harrison | 1.89% | 0.55%(+1.34)#16 | 0.57%(+1.32)#1,098 |
| 17. | Swedesboro Borough | 1.88% | 0.55%(+1.34)#17 | 0.57%(+1.32)#1,101 |
| 18. | Bloomingdale Borough | 1.77% | 0.55%(+1.23)#18 | 0.57%(+1.21)#1,169 |
| 19. | Millville | 1.75% | 0.55%(+1.21)#19 | 0.57%(+1.19)#1,180 |
| 20. | Mcguire Afb | 1.70% | 0.55%(+1.15)#20 | 0.57%(+1.13)#1,227 |
| 21. | Ridgefield Park | 1.69% | 0.55%(+1.15)#21 | 0.57%(+1.13)#1,233 |
| 22. | Sayreville Borough | 1.69% | 0.55%(+1.15)#22 | 0.57%(+1.13)#1,234 |
| 23. | Penns Grove Borough | 1.65% | 0.55%(+1.11)#23 | 0.57%(+1.09)#1,272 |
| 24. | Sicklerville | 1.60% | 0.55%(+1.05)#24 | 0.57%(+1.04)#1,324 |
| 25. | Wildwood Crest Borough | 1.55% | 0.55%(+1.00)#25 | 0.57%(+0.981)#1,361 |
| 26. | Pleasantdale | 1.50% | 0.55%(+0.957)#26 | 0.57%(+0.937)#1,401 |
| 27. | Florham Park Borough | 1.44% | 0.55%(+0.893)#27 | 0.57%(+0.873)#1,488 |
| 28. | Rainbow Lakes | 1.43% | 0.55%(+0.886)#28 | 0.57%(+0.867)#1,497 |
| 29. | Bloomsbury Borough | 1.40% | 0.55%(+0.849)#29 | 0.57%(+0.830)#1,549 |
| 30. | East Orange | 1.38% | 0.55%(+0.836)#30 | 0.57%(+0.817)#1,563 |
| 31. | Linden | 1.32% | 0.55%(+0.776)#31 | 0.57%(+0.757)#1,642 |
| 32. | Dayton | 1.32% | 0.55%(+0.770)#32 | 0.57%(+0.750)#1,657 |
| 33. | Montclair State University | 1.28% | 0.55%(+0.737)#33 | 0.57%(+0.718)#1,703 |
| 34. | Trenton | 1.21% | 0.55%(+0.668)#34 | 0.57%(+0.648)#1,794 |
| 35. | Echelon | 1.20% | 0.55%(+0.657)#35 | 0.57%(+0.637)#1,806 |
| 36. | Victory Gardens Borough | 1.19% | 0.55%(+0.646)#36 | 0.57%(+0.627)#1,820 |
| 37. | Dumont Borough | 1.19% | 0.55%(+0.642)#37 | 0.57%(+0.623)#1,823 |
| 38. | Englewood | 1.19% | 0.55%(+0.639)#38 | 0.57%(+0.620)#1,829 |
| 39. | Gillette | 1.18% | 0.55%(+0.629)#39 | 0.57%(+0.610)#1,844 |
| 40. | Lindenwold Borough | 1.16% | 0.55%(+0.612)#40 | 0.57%(+0.592)#1,869 |
| 41. | Hackensack | 1.15% | 0.55%(+0.601)#41 | 0.57%(+0.582)#1,886 |
| 42. | Franklin Center | 1.15% | 0.55%(+0.600)#42 | 0.57%(+0.581)#1,887 |
| 43. | Hi Nella Borough | 1.13% | 0.55%(+0.586)#43 | 0.57%(+0.567)#1,905 |
| 44. | Moonachie Borough | 1.13% | 0.55%(+0.586)#44 | 0.57%(+0.566)#1,906 |
| 45. | Woodbridge | 1.13% | 0.55%(+0.582)#45 | 0.57%(+0.562)#1,910 |
| 46. | Asbury Park | 1.12% | 0.55%(+0.576)#46 | 0.57%(+0.556)#1,923 |
| 47. | Old Bridge | 1.10% | 0.55%(+0.557)#47 | 0.57%(+0.538)#1,960 |
| 48. | Plainfield | 1.08% | 0.55%(+0.534)#48 | 0.57%(+0.515)#1,997 |
| 49. | South Bound Brook Borough | 1.07% | 0.55%(+0.529)#49 | 0.57%(+0.509)#2,011 |
| 50. | Kean University | 1.07% | 0.55%(+0.521)#50 | 0.57%(+0.502)#2,025 |
| 51. | Atco | 1.04% | 0.55%(+0.498)#51 | 0.57%(+0.478)#2,061 |
| 52. | Secaucus | 1.04% | 0.55%(+0.493)#52 | 0.57%(+0.473)#2,067 |
| 53. | Pleasantville | 1.03% | 0.55%(+0.485)#53 | 0.57%(+0.466)#2,084 |
| 54. | South Amboy | 1.03% | 0.55%(+0.482)#54 | 0.57%(+0.463)#2,089 |
| 55. | Port Norris | 0.99% | 0.55%(+0.447)#55 | 0.57%(+0.428)#2,150 |
| 56. | Westville Borough | 0.98% | 0.55%(+0.436)#56 | 0.57%(+0.417)#2,167 |
| 57. | Riverdale Borough | 0.98% | 0.55%(+0.434)#57 | 0.57%(+0.415)#2,172 |
| 58. | Montvale Borough | 0.97% | 0.55%(+0.429)#58 | 0.57%(+0.409)#2,185 |
| 59. | Franklin Borough | 0.97% | 0.55%(+0.427)#59 | 0.57%(+0.408)#2,189 |
| 60. | Flemington Borough | 0.97% | 0.55%(+0.420)#60 | 0.57%(+0.401)#2,202 |
| 61. | Vauxhall | 0.96% | 0.55%(+0.411)#61 | 0.57%(+0.391)#2,221 |
| 62. | Eatontown Borough | 0.95% | 0.55%(+0.401)#62 | 0.57%(+0.381)#2,242 |
| 63. | Gouldtown | 0.92% | 0.55%(+0.377)#63 | 0.57%(+0.358)#2,297 |
| 64. | Prospect Park Borough | 0.92% | 0.55%(+0.375)#64 | 0.57%(+0.355)#2,308 |
| 65. | Cliffside Park Borough | 0.90% | 0.55%(+0.358)#65 | 0.57%(+0.339)#2,336 |
| 66. | Carteret Borough | 0.89% | 0.55%(+0.344)#66 | 0.57%(+0.325)#2,362 |
| 67. | Burlington | 0.88% | 0.55%(+0.339)#67 | 0.57%(+0.319)#2,373 |
| 68. | Estell Manor | 0.87% | 0.55%(+0.321)#68 | 0.57%(+0.302)#2,417 |
| 69. | Raritan Borough | 0.87% | 0.55%(+0.321)#69 | 0.57%(+0.302)#2,418 |
| 70. | Union City | 0.81% | 0.55%(+0.269)#70 | 0.57%(+0.249)#2,547 |
| 71. | Jersey City | 0.81% | 0.55%(+0.266)#71 | 0.57%(+0.247)#2,552 |
| 72. | Somerset | 0.81% | 0.55%(+0.262)#72 | 0.57%(+0.243)#2,556 |
| 73. | North Wildwood | 0.80% | 0.55%(+0.251)#73 | 0.57%(+0.232)#2,592 |
| 74. | Fort Dix | 0.80% | 0.55%(+0.251)#74 | 0.57%(+0.231)#2,594 |
| 75. | Camden | 0.79% | 0.55%(+0.242)#75 | 0.57%(+0.223)#2,620 |
| 76. | Ringwood Borough | 0.79% | 0.55%(+0.241)#76 | 0.57%(+0.222)#2,624 |
| 77. | William Paterson University Of New Jersey | 0.77% | 0.55%(+0.228)#77 | 0.57%(+0.209)#2,667 |
| 78. | Vineland | 0.77% | 0.55%(+0.224)#78 | 0.57%(+0.204)#2,680 |
| 79. | Woodlynne Borough | 0.76% | 0.55%(+0.211)#79 | 0.57%(+0.192)#2,725 |
| 80. | Tenafly Borough | 0.75% | 0.55%(+0.199)#80 | 0.57%(+0.180)#2,754 |
| 81. | Somers Point | 0.73% | 0.55%(+0.179)#81 | 0.57%(+0.160)#2,808 |
| 82. | Lawrenceville | 0.72% | 0.55%(+0.172)#82 | 0.57%(+0.153)#2,826 |
| 83. | Somerdale Borough | 0.67% | 0.55%(+0.124)#83 | 0.57%(+0.104)#2,985 |
| 84. | East Franklin | 0.67% | 0.55%(+0.120)#84 | 0.57%(+0.101)#2,995 |
| 85. | Pomona | 0.66% | 0.55%(+0.118)#85 | 0.57%(+0.099)#2,998 |
| 86. | Kearny | 0.66% | 0.55%(+0.115)#86 | 0.57%(+0.096)#3,010 |
| 87. | Union | 0.64% | 0.55%(+0.093)#87 | 0.57%(+0.074)#3,090 |
| 88. | Browns Mills | 0.64% | 0.55%(+0.090)#88 | 0.57%(+0.071)#3,099 |
| 89. | Smithville | 0.63% | 0.55%(+0.089)#89 | 0.57%(+0.070)#3,101 |
| 90. | Netcong Borough | 0.63% | 0.55%(+0.085)#90 | 0.57%(+0.066)#3,113 |
| 91. | Palmyra Borough | 0.62% | 0.55%(+0.072)#91 | 0.57%(+0.053)#3,165 |
| 92. | Bergenfield Borough | 0.61% | 0.55%(+0.063)#92 | 0.57%(+0.044)#3,201 |
| 93. | Harmony | 0.61% | 0.55%(+0.062)#93 | 0.57%(+0.043)#3,209 |
| 94. | Leonia Borough | 0.60% | 0.55%(+0.058)#94 | 0.57%(+0.039)#3,221 |
| 95. | Absecon | 0.59% | 0.55%(+0.048)#95 | 0.57%(+0.029)#3,258 |
| 96. | Strathmore | 0.56% | 0.55%(+0.019)#96 | 0.57%(-0.000)#3,381 |
| 97. | Keansburg Borough | 0.54% | 0.55%(-0.003)#97 | 0.57%(-0.022)#3,467 |
| 98. | Wharton Borough | 0.51% | 0.55%(-0.033)#98 | 0.57%(-0.053)#3,584 |
| 99. | Barclay | 0.51% | 0.55%(-0.035)#99 | 0.57%(-0.055)#3,591 |
| 100. | Bayonne | 0.50% | 0.55%(-0.041)#100 | 0.57%(-0.060)#3,619 |
Common Questions
What are the Top 10 Cities with the Highest Percentage of African Population in New Jersey?
Top 10 Cities with the Highest Percentage of African Population in New Jersey are:
#1
11.68%
#2
6.34%
#3
6.22%
#4
3.53%
#5
3.49%
#6
3.03%
#7
2.22%
#8
2.21%
#9
1.89%
#10
1.75%
What city has the Highest Percentage of African Population in New Jersey?
Seabrook Farms has the Highest Percentage of African Population in New Jersey with 11.68%.
What is the Percentage of African Population in the State of New Jersey?
Percentage of African Population in New Jersey is 0.55%.
What is the Percentage of African Population in the United States?
Percentage of African Population in the United States is 0.57%.