Cities with the Highest Percentage of Population Employed in Professional & Scientific Services in New Jersey
RELATED REPORTS & OPTIONS
Professional & Scientific Services
New Jersey
Compare Cities
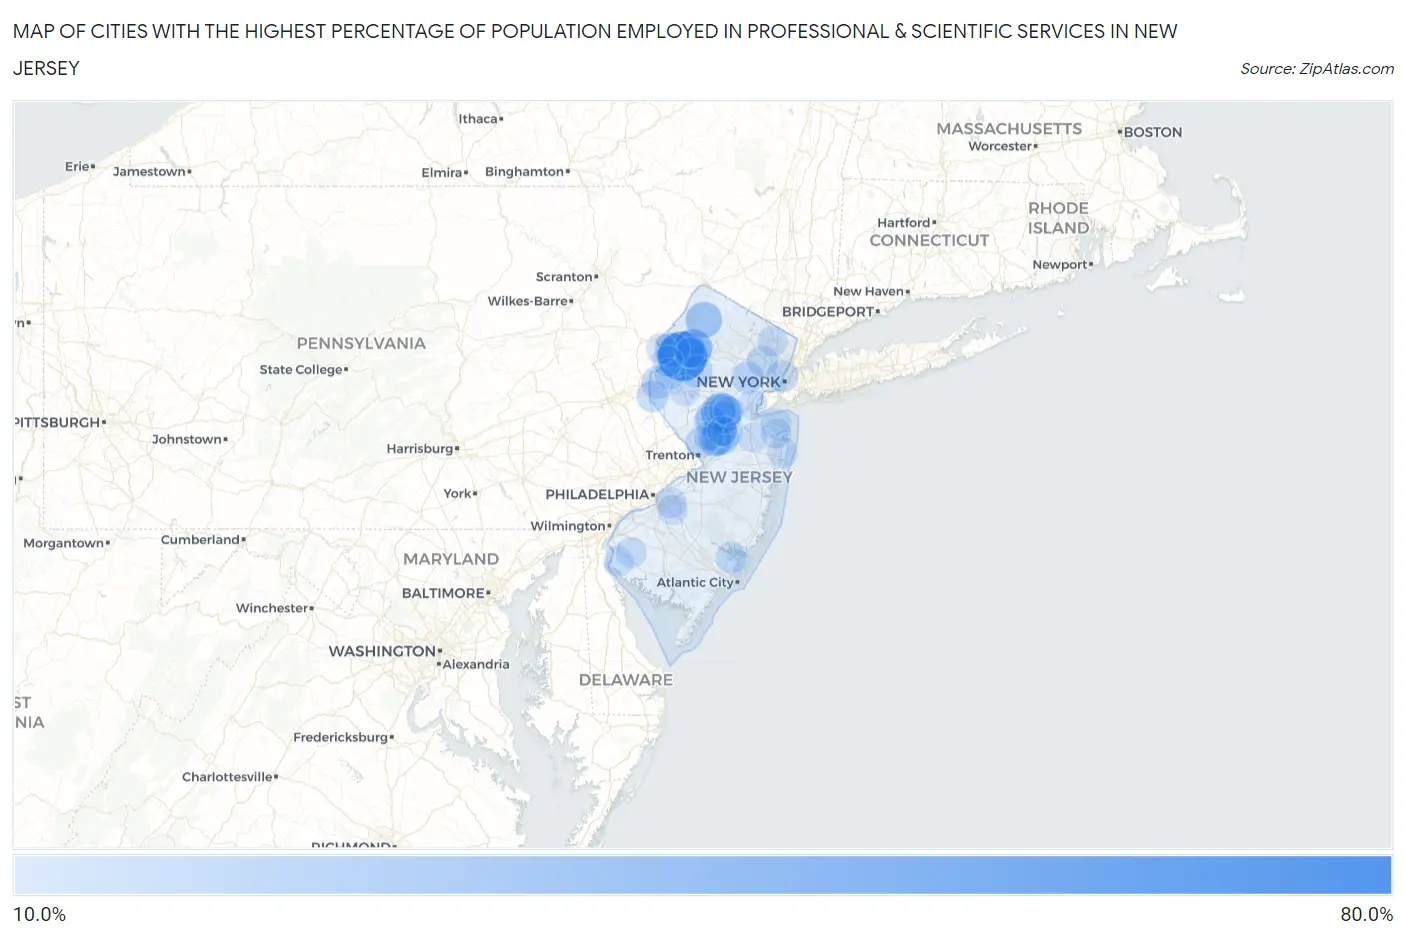
Map of Cities with the Highest Percentage of Population Employed in Professional & Scientific Services in New Jersey
0.0%
80.0%
Cities with the Highest Percentage of Population Employed in Professional & Scientific Services in New Jersey
| City | % Employed | vs State | vs National | |
| 1. | Great Meadows | 79.4% | 9.9%(+69.4)#1 | 7.8%(+71.5)#27 |
| 2. | Oldwick | 51.5% | 9.9%(+41.5)#2 | 7.8%(+43.6)#68 |
| 3. | Deerfield Street | 50.0% | 9.9%(+40.1)#3 | 7.8%(+42.2)#78 |
| 4. | East Millstone | 48.3% | 9.9%(+38.4)#4 | 7.8%(+40.5)#86 |
| 5. | Allamuchy | 46.0% | 9.9%(+36.1)#5 | 7.8%(+38.2)#93 |
| 6. | Ross Corner | 36.8% | 9.9%(+26.9)#6 | 7.8%(+29.0)#165 |
| 7. | Nesco | 33.8% | 9.9%(+23.8)#7 | 7.8%(+25.9)#199 |
| 8. | Bridgeport | 33.3% | 9.9%(+23.4)#8 | 7.8%(+25.5)#204 |
| 9. | Princeton Meadows | 32.1% | 9.9%(+22.2)#9 | 7.8%(+24.3)#234 |
| 10. | Mount Hermon | 32.0% | 9.9%(+22.0)#10 | 7.8%(+24.1)#239 |
| 11. | Monroe Manor | 31.6% | 9.9%(+21.7)#11 | 7.8%(+23.8)#244 |
| 12. | Mantoloking Borough | 31.0% | 9.9%(+21.0)#12 | 7.8%(+23.1)#256 |
| 13. | Woodcliff Lake Borough | 30.5% | 9.9%(+20.6)#13 | 7.8%(+22.7)#267 |
| 14. | Windsor | 29.4% | 9.9%(+19.4)#14 | 7.8%(+21.5)#297 |
| 15. | Plainsboro Center | 28.1% | 9.9%(+18.1)#15 | 7.8%(+20.2)#336 |
| 16. | Pine Brook | 27.6% | 9.9%(+17.6)#16 | 7.8%(+19.7)#356 |
| 17. | Heathcote | 27.4% | 9.9%(+17.4)#17 | 7.8%(+19.5)#364 |
| 18. | Princeton Junction | 27.1% | 9.9%(+17.2)#18 | 7.8%(+19.2)#375 |
| 19. | Upper Saddle River Borough | 26.7% | 9.9%(+16.8)#19 | 7.8%(+18.9)#390 |
| 20. | New Vernon | 25.2% | 9.9%(+15.3)#20 | 7.8%(+17.3)#453 |
| 21. | Demarest Borough | 24.9% | 9.9%(+15.0)#21 | 7.8%(+17.1)#465 |
| 22. | Upper Stewartsville | 24.8% | 9.9%(+14.9)#22 | 7.8%(+17.0)#476 |
| 23. | Robbinsville Center | 24.6% | 9.9%(+14.7)#23 | 7.8%(+16.7)#484 |
| 24. | Pleasantdale | 24.3% | 9.9%(+14.4)#24 | 7.8%(+16.5)#506 |
| 25. | Six Mile Run | 24.2% | 9.9%(+14.3)#25 | 7.8%(+16.4)#508 |
| 26. | Short Hills | 23.7% | 9.9%(+13.7)#26 | 7.8%(+15.8)#534 |
| 27. | Long Valley | 23.6% | 9.9%(+13.7)#27 | 7.8%(+15.7)#541 |
| 28. | Rockleigh Borough | 23.3% | 9.9%(+13.4)#28 | 7.8%(+15.5)#563 |
| 29. | Green | 23.1% | 9.9%(+13.2)#29 | 7.8%(+15.3)#578 |
| 30. | Finesville | 23.0% | 9.9%(+13.1)#30 | 7.8%(+15.2)#586 |
| 31. | Belle Mead | 22.7% | 9.9%(+12.7)#31 | 7.8%(+14.8)#610 |
| 32. | Deans | 22.6% | 9.9%(+12.7)#32 | 7.8%(+14.8)#617 |
| 33. | Mountain Lakes Borough | 22.5% | 9.9%(+12.6)#33 | 7.8%(+14.7)#623 |
| 34. | Lawrenceville | 22.4% | 9.9%(+12.5)#34 | 7.8%(+14.6)#632 |
| 35. | Hoboken | 22.4% | 9.9%(+12.4)#35 | 7.8%(+14.5)#634 |
| 36. | Little Silver Borough | 22.4% | 9.9%(+12.4)#36 | 7.8%(+14.5)#635 |
| 37. | Port Republic | 22.2% | 9.9%(+12.3)#37 | 7.8%(+14.4)#655 |
| 38. | Longport Borough | 21.8% | 9.9%(+11.9)#38 | 7.8%(+14.0)#683 |
| 39. | Weston | 21.7% | 9.9%(+11.8)#39 | 7.8%(+13.9)#695 |
| 40. | Harrisonville | 21.6% | 9.9%(+11.7)#40 | 7.8%(+13.8)#712 |
| 41. | Tenafly Borough | 21.5% | 9.9%(+11.6)#41 | 7.8%(+13.7)#720 |
| 42. | Upper Montclair | 21.4% | 9.9%(+11.5)#42 | 7.8%(+13.6)#733 |
| 43. | Allenhurst Borough | 21.4% | 9.9%(+11.5)#43 | 7.8%(+13.5)#734 |
| 44. | Spring Lake Borough | 21.3% | 9.9%(+11.3)#44 | 7.8%(+13.4)#747 |
| 45. | Silver Lake Cdp Warren County | 21.2% | 9.9%(+11.3)#45 | 7.8%(+13.4)#751 |
| 46. | Peapack And Gladstone Borough | 21.2% | 9.9%(+11.2)#46 | 7.8%(+13.3)#762 |
| 47. | Forsgate | 21.1% | 9.9%(+11.2)#47 | 7.8%(+13.3)#765 |
| 48. | Cranford | 21.1% | 9.9%(+11.1)#48 | 7.8%(+13.2)#768 |
| 49. | Harlingen | 20.7% | 9.9%(+10.8)#49 | 7.8%(+12.9)#816 |
| 50. | Fanwood Borough | 20.4% | 9.9%(+10.5)#50 | 7.8%(+12.6)#841 |
| 51. | Brass Castle | 20.3% | 9.9%(+10.4)#51 | 7.8%(+12.4)#853 |
| 52. | Bridgeville | 20.3% | 9.9%(+10.3)#52 | 7.8%(+12.4)#861 |
| 53. | Liberty Corner | 20.2% | 9.9%(+10.3)#53 | 7.8%(+12.4)#862 |
| 54. | Old Tappan Borough | 20.0% | 9.9%(+10.0)#54 | 7.8%(+12.1)#895 |
| 55. | Belford | 19.9% | 9.9%(+9.97)#55 | 7.8%(+12.1)#898 |
| 56. | Essex Fells Borough | 19.8% | 9.9%(+9.86)#56 | 7.8%(+12.0)#918 |
| 57. | Pennington Borough | 19.7% | 9.9%(+9.78)#57 | 7.8%(+11.9)#925 |
| 58. | Bay Head Borough | 19.7% | 9.9%(+9.75)#58 | 7.8%(+11.8)#930 |
| 59. | Towaco | 19.6% | 9.9%(+9.65)#59 | 7.8%(+11.7)#939 |
| 60. | River Edge Borough | 19.6% | 9.9%(+9.63)#60 | 7.8%(+11.7)#944 |
| 61. | Oceanville | 19.4% | 9.9%(+9.49)#61 | 7.8%(+11.6)#958 |
| 62. | Chatham Borough | 19.1% | 9.9%(+9.21)#62 | 7.8%(+11.3)#995 |
| 63. | Columbia | 19.1% | 9.9%(+9.17)#63 | 7.8%(+11.3)#1,003 |
| 64. | Dayton | 19.0% | 9.9%(+9.10)#64 | 7.8%(+11.2)#1,015 |
| 65. | Sea Girt Borough | 19.0% | 9.9%(+9.08)#65 | 7.8%(+11.2)#1,018 |
| 66. | Barclay | 19.0% | 9.9%(+9.07)#66 | 7.8%(+11.2)#1,023 |
| 67. | Alloway | 19.0% | 9.9%(+9.06)#67 | 7.8%(+11.1)#1,024 |
| 68. | Ridgewood | 19.0% | 9.9%(+9.06)#68 | 7.8%(+11.1)#1,025 |
| 69. | Wanamassa | 19.0% | 9.9%(+9.03)#69 | 7.8%(+11.1)#1,032 |
| 70. | Caldwell Borough | 18.5% | 9.9%(+8.61)#70 | 7.8%(+10.7)#1,080 |
| 71. | Fairview | 18.4% | 9.9%(+8.42)#71 | 7.8%(+10.5)#1,108 |
| 72. | Troy Hills | 18.3% | 9.9%(+8.40)#72 | 7.8%(+10.5)#1,112 |
| 73. | New Providence Borough | 18.3% | 9.9%(+8.32)#73 | 7.8%(+10.4)#1,124 |
| 74. | Westmont | 17.8% | 9.9%(+7.88)#74 | 7.8%(+9.97)#1,196 |
| 75. | Haworth Borough | 17.8% | 9.9%(+7.87)#75 | 7.8%(+9.96)#1,198 |
| 76. | Echelon | 17.6% | 9.9%(+7.63)#76 | 7.8%(+9.72)#1,250 |
| 77. | Princeton | 17.6% | 9.9%(+7.62)#77 | 7.8%(+9.71)#1,253 |
| 78. | Lake Hiawatha | 17.5% | 9.9%(+7.57)#78 | 7.8%(+9.66)#1,267 |
| 79. | Lebanon Borough | 17.5% | 9.9%(+7.57)#79 | 7.8%(+9.65)#1,268 |
| 80. | Hancocks Bridge | 17.5% | 9.9%(+7.53)#80 | 7.8%(+9.62)#1,276 |
| 81. | Woodbridge | 17.5% | 9.9%(+7.52)#81 | 7.8%(+9.60)#1,283 |
| 82. | North Caldwell Borough | 17.3% | 9.9%(+7.37)#82 | 7.8%(+9.46)#1,308 |
| 83. | Franklin Center | 17.3% | 9.9%(+7.35)#83 | 7.8%(+9.44)#1,313 |
| 84. | Annandale | 17.3% | 9.9%(+7.35)#84 | 7.8%(+9.44)#1,314 |
| 85. | Somerset | 17.2% | 9.9%(+7.27)#85 | 7.8%(+9.36)#1,326 |
| 86. | Glen Ridge Borough | 17.2% | 9.9%(+7.26)#86 | 7.8%(+9.35)#1,331 |
| 87. | Monmouth Junction | 17.2% | 9.9%(+7.25)#87 | 7.8%(+9.34)#1,333 |
| 88. | Absecon Highlands | 17.1% | 9.9%(+7.20)#88 | 7.8%(+9.29)#1,346 |
| 89. | Interlaken Borough | 17.0% | 9.9%(+7.07)#89 | 7.8%(+9.16)#1,370 |
| 90. | Metuchen Borough | 17.0% | 9.9%(+7.07)#90 | 7.8%(+9.16)#1,372 |
| 91. | Allendale Borough | 17.0% | 9.9%(+7.04)#91 | 7.8%(+9.13)#1,376 |
| 92. | Parsippany | 17.0% | 9.9%(+7.04)#92 | 7.8%(+9.13)#1,377 |
| 93. | Panther Valley | 17.0% | 9.9%(+7.04)#93 | 7.8%(+9.13)#1,378 |
| 94. | Robertsville | 16.9% | 9.9%(+6.94)#94 | 7.8%(+9.03)#1,396 |
| 95. | Far Hills Borough | 16.8% | 9.9%(+6.83)#95 | 7.8%(+8.91)#1,425 |
| 96. | Edgewater Borough | 16.7% | 9.9%(+6.81)#96 | 7.8%(+8.90)#1,429 |
| 97. | Basking Ridge | 16.7% | 9.9%(+6.77)#97 | 7.8%(+8.86)#1,437 |
| 98. | Cream Ridge | 16.6% | 9.9%(+6.65)#98 | 7.8%(+8.74)#1,463 |
| 99. | Beach Haven Borough | 16.5% | 9.9%(+6.59)#99 | 7.8%(+8.68)#1,477 |
| 100. | Ramsey Borough | 16.5% | 9.9%(+6.59)#100 | 7.8%(+8.68)#1,480 |
Common Questions
What are the Top 10 Cities with the Highest Percentage of Population Employed in Professional & Scientific Services in New Jersey?
Top 10 Cities with the Highest Percentage of Population Employed in Professional & Scientific Services in New Jersey are:
#1
79.4%
#2
48.3%
#3
46.0%
#4
36.8%
#5
32.1%
#6
32.0%
#7
28.1%
#8
27.4%
#9
27.1%
#10
24.8%
What city has the Highest Percentage of Population Employed in Professional & Scientific Services in New Jersey?
Great Meadows has the Highest Percentage of Population Employed in Professional & Scientific Services in New Jersey with 79.4%.
What is the Percentage of Population Employed in Professional & Scientific Services in the State of New Jersey?
Percentage of Population Employed in Professional & Scientific Services in New Jersey is 9.9%.
What is the Percentage of Population Employed in Professional & Scientific Services in the United States?
Percentage of Population Employed in Professional & Scientific Services in the United States is 7.8%.