Cities with the Highest Percentage of Population Employed in Law Enforcement in New Jersey
RELATED REPORTS & OPTIONS
Law Enforcement
New Jersey
Compare Cities
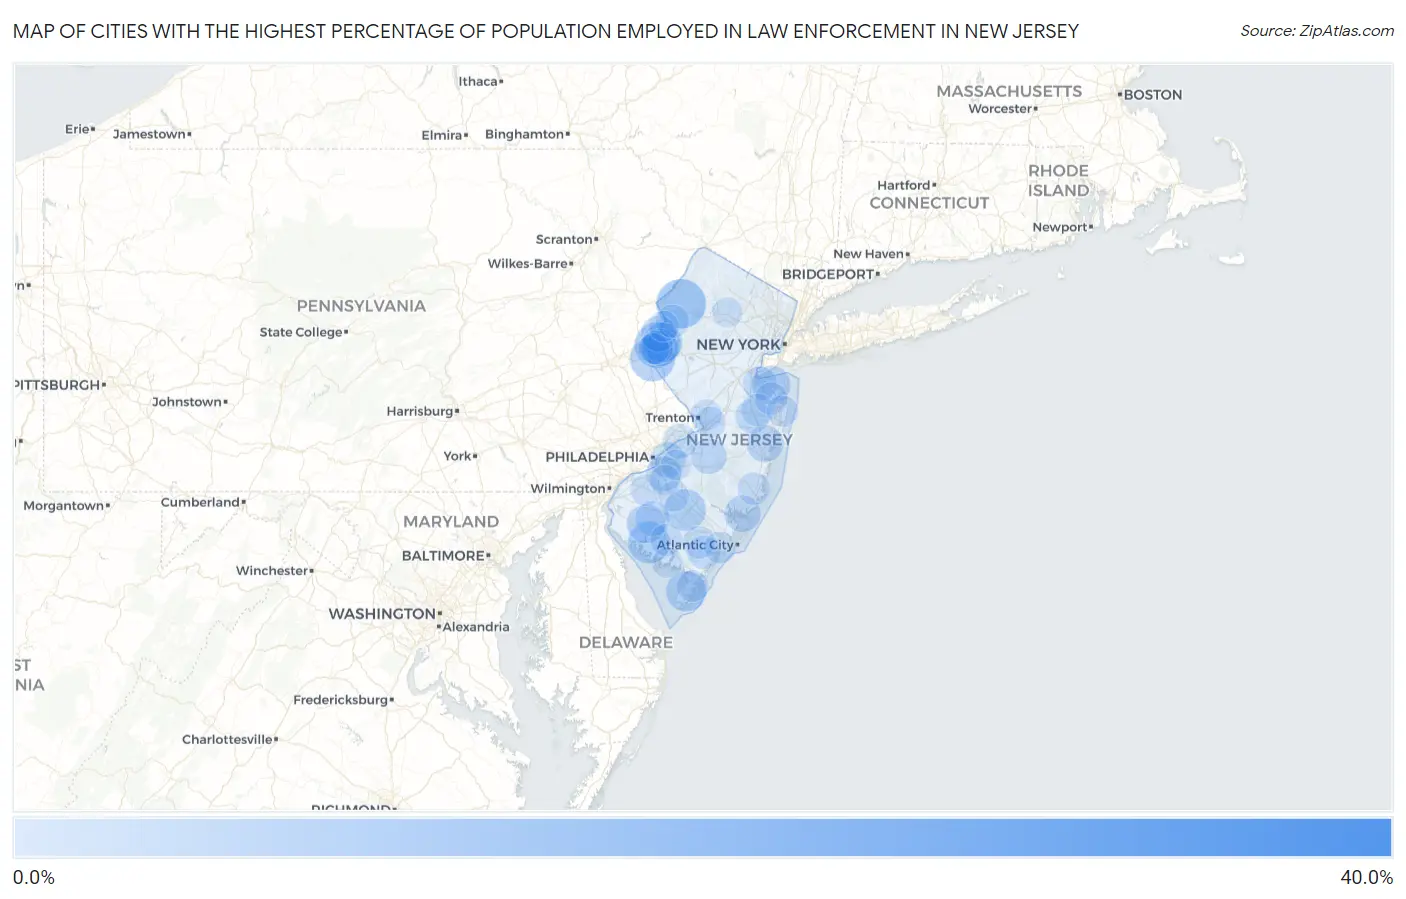
Map of Cities with the Highest Percentage of Population Employed in Law Enforcement in New Jersey
0.0%
40.0%
Cities with the Highest Percentage of Population Employed in Law Enforcement in New Jersey
| City | % Employed | vs State | vs National | |
| 1. | Dutch Neck | 37.7% | 1.1%(+36.6)#1 | 0.96%(+36.7)#32 |
| 2. | Port Elizabeth | 37.2% | 1.1%(+36.1)#2 | 0.96%(+36.2)#36 |
| 3. | Marksboro | 13.2% | 1.1%(+12.2)#3 | 0.96%(+12.3)#267 |
| 4. | Upper Stewartsville | 11.1% | 1.1%(+10.0)#4 | 0.96%(+10.1)#390 |
| 5. | Finesville | 10.8% | 1.1%(+9.71)#5 | 0.96%(+9.83)#421 |
| 6. | Dividing Creek | 10.7% | 1.1%(+9.61)#6 | 0.96%(+9.73)#427 |
| 7. | Silver Lake | 9.1% | 1.1%(+8.05)#7 | 0.96%(+8.17)#565 |
| 8. | Marshallville | 9.0% | 1.1%(+7.94)#8 | 0.96%(+8.06)#586 |
| 9. | Fairton | 9.0% | 1.1%(+7.93)#9 | 0.96%(+8.05)#587 |
| 10. | Collings Lakes | 8.9% | 1.1%(+7.83)#10 | 0.96%(+7.95)#594 |
| 11. | Whitesboro | 8.1% | 1.1%(+7.00)#11 | 0.96%(+7.12)#725 |
| 12. | New Village | 7.6% | 1.1%(+6.51)#12 | 0.96%(+6.63)#801 |
| 13. | William Paterson University Of New Jersey | 7.3% | 1.1%(+6.18)#13 | 0.96%(+6.30)#867 |
| 14. | Seabrook Farms | 7.1% | 1.1%(+6.05)#14 | 0.96%(+6.17)#897 |
| 15. | North Middletown | 7.1% | 1.1%(+6.04)#15 | 0.96%(+6.16)#900 |
| 16. | Delmont | 6.3% | 1.1%(+5.27)#16 | 0.96%(+5.39)#1,115 |
| 17. | Stewartsville | 6.3% | 1.1%(+5.24)#17 | 0.96%(+5.36)#1,121 |
| 18. | Wenonah Borough | 6.3% | 1.1%(+5.20)#18 | 0.96%(+5.33)#1,130 |
| 19. | Lakeside-Beebe Run | 6.1% | 1.1%(+4.98)#19 | 0.96%(+5.10)#1,197 |
| 20. | Leisure Village | 6.0% | 1.1%(+4.93)#20 | 0.96%(+5.05)#1,212 |
| 21. | Mystic Island | 5.9% | 1.1%(+4.84)#21 | 0.96%(+4.96)#1,247 |
| 22. | Leesburg | 5.7% | 1.1%(+4.66)#22 | 0.96%(+4.78)#1,308 |
| 23. | Pemberton Heights | 5.6% | 1.1%(+4.51)#23 | 0.96%(+4.63)#1,370 |
| 24. | Hutchinson | 5.5% | 1.1%(+4.40)#24 | 0.96%(+4.52)#1,416 |
| 25. | Golden Triangle | 5.4% | 1.1%(+4.36)#25 | 0.96%(+4.48)#1,435 |
| 26. | Tuckerton Borough | 5.1% | 1.1%(+3.98)#26 | 0.96%(+4.10)#1,602 |
| 27. | Glendora | 5.1% | 1.1%(+3.97)#27 | 0.96%(+4.09)#1,606 |
| 28. | Milltown Borough | 5.0% | 1.1%(+3.90)#28 | 0.96%(+4.02)#1,640 |
| 29. | Green | 4.9% | 1.1%(+3.82)#29 | 0.96%(+3.95)#1,674 |
| 30. | Olivet | 4.9% | 1.1%(+3.81)#30 | 0.96%(+3.93)#1,682 |
| 31. | Beverly | 4.8% | 1.1%(+3.75)#31 | 0.96%(+3.87)#1,712 |
| 32. | Newport | 4.8% | 1.1%(+3.68)#32 | 0.96%(+3.80)#1,747 |
| 33. | Oceanport Borough | 4.7% | 1.1%(+3.61)#33 | 0.96%(+3.73)#1,780 |
| 34. | Kean University | 4.6% | 1.1%(+3.55)#34 | 0.96%(+3.67)#1,815 |
| 35. | Seaside Heights Borough | 4.6% | 1.1%(+3.52)#35 | 0.96%(+3.64)#1,836 |
| 36. | Milmay | 4.6% | 1.1%(+3.51)#36 | 0.96%(+3.63)#1,845 |
| 37. | West Freehold | 4.6% | 1.1%(+3.49)#37 | 0.96%(+3.61)#1,852 |
| 38. | Stanhope Borough | 4.5% | 1.1%(+3.45)#38 | 0.96%(+3.57)#1,873 |
| 39. | Cliffwood Beach | 4.5% | 1.1%(+3.41)#39 | 0.96%(+3.53)#1,903 |
| 40. | Millstone Borough | 4.5% | 1.1%(+3.40)#40 | 0.96%(+3.52)#1,907 |
| 41. | Greenwich | 4.4% | 1.1%(+3.30)#41 | 0.96%(+3.42)#1,977 |
| 42. | Ringwood Borough | 4.4% | 1.1%(+3.29)#42 | 0.96%(+3.41)#1,985 |
| 43. | Lower Berkshire Valley | 4.4% | 1.1%(+3.28)#43 | 0.96%(+3.40)#1,991 |
| 44. | Ampere North | 4.4% | 1.1%(+3.27)#44 | 0.96%(+3.39)#1,999 |
| 45. | Stockton Borough | 4.1% | 1.1%(+3.04)#45 | 0.96%(+3.16)#2,176 |
| 46. | Rainbow Lakes | 4.1% | 1.1%(+2.99)#46 | 0.96%(+3.11)#2,223 |
| 47. | Mountain Lake | 4.0% | 1.1%(+2.91)#47 | 0.96%(+3.03)#2,283 |
| 48. | Beesleys Point | 4.0% | 1.1%(+2.88)#48 | 0.96%(+3.00)#2,306 |
| 49. | Sea Girt Borough | 3.9% | 1.1%(+2.86)#49 | 0.96%(+2.98)#2,317 |
| 50. | Corbin City | 3.9% | 1.1%(+2.84)#50 | 0.96%(+2.96)#2,333 |
| 51. | Andover Borough | 3.8% | 1.1%(+2.75)#51 | 0.96%(+2.87)#2,407 |
| 52. | Farmingdale Borough | 3.8% | 1.1%(+2.73)#52 | 0.96%(+2.85)#2,437 |
| 53. | North Haledon Borough | 3.8% | 1.1%(+2.69)#53 | 0.96%(+2.81)#2,482 |
| 54. | East Freehold | 3.7% | 1.1%(+2.66)#54 | 0.96%(+2.78)#2,508 |
| 55. | Rumson Borough | 3.7% | 1.1%(+2.65)#55 | 0.96%(+2.77)#2,513 |
| 56. | Lincroft | 3.7% | 1.1%(+2.57)#56 | 0.96%(+2.69)#2,579 |
| 57. | Estell Manor | 3.6% | 1.1%(+2.56)#57 | 0.96%(+2.68)#2,594 |
| 58. | Ocean Acres | 3.5% | 1.1%(+2.45)#58 | 0.96%(+2.57)#2,679 |
| 59. | Emerson Borough | 3.5% | 1.1%(+2.41)#59 | 0.96%(+2.53)#2,723 |
| 60. | Millville | 3.4% | 1.1%(+2.32)#60 | 0.96%(+2.44)#2,807 |
| 61. | Haddon Heights Borough | 3.4% | 1.1%(+2.30)#61 | 0.96%(+2.43)#2,827 |
| 62. | Clementon Borough | 3.4% | 1.1%(+2.29)#62 | 0.96%(+2.41)#2,837 |
| 63. | Layton | 3.4% | 1.1%(+2.28)#63 | 0.96%(+2.40)#2,847 |
| 64. | Connecticut Farms | 3.3% | 1.1%(+2.21)#64 | 0.96%(+2.33)#2,931 |
| 65. | Linwood | 3.2% | 1.1%(+2.16)#65 | 0.96%(+2.28)#2,985 |
| 66. | Palermo | 3.2% | 1.1%(+2.14)#66 | 0.96%(+2.26)#3,018 |
| 67. | Newfoundland | 3.2% | 1.1%(+2.11)#67 | 0.96%(+2.23)#3,052 |
| 68. | Mullica Hill | 3.2% | 1.1%(+2.08)#68 | 0.96%(+2.20)#3,102 |
| 69. | Island Heights Borough | 3.1% | 1.1%(+1.98)#69 | 0.96%(+2.10)#3,227 |
| 70. | Cape May Court House | 3.1% | 1.1%(+1.97)#70 | 0.96%(+2.09)#3,246 |
| 71. | Helmetta Borough | 3.0% | 1.1%(+1.95)#71 | 0.96%(+2.07)#3,263 |
| 72. | South Plainfield Borough | 3.0% | 1.1%(+1.95)#72 | 0.96%(+2.07)#3,283 |
| 73. | Mercerville | 3.0% | 1.1%(+1.93)#73 | 0.96%(+2.05)#3,308 |
| 74. | Sea Bright Borough | 3.0% | 1.1%(+1.90)#74 | 0.96%(+2.02)#3,345 |
| 75. | North Caldwell Borough | 3.0% | 1.1%(+1.88)#75 | 0.96%(+2.00)#3,371 |
| 76. | Wood Ridge Borough | 3.0% | 1.1%(+1.88)#76 | 0.96%(+2.00)#3,378 |
| 77. | Stirling | 3.0% | 1.1%(+1.87)#77 | 0.96%(+1.99)#3,396 |
| 78. | Yardville | 2.9% | 1.1%(+1.86)#78 | 0.96%(+1.98)#3,405 |
| 79. | Interlaken Borough | 2.9% | 1.1%(+1.85)#79 | 0.96%(+1.97)#3,434 |
| 80. | Lake Hopatcong | 2.9% | 1.1%(+1.84)#80 | 0.96%(+1.96)#3,451 |
| 81. | Upper Pohatcong | 2.9% | 1.1%(+1.80)#81 | 0.96%(+1.92)#3,509 |
| 82. | Oakhurst | 2.8% | 1.1%(+1.74)#82 | 0.96%(+1.86)#3,603 |
| 83. | Watchung Borough | 2.8% | 1.1%(+1.70)#83 | 0.96%(+1.82)#3,666 |
| 84. | Stratford Borough | 2.8% | 1.1%(+1.67)#84 | 0.96%(+1.79)#3,715 |
| 85. | Flagtown | 2.8% | 1.1%(+1.67)#85 | 0.96%(+1.79)#3,719 |
| 86. | North Arlington Borough | 2.7% | 1.1%(+1.65)#86 | 0.96%(+1.77)#3,757 |
| 87. | Cologne | 2.7% | 1.1%(+1.62)#87 | 0.96%(+1.74)#3,793 |
| 88. | Jamesburg Borough | 2.6% | 1.1%(+1.53)#88 | 0.96%(+1.65)#3,952 |
| 89. | Pine Hill Borough | 2.6% | 1.1%(+1.52)#89 | 0.96%(+1.64)#3,969 |
| 90. | Greentree | 2.6% | 1.1%(+1.50)#90 | 0.96%(+1.62)#4,013 |
| 91. | Williamstown | 2.6% | 1.1%(+1.49)#91 | 0.96%(+1.61)#4,033 |
| 92. | Port Norris | 2.6% | 1.1%(+1.48)#92 | 0.96%(+1.60)#4,061 |
| 93. | Belvidere | 2.5% | 1.1%(+1.46)#93 | 0.96%(+1.58)#4,096 |
| 94. | Hawthorne Borough | 2.5% | 1.1%(+1.46)#94 | 0.96%(+1.58)#4,106 |
| 95. | Centre Grove | 2.5% | 1.1%(+1.43)#95 | 0.96%(+1.55)#4,174 |
| 96. | Pompton Lakes Borough | 2.5% | 1.1%(+1.42)#96 | 0.96%(+1.54)#4,184 |
| 97. | Neptune City Borough | 2.5% | 1.1%(+1.41)#97 | 0.96%(+1.53)#4,196 |
| 98. | Crosswicks | 2.4% | 1.1%(+1.36)#98 | 0.96%(+1.48)#4,304 |
| 99. | Blackwood | 2.4% | 1.1%(+1.29)#99 | 0.96%(+1.41)#4,452 |
| 100. | White Meadow Lake | 2.3% | 1.1%(+1.22)#100 | 0.96%(+1.34)#4,598 |
Common Questions
What are the Top 10 Cities with the Highest Percentage of Population Employed in Law Enforcement in New Jersey?
Top 10 Cities with the Highest Percentage of Population Employed in Law Enforcement in New Jersey are:
#1
13.2%
#2
11.1%
#3
10.8%
#4
9.0%
#5
8.9%
#6
8.1%
#7
7.6%
#8
7.1%
#9
7.1%
#10
6.3%
What city has the Highest Percentage of Population Employed in Law Enforcement in New Jersey?
Marksboro has the Highest Percentage of Population Employed in Law Enforcement in New Jersey with 13.2%.
What is the Percentage of Population Employed in Law Enforcement in the State of New Jersey?
Percentage of Population Employed in Law Enforcement in New Jersey is 1.1%.
What is the Percentage of Population Employed in Law Enforcement in the United States?
Percentage of Population Employed in Law Enforcement in the United States is 0.96%.