Cities with the Lowest Poverty Level Among Children Under the Age of 16 in New Jersey
RELATED REPORTS & OPTIONS
Lowest Poverty | Child 0-16
New Jersey
Compare Cities
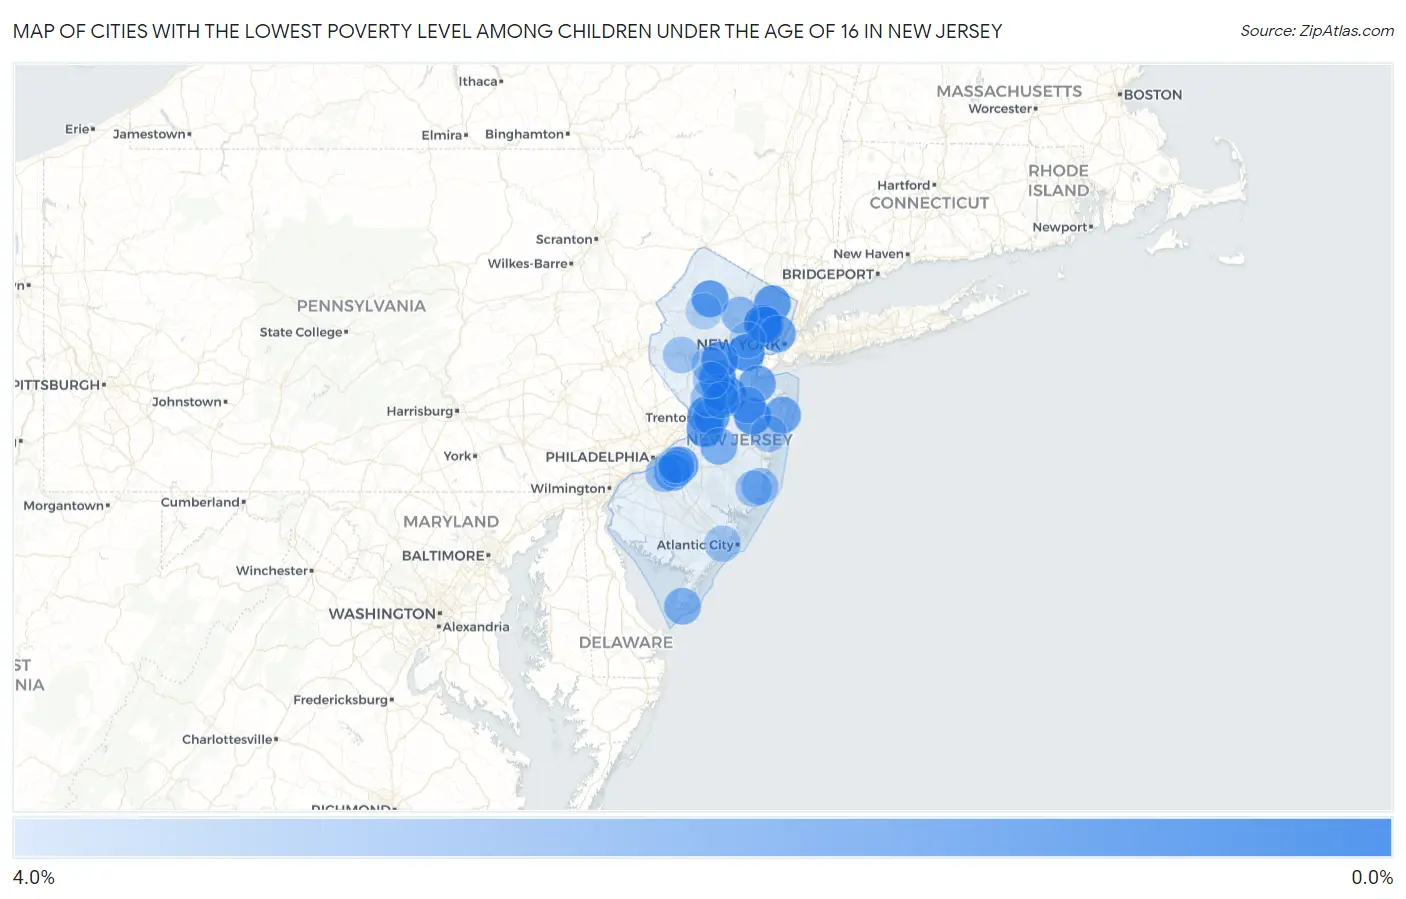
Map of Cities with the Lowest Poverty Level Among Children Under the Age of 16 in New Jersey
4.0%
0.0%
Cities with the Lowest Poverty Level Among Children Under the Age of 16 in New Jersey
| City | Child Poverty | vs State | vs National | |
| 1. | Glen Rock Borough | 0.40% | 13.5%(-13.1)#1 | 16.9%(-16.5)#41 |
| 2. | Somerville Borough | 0.43% | 13.5%(-13.1)#2 | 16.9%(-16.5)#46 |
| 3. | Upper Montclair | 0.49% | 13.5%(-13.0)#3 | 16.9%(-16.5)#60 |
| 4. | Stanhope Borough | 0.53% | 13.5%(-13.0)#4 | 16.9%(-16.4)#70 |
| 5. | Manasquan Borough | 0.56% | 13.5%(-13.0)#5 | 16.9%(-16.4)#78 |
| 6. | Ringwood Borough | 0.60% | 13.5%(-12.9)#6 | 16.9%(-16.3)#99 |
| 7. | Allentown Borough | 0.63% | 13.5%(-12.9)#7 | 16.9%(-16.3)#110 |
| 8. | Dayton | 0.65% | 13.5%(-12.9)#8 | 16.9%(-16.3)#118 |
| 9. | Cedar Knolls | 0.75% | 13.5%(-12.8)#9 | 16.9%(-16.2)#155 |
| 10. | Oakland Borough | 0.79% | 13.5%(-12.7)#10 | 16.9%(-16.1)#167 |
| 11. | Preakness | 0.79% | 13.5%(-12.7)#11 | 16.9%(-16.1)#168 |
| 12. | Franklin Borough | 0.80% | 13.5%(-12.7)#12 | 16.9%(-16.1)#170 |
| 13. | Park Ridge Borough | 0.81% | 13.5%(-12.7)#13 | 16.9%(-16.1)#176 |
| 14. | New Milford Borough | 0.83% | 13.5%(-12.7)#14 | 16.9%(-16.1)#192 |
| 15. | Gibbsboro Borough | 0.85% | 13.5%(-12.7)#15 | 16.9%(-16.1)#205 |
| 16. | Westfield | 0.86% | 13.5%(-12.7)#16 | 16.9%(-16.1)#214 |
| 17. | Chatham Borough | 0.91% | 13.5%(-12.6)#17 | 16.9%(-16.0)#244 |
| 18. | Keyport Borough | 0.94% | 13.5%(-12.6)#18 | 16.9%(-16.0)#252 |
| 19. | Milltown Borough | 0.97% | 13.5%(-12.6)#19 | 16.9%(-16.0)#259 |
| 20. | Blackwells Mills | 0.98% | 13.5%(-12.5)#20 | 16.9%(-16.0)#268 |
| 21. | Martinsville | 1.0% | 13.5%(-12.5)#21 | 16.9%(-15.9)#297 |
| 22. | New Providence Borough | 1.0% | 13.5%(-12.5)#22 | 16.9%(-15.9)#299 |
| 23. | West Freehold | 1.1% | 13.5%(-12.5)#23 | 16.9%(-15.9)#322 |
| 24. | Ramsey Borough | 1.1% | 13.5%(-12.4)#24 | 16.9%(-15.9)#331 |
| 25. | Woodcliff Lake Borough | 1.1% | 13.5%(-12.4)#25 | 16.9%(-15.8)#337 |
| 26. | Chester Borough | 1.2% | 13.5%(-12.4)#26 | 16.9%(-15.8)#370 |
| 27. | Mendham Borough | 1.3% | 13.5%(-12.3)#27 | 16.9%(-15.7)#422 |
| 28. | Ridgewood | 1.3% | 13.5%(-12.3)#28 | 16.9%(-15.7)#424 |
| 29. | Mercerville | 1.3% | 13.5%(-12.3)#29 | 16.9%(-15.7)#430 |
| 30. | Metuchen Borough | 1.3% | 13.5%(-12.2)#30 | 16.9%(-15.6)#443 |
| 31. | Marlton | 1.3% | 13.5%(-12.2)#31 | 16.9%(-15.6)#457 |
| 32. | Lake Mohawk | 1.3% | 13.5%(-12.2)#32 | 16.9%(-15.6)#465 |
| 33. | Hillsdale Borough | 1.4% | 13.5%(-12.1)#33 | 16.9%(-15.6)#484 |
| 34. | Old Tappan Borough | 1.4% | 13.5%(-12.1)#34 | 16.9%(-15.6)#488 |
| 35. | Bordentown | 1.4% | 13.5%(-12.1)#35 | 16.9%(-15.5)#498 |
| 36. | Brookdale | 1.4% | 13.5%(-12.1)#36 | 16.9%(-15.5)#509 |
| 37. | Audubon Borough | 1.4% | 13.5%(-12.1)#37 | 16.9%(-15.5)#528 |
| 38. | Hamilton Square | 1.5% | 13.5%(-12.1)#38 | 16.9%(-15.5)#540 |
| 39. | Haddonfield Borough | 1.5% | 13.5%(-12.0)#39 | 16.9%(-15.4)#567 |
| 40. | Garwood Borough | 1.5% | 13.5%(-12.0)#40 | 16.9%(-15.4)#571 |
| 41. | Fanwood Borough | 1.5% | 13.5%(-12.0)#41 | 16.9%(-15.4)#588 |
| 42. | River Edge Borough | 1.6% | 13.5%(-12.0)#42 | 16.9%(-15.4)#595 |
| 43. | Emerson Borough | 1.6% | 13.5%(-11.9)#43 | 16.9%(-15.3)#640 |
| 44. | Laurence Harbor | 1.6% | 13.5%(-11.9)#44 | 16.9%(-15.3)#642 |
| 45. | Secaucus | 1.7% | 13.5%(-11.8)#45 | 16.9%(-15.3)#682 |
| 46. | Wanamassa | 1.7% | 13.5%(-11.8)#46 | 16.9%(-15.2)#709 |
| 47. | Milford Borough | 1.7% | 13.5%(-11.8)#47 | 16.9%(-15.2)#719 |
| 48. | Millington | 1.8% | 13.5%(-11.8)#48 | 16.9%(-15.2)#732 |
| 49. | Echelon | 1.8% | 13.5%(-11.7)#49 | 16.9%(-15.2)#750 |
| 50. | Westmont | 1.9% | 13.5%(-11.6)#50 | 16.9%(-15.0)#831 |
| 51. | Roosevelt Borough | 1.9% | 13.5%(-11.6)#51 | 16.9%(-15.0)#862 |
| 52. | Waldwick Borough | 2.0% | 13.5%(-11.6)#52 | 16.9%(-15.0)#885 |
| 53. | Flemington Borough | 2.0% | 13.5%(-11.6)#53 | 16.9%(-15.0)#888 |
| 54. | Madison Borough | 2.0% | 13.5%(-11.5)#54 | 16.9%(-15.0)#903 |
| 55. | Pine Beach Borough | 2.0% | 13.5%(-11.5)#55 | 16.9%(-15.0)#904 |
| 56. | Mcguire Afb | 2.0% | 13.5%(-11.5)#56 | 16.9%(-14.9)#908 |
| 57. | Cape May | 2.1% | 13.5%(-11.4)#57 | 16.9%(-14.8)#993 |
| 58. | Lebanon Borough | 2.1% | 13.5%(-11.4)#58 | 16.9%(-14.8)#998 |
| 59. | Lake Hiawatha | 2.1% | 13.5%(-11.4)#59 | 16.9%(-14.8)#1,005 |
| 60. | Rutherford Borough | 2.1% | 13.5%(-11.4)#60 | 16.9%(-14.8)#1,010 |
| 61. | Millstone Borough | 2.2% | 13.5%(-11.3)#61 | 16.9%(-14.8)#1,027 |
| 62. | Oceanport Borough | 2.2% | 13.5%(-11.3)#62 | 16.9%(-14.8)#1,038 |
| 63. | Franklin Lakes Borough | 2.2% | 13.5%(-11.3)#63 | 16.9%(-14.7)#1,042 |
| 64. | Boonton | 2.3% | 13.5%(-11.2)#64 | 16.9%(-14.6)#1,110 |
| 65. | Yorketown | 2.3% | 13.5%(-11.2)#65 | 16.9%(-14.6)#1,111 |
| 66. | Oradell Borough | 2.3% | 13.5%(-11.2)#66 | 16.9%(-14.6)#1,121 |
| 67. | Riverton Borough | 2.4% | 13.5%(-11.1)#67 | 16.9%(-14.5)#1,165 |
| 68. | Heathcote | 2.5% | 13.5%(-11.1)#68 | 16.9%(-14.5)#1,198 |
| 69. | Point Pleasant Borough | 2.5% | 13.5%(-11.1)#69 | 16.9%(-14.5)#1,200 |
| 70. | Barnegat | 2.5% | 13.5%(-11.1)#70 | 16.9%(-14.5)#1,204 |
| 71. | Glendora | 2.5% | 13.5%(-11.0)#71 | 16.9%(-14.5)#1,219 |
| 72. | Ledgewood | 2.5% | 13.5%(-11.0)#72 | 16.9%(-14.4)#1,237 |
| 73. | Ridgefield Borough | 2.6% | 13.5%(-11.0)#73 | 16.9%(-14.4)#1,294 |
| 74. | Westwood Borough | 2.6% | 13.5%(-10.9)#74 | 16.9%(-14.3)#1,319 |
| 75. | Princeton | 2.6% | 13.5%(-10.9)#75 | 16.9%(-14.3)#1,334 |
| 76. | Bradley Gardens | 2.6% | 13.5%(-10.9)#76 | 16.9%(-14.3)#1,342 |
| 77. | Montvale Borough | 2.6% | 13.5%(-10.9)#77 | 16.9%(-14.3)#1,343 |
| 78. | Maywood Borough | 2.7% | 13.5%(-10.9)#78 | 16.9%(-14.3)#1,370 |
| 79. | Ocean Acres | 2.7% | 13.5%(-10.9)#79 | 16.9%(-14.3)#1,381 |
| 80. | Florham Park Borough | 2.7% | 13.5%(-10.8)#80 | 16.9%(-14.3)#1,385 |
| 81. | Clinton | 2.7% | 13.5%(-10.8)#81 | 16.9%(-14.2)#1,400 |
| 82. | Totowa Borough | 2.7% | 13.5%(-10.8)#82 | 16.9%(-14.2)#1,416 |
| 83. | Springdale | 2.7% | 13.5%(-10.8)#83 | 16.9%(-14.2)#1,422 |
| 84. | Princeton Meadows | 2.7% | 13.5%(-10.8)#84 | 16.9%(-14.2)#1,423 |
| 85. | Northfield | 2.7% | 13.5%(-10.8)#85 | 16.9%(-14.2)#1,433 |
| 86. | The Hills | 2.7% | 13.5%(-10.8)#86 | 16.9%(-14.2)#1,434 |
| 87. | Shrewsbury Borough | 2.8% | 13.5%(-10.7)#87 | 16.9%(-14.1)#1,468 |
| 88. | Ramtown | 2.8% | 13.5%(-10.7)#88 | 16.9%(-14.1)#1,469 |
| 89. | Greentree | 2.8% | 13.5%(-10.7)#89 | 16.9%(-14.1)#1,478 |
| 90. | Belle Mead | 2.8% | 13.5%(-10.7)#90 | 16.9%(-14.1)#1,484 |
| 91. | Edgewater Borough | 2.9% | 13.5%(-10.7)#91 | 16.9%(-14.1)#1,511 |
| 92. | Whippany | 2.9% | 13.5%(-10.7)#92 | 16.9%(-14.1)#1,516 |
| 93. | Eatontown Borough | 2.9% | 13.5%(-10.7)#93 | 16.9%(-14.1)#1,518 |
| 94. | Parsippany | 2.9% | 13.5%(-10.6)#94 | 16.9%(-14.0)#1,554 |
| 95. | Woodbury Heights Borough | 3.1% | 13.5%(-10.4)#95 | 16.9%(-13.9)#1,663 |
| 96. | Byram Center | 3.1% | 13.5%(-10.4)#96 | 16.9%(-13.8)#1,692 |
| 97. | Lincoln Park Borough | 3.2% | 13.5%(-10.3)#97 | 16.9%(-13.8)#1,736 |
| 98. | Runnemede Borough | 3.2% | 13.5%(-10.3)#98 | 16.9%(-13.7)#1,751 |
| 99. | Tenafly Borough | 3.2% | 13.5%(-10.3)#99 | 16.9%(-13.7)#1,762 |
| 100. | Short Hills | 3.2% | 13.5%(-10.3)#100 | 16.9%(-13.7)#1,775 |
Common Questions
What are the Top 10 Cities with the Lowest Poverty Level Among Children Under the Age of 16 in New Jersey?
Top 10 Cities with the Lowest Poverty Level Among Children Under the Age of 16 in New Jersey are:
#1
0.49%
#2
0.65%
#3
0.86%
#4
0.98%
#5
1.0%
#6
1.1%
#7
1.3%
#8
1.3%
#9
1.3%
#10
1.3%
What city has the Lowest Poverty Level Among Children Under the Age of 16 in New Jersey?
Upper Montclair has the Lowest Poverty Level Among Children Under the Age of 16 in New Jersey with 0.49%.
What is the Poverty Level Among Children Under the Age of 16 in the State of New Jersey?
Poverty Level Among Children Under the Age of 16 in New Jersey is 13.5%.
What is the Poverty Level Among Children Under the Age of 16 in the United States?
Poverty Level Among Children Under the Age of 16 in the United States is 16.9%.