Cities with the Highest Percentage of Nicaraguan Population in New Jersey
RELATED REPORTS & OPTIONS
Nicaraguan
New Jersey
Compare Cities
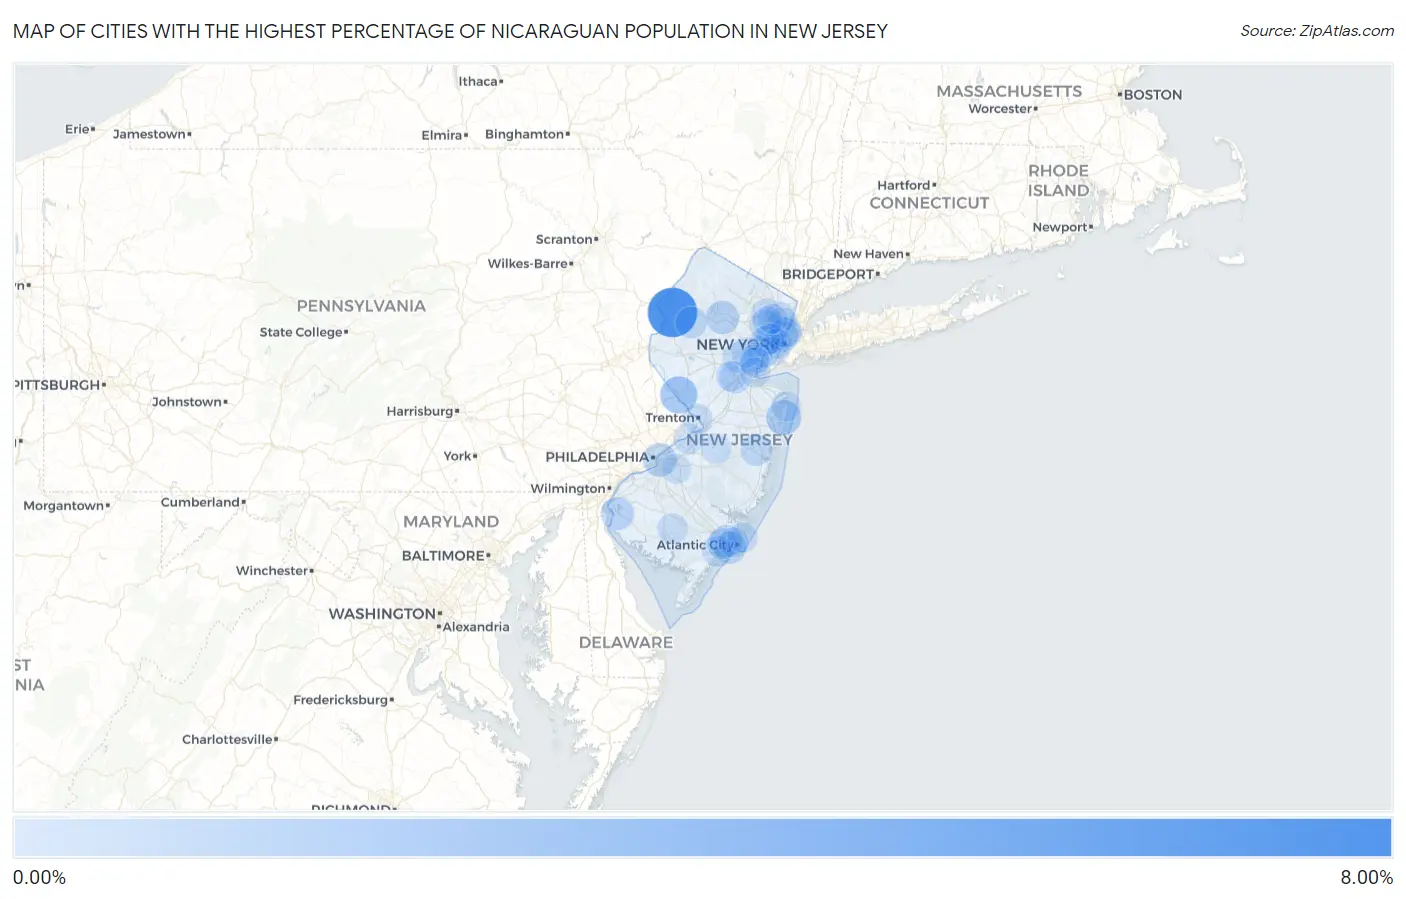
Map of Cities with the Highest Percentage of Nicaraguan Population in New Jersey
0.00%
8.00%
Cities with the Highest Percentage of Nicaraguan Population in New Jersey
| City | Nicaraguan | vs State | vs National | |
| 1. | Mount Hermon | 6.96% | 0.11%(+6.84)#1 | 0.13%(+6.82)#26 |
| 2. | Woodlynne Borough | 2.51% | 0.11%(+2.40)#2 | 0.13%(+2.38)#109 |
| 3. | Lambertville | 2.40% | 0.11%(+2.28)#3 | 0.13%(+2.27)#115 |
| 4. | Dunellen Borough | 2.21% | 0.11%(+2.10)#4 | 0.13%(+2.08)#130 |
| 5. | Asbury Park | 1.67% | 0.11%(+1.55)#5 | 0.13%(+1.53)#179 |
| 6. | Riverton Borough | 1.48% | 0.11%(+1.37)#6 | 0.13%(+1.35)#208 |
| 7. | Ridgefield Borough | 1.40% | 0.11%(+1.29)#7 | 0.13%(+1.27)#225 |
| 8. | Frenchtown Borough | 1.34% | 0.11%(+1.23)#8 | 0.13%(+1.21)#245 |
| 9. | Rocky Hill Borough | 1.26% | 0.11%(+1.14)#9 | 0.13%(+1.13)#262 |
| 10. | Guttenberg | 1.22% | 0.11%(+1.11)#10 | 0.13%(+1.09)#266 |
| 11. | Camden | 1.22% | 0.11%(+1.10)#11 | 0.13%(+1.08)#267 |
| 12. | Westwood Borough | 1.14% | 0.11%(+1.02)#12 | 0.13%(+1.01)#282 |
| 13. | Dover | 1.10% | 0.11%(+0.987)#13 | 0.13%(+0.968)#297 |
| 14. | Watsessing | 1.04% | 0.11%(+0.921)#14 | 0.13%(+0.903)#309 |
| 15. | Salem | 0.96% | 0.11%(+0.850)#15 | 0.13%(+0.832)#329 |
| 16. | Pleasantville | 0.92% | 0.11%(+0.804)#16 | 0.13%(+0.786)#345 |
| 17. | Roselle Park Borough | 0.91% | 0.11%(+0.795)#17 | 0.13%(+0.776)#347 |
| 18. | Ventnor City | 0.83% | 0.11%(+0.714)#18 | 0.13%(+0.696)#389 |
| 19. | Franklin Borough | 0.73% | 0.11%(+0.615)#19 | 0.13%(+0.596)#431 |
| 20. | Elizabeth | 0.69% | 0.11%(+0.577)#20 | 0.13%(+0.558)#450 |
| 21. | Lakehurst Borough | 0.64% | 0.11%(+0.526)#21 | 0.13%(+0.507)#486 |
| 22. | Hackettstown | 0.60% | 0.11%(+0.488)#22 | 0.13%(+0.470)#511 |
| 23. | New Brunswick | 0.60% | 0.11%(+0.483)#23 | 0.13%(+0.464)#513 |
| 24. | Far Hills Borough | 0.57% | 0.11%(+0.458)#24 | 0.13%(+0.440)#527 |
| 25. | Pine Lake Park | 0.55% | 0.11%(+0.431)#25 | 0.13%(+0.412)#553 |
| 26. | Lindenwold Borough | 0.53% | 0.11%(+0.415)#26 | 0.13%(+0.396)#571 |
| 27. | Florham Park Borough | 0.52% | 0.11%(+0.409)#27 | 0.13%(+0.391)#577 |
| 28. | Elmwood Park Borough | 0.50% | 0.11%(+0.388)#28 | 0.13%(+0.370)#597 |
| 29. | Menlo Park Terrace | 0.48% | 0.11%(+0.366)#29 | 0.13%(+0.348)#617 |
| 30. | Cliffside Park Borough | 0.47% | 0.11%(+0.351)#30 | 0.13%(+0.333)#634 |
| 31. | Brooklawn Borough | 0.42% | 0.11%(+0.308)#31 | 0.13%(+0.289)#676 |
| 32. | Mckee | 0.42% | 0.11%(+0.303)#32 | 0.13%(+0.285)#678 |
| 33. | Brookdale | 0.38% | 0.11%(+0.263)#33 | 0.13%(+0.245)#730 |
| 34. | Paulsboro Borough | 0.37% | 0.11%(+0.256)#34 | 0.13%(+0.238)#737 |
| 35. | Union City | 0.35% | 0.11%(+0.238)#35 | 0.13%(+0.219)#762 |
| 36. | Hi Nella Borough | 0.34% | 0.11%(+0.225)#36 | 0.13%(+0.206)#793 |
| 37. | Gibbsboro Borough | 0.31% | 0.11%(+0.192)#37 | 0.13%(+0.174)#853 |
| 38. | Somers Point | 0.30% | 0.11%(+0.181)#38 | 0.13%(+0.162)#880 |
| 39. | Woodland Park Borough | 0.29% | 0.11%(+0.179)#39 | 0.13%(+0.160)#885 |
| 40. | Bayonne | 0.28% | 0.11%(+0.160)#40 | 0.13%(+0.142)#922 |
| 41. | Bound Brook Borough | 0.27% | 0.11%(+0.154)#41 | 0.13%(+0.135)#932 |
| 42. | Northfield | 0.24% | 0.11%(+0.122)#42 | 0.13%(+0.104)#1,016 |
| 43. | Vineland | 0.24% | 0.11%(+0.122)#43 | 0.13%(+0.104)#1,018 |
| 44. | Burlington | 0.23% | 0.11%(+0.119)#44 | 0.13%(+0.101)#1,028 |
| 45. | Collingswood Borough | 0.23% | 0.11%(+0.112)#45 | 0.13%(+0.093)#1,044 |
| 46. | Bergenfield Borough | 0.22% | 0.11%(+0.108)#46 | 0.13%(+0.090)#1,058 |
| 47. | Hackensack | 0.22% | 0.11%(+0.108)#47 | 0.13%(+0.090)#1,059 |
| 48. | Bloomingdale Borough | 0.22% | 0.11%(+0.105)#48 | 0.13%(+0.087)#1,067 |
| 49. | Highlands Borough | 0.22% | 0.11%(+0.100)#49 | 0.13%(+0.082)#1,075 |
| 50. | Paterson | 0.21% | 0.11%(+0.096)#50 | 0.13%(+0.078)#1,087 |
| 51. | Plainfield | 0.20% | 0.11%(+0.088)#51 | 0.13%(+0.069)#1,122 |
| 52. | Runnemede Borough | 0.18% | 0.11%(+0.066)#52 | 0.13%(+0.047)#1,204 |
| 53. | Sicklerville | 0.16% | 0.11%(+0.049)#53 | 0.13%(+0.030)#1,254 |
| 54. | Lincoln Park Borough | 0.16% | 0.11%(+0.041)#54 | 0.13%(+0.023)#1,292 |
| 55. | Fort Lee Borough | 0.16% | 0.11%(+0.041)#55 | 0.13%(+0.022)#1,294 |
| 56. | Oakland Borough | 0.15% | 0.11%(+0.034)#56 | 0.13%(+0.016)#1,314 |
| 57. | Pompton Plains | 0.15% | 0.11%(+0.031)#57 | 0.13%(+0.013)#1,325 |
| 58. | Ridgefield Park | 0.13% | 0.11%(+0.014)#58 | 0.13%(-0.004)#1,391 |
| 59. | East Franklin | 0.13% | 0.11%(+0.014)#59 | 0.13%(-0.004)#1,392 |
| 60. | Harrison | 0.12% | 0.11%(+0.005)#60 | 0.13%(-0.014)#1,431 |
| 61. | Sayreville Borough | 0.12% | 0.11%(+0.003)#61 | 0.13%(-0.016)#1,443 |
| 62. | Brigantine | 0.12% | 0.11%(+0.001)#62 | 0.13%(-0.018)#1,452 |
| 63. | River Edge Borough | 0.11% | 0.11%(-0.007)#63 | 0.13%(-0.025)#1,502 |
| 64. | Middlesex Borough | 0.10% | 0.11%(-0.012)#64 | 0.13%(-0.030)#1,523 |
| 65. | Barrington Borough | 0.100% | 0.11%(-0.015)#65 | 0.13%(-0.034)#1,534 |
| 66. | Kearny | 0.100% | 0.11%(-0.015)#66 | 0.13%(-0.034)#1,535 |
| 67. | Jersey City | 0.096% | 0.11%(-0.019)#67 | 0.13%(-0.037)#1,562 |
| 68. | Linden | 0.087% | 0.11%(-0.027)#68 | 0.13%(-0.046)#1,616 |
| 69. | Trenton | 0.087% | 0.11%(-0.028)#69 | 0.13%(-0.047)#1,619 |
| 70. | Lodi Borough | 0.081% | 0.11%(-0.034)#70 | 0.13%(-0.052)#1,663 |
| 71. | Fort Dix | 0.077% | 0.11%(-0.038)#71 | 0.13%(-0.056)#1,689 |
| 72. | Newark | 0.077% | 0.11%(-0.038)#72 | 0.13%(-0.056)#1,690 |
| 73. | Metuchen Borough | 0.074% | 0.11%(-0.041)#73 | 0.13%(-0.060)#1,718 |
| 74. | Rahway | 0.071% | 0.11%(-0.044)#74 | 0.13%(-0.063)#1,742 |
| 75. | Palmyra Borough | 0.067% | 0.11%(-0.048)#75 | 0.13%(-0.066)#1,771 |
| 76. | Glassboro Borough | 0.065% | 0.11%(-0.050)#76 | 0.13%(-0.068)#1,791 |
| 77. | West New York | 0.065% | 0.11%(-0.050)#77 | 0.13%(-0.068)#1,796 |
| 78. | Westfield | 0.055% | 0.11%(-0.060)#78 | 0.13%(-0.078)#1,874 |
| 79. | Perth Amboy | 0.054% | 0.11%(-0.061)#79 | 0.13%(-0.079)#1,883 |
| 80. | Palisades Park Borough | 0.049% | 0.11%(-0.065)#80 | 0.13%(-0.084)#1,924 |
| 81. | Tinton Falls Borough | 0.047% | 0.11%(-0.068)#81 | 0.13%(-0.086)#1,949 |
| 82. | Avenel | 0.046% | 0.11%(-0.068)#82 | 0.13%(-0.087)#1,952 |
| 83. | Long Branch | 0.031% | 0.11%(-0.084)#83 | 0.13%(-0.102)#2,089 |
| 84. | Atlantic City | 0.026% | 0.11%(-0.089)#84 | 0.13%(-0.107)#2,125 |
| 85. | Clifton | 0.019% | 0.11%(-0.096)#85 | 0.13%(-0.114)#2,196 |
| 86. | Garfield | 0.015% | 0.11%(-0.099)#86 | 0.13%(-0.118)#2,229 |
| 87. | Springdale | 0.0066% | 0.11%(-0.108)#87 | 0.13%(-0.127)#2,300 |
Common Questions
What are the Top 10 Cities with the Highest Percentage of Nicaraguan Population in New Jersey?
Top 10 Cities with the Highest Percentage of Nicaraguan Population in New Jersey are:
#1
6.96%
#2
2.40%
#3
1.67%
#4
1.22%
#5
1.22%
#6
1.10%
#7
0.96%
#8
0.92%
#9
0.83%
#10
0.69%
What city has the Highest Percentage of Nicaraguan Population in New Jersey?
Mount Hermon has the Highest Percentage of Nicaraguan Population in New Jersey with 6.96%.
What is the Percentage of Nicaraguan Population in the State of New Jersey?
Percentage of Nicaraguan Population in New Jersey is 0.11%.
What is the Percentage of Nicaraguan Population in the United States?
Percentage of Nicaraguan Population in the United States is 0.13%.