Cities with the Highest Percentage of Immigrants from Ukraine in New Jersey
RELATED REPORTS & OPTIONS
Ukraine
New Jersey
Compare Cities
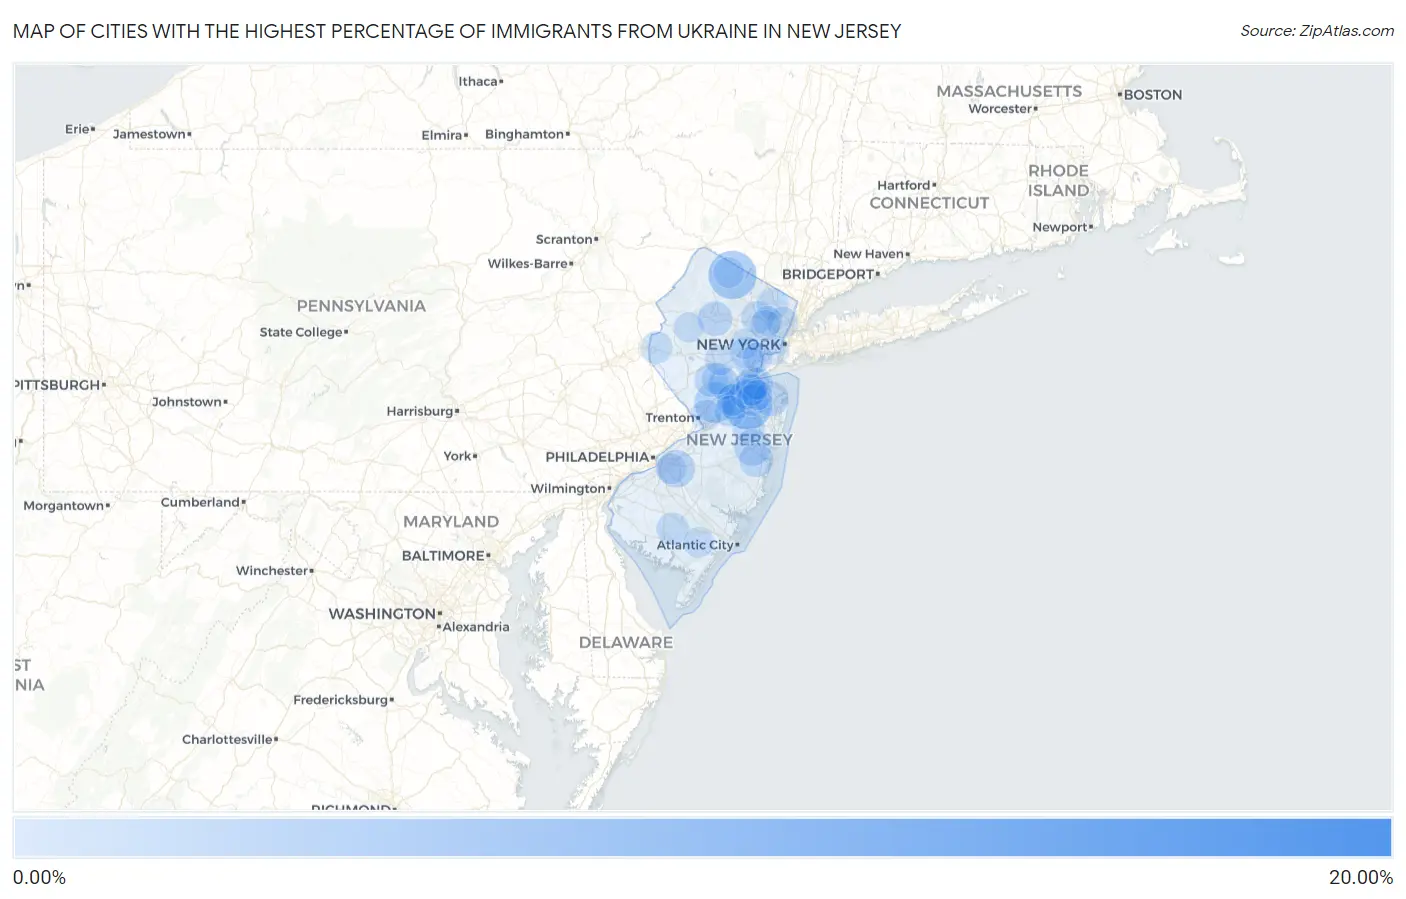
Map of Cities with the Highest Percentage of Immigrants from Ukraine in New Jersey
0.00%
20.00%
Cities with the Highest Percentage of Immigrants from Ukraine in New Jersey
| City | Ukraine | vs State | vs National | |
| 1. | Lebanon Borough | 15.29% | 0.25%(+15.0)#1 | 0.12%(+15.2)#4 |
| 2. | Connecticut Farms | 6.56% | 0.25%(+6.31)#2 | 0.12%(+6.44)#15 |
| 3. | East Vineland | 5.35% | 0.25%(+5.10)#3 | 0.12%(+5.23)#26 |
| 4. | Yorketown | 4.83% | 0.25%(+4.58)#4 | 0.12%(+4.71)#38 |
| 5. | Towaco | 4.79% | 0.25%(+4.54)#5 | 0.12%(+4.67)#39 |
| 6. | Highland Lakes | 4.55% | 0.25%(+4.30)#6 | 0.12%(+4.43)#40 |
| 7. | Helmetta Borough | 3.61% | 0.25%(+3.36)#7 | 0.12%(+3.49)#57 |
| 8. | Millington | 3.20% | 0.25%(+2.95)#8 | 0.12%(+3.08)#69 |
| 9. | Princeton Junction | 2.92% | 0.25%(+2.67)#9 | 0.12%(+2.80)#77 |
| 10. | Fair Lawn Borough | 2.65% | 0.25%(+2.40)#10 | 0.12%(+2.53)#97 |
| 11. | Englishtown Borough | 2.21% | 0.25%(+1.96)#11 | 0.12%(+2.09)#122 |
| 12. | Englewood Cliffs Borough | 2.11% | 0.25%(+1.87)#12 | 0.12%(+2.00)#130 |
| 13. | Springdale | 2.09% | 0.25%(+1.84)#13 | 0.12%(+1.97)#132 |
| 14. | Lake Como Borough | 1.99% | 0.25%(+1.74)#14 | 0.12%(+1.87)#137 |
| 15. | Wallington Borough | 1.99% | 0.25%(+1.74)#15 | 0.12%(+1.87)#139 |
| 16. | Tenafly Borough | 1.92% | 0.25%(+1.67)#16 | 0.12%(+1.80)#148 |
| 17. | Leisure Knoll | 1.83% | 0.25%(+1.58)#17 | 0.12%(+1.71)#165 |
| 18. | Whittingham | 1.82% | 0.25%(+1.57)#18 | 0.12%(+1.70)#167 |
| 19. | Old Bridge | 1.67% | 0.25%(+1.43)#19 | 0.12%(+1.56)#189 |
| 20. | Cliffside Park Borough | 1.59% | 0.25%(+1.34)#20 | 0.12%(+1.47)#206 |
| 21. | Lincroft | 1.52% | 0.25%(+1.27)#21 | 0.12%(+1.40)#219 |
| 22. | Whippany | 1.50% | 0.25%(+1.25)#22 | 0.12%(+1.38)#221 |
| 23. | Seaside Heights Borough | 1.48% | 0.25%(+1.23)#23 | 0.12%(+1.36)#223 |
| 24. | Hasbrouck Heights Borough | 1.47% | 0.25%(+1.23)#24 | 0.12%(+1.36)#224 |
| 25. | Kenvil | 1.41% | 0.25%(+1.16)#25 | 0.12%(+1.29)#236 |
| 26. | Keasbey | 1.38% | 0.25%(+1.14)#26 | 0.12%(+1.27)#241 |
| 27. | Bedminster | 1.37% | 0.25%(+1.12)#27 | 0.12%(+1.26)#244 |
| 28. | Holiday Heights | 1.32% | 0.25%(+1.07)#28 | 0.12%(+1.20)#256 |
| 29. | Madison Park | 1.23% | 0.25%(+0.984)#29 | 0.12%(+1.11)#280 |
| 30. | Belle Mead | 1.18% | 0.25%(+0.930)#30 | 0.12%(+1.06)#295 |
| 31. | Springfield | 1.16% | 0.25%(+0.918)#31 | 0.12%(+1.05)#300 |
| 32. | Troy Hills | 1.15% | 0.25%(+0.906)#32 | 0.12%(+1.04)#304 |
| 33. | Keyport Borough | 1.11% | 0.25%(+0.867)#33 | 0.12%(+0.997)#316 |
| 34. | Fort Lee Borough | 1.07% | 0.25%(+0.819)#34 | 0.12%(+0.950)#328 |
| 35. | Demarest Borough | 1.03% | 0.25%(+0.788)#35 | 0.12%(+0.919)#345 |
| 36. | Manville Borough | 1.03% | 0.25%(+0.782)#36 | 0.12%(+0.912)#349 |
| 37. | West Berlin | 1.01% | 0.25%(+0.766)#37 | 0.12%(+0.897)#353 |
| 38. | Elmwood Park Borough | 1.00% | 0.25%(+0.756)#38 | 0.12%(+0.886)#355 |
| 39. | Singac | 0.99% | 0.25%(+0.741)#39 | 0.12%(+0.872)#360 |
| 40. | Gillette | 0.98% | 0.25%(+0.734)#40 | 0.12%(+0.864)#366 |
| 41. | Vineland | 0.92% | 0.25%(+0.675)#41 | 0.12%(+0.805)#384 |
| 42. | Mount Arlington Borough | 0.89% | 0.25%(+0.641)#42 | 0.12%(+0.771)#396 |
| 43. | Greenwich | 0.87% | 0.25%(+0.626)#43 | 0.12%(+0.757)#404 |
| 44. | Vista Center | 0.81% | 0.25%(+0.568)#44 | 0.12%(+0.698)#433 |
| 45. | Highland Park Borough | 0.81% | 0.25%(+0.561)#45 | 0.12%(+0.691)#440 |
| 46. | Ridgewood | 0.77% | 0.25%(+0.522)#46 | 0.12%(+0.652)#460 |
| 47. | Rossmoor | 0.76% | 0.25%(+0.511)#47 | 0.12%(+0.642)#469 |
| 48. | Franklin Park | 0.74% | 0.25%(+0.499)#48 | 0.12%(+0.629)#477 |
| 49. | South River Borough | 0.73% | 0.25%(+0.481)#49 | 0.12%(+0.612)#487 |
| 50. | Robertsville | 0.73% | 0.25%(+0.481)#50 | 0.12%(+0.612)#488 |
| 51. | Laurence Harbor | 0.72% | 0.25%(+0.471)#51 | 0.12%(+0.601)#495 |
| 52. | Glen Rock Borough | 0.71% | 0.25%(+0.465)#52 | 0.12%(+0.596)#500 |
| 53. | Westfield | 0.70% | 0.25%(+0.458)#53 | 0.12%(+0.588)#509 |
| 54. | Metuchen Borough | 0.70% | 0.25%(+0.456)#54 | 0.12%(+0.586)#510 |
| 55. | Pines Lake | 0.69% | 0.25%(+0.446)#55 | 0.12%(+0.576)#518 |
| 56. | Ridgefield Park | 0.69% | 0.25%(+0.445)#56 | 0.12%(+0.576)#520 |
| 57. | Brownville | 0.69% | 0.25%(+0.441)#57 | 0.12%(+0.571)#523 |
| 58. | New Milford Borough | 0.69% | 0.25%(+0.441)#58 | 0.12%(+0.571)#525 |
| 59. | Blackwells Mills | 0.69% | 0.25%(+0.441)#59 | 0.12%(+0.571)#526 |
| 60. | Edgewater Borough | 0.68% | 0.25%(+0.435)#60 | 0.12%(+0.565)#532 |
| 61. | Saddle River Borough | 0.65% | 0.25%(+0.408)#61 | 0.12%(+0.538)#553 |
| 62. | Laurel Springs Borough | 0.65% | 0.25%(+0.403)#62 | 0.12%(+0.533)#558 |
| 63. | Kenilworth Borough | 0.65% | 0.25%(+0.401)#63 | 0.12%(+0.531)#560 |
| 64. | Twin Rivers | 0.64% | 0.25%(+0.392)#64 | 0.12%(+0.523)#570 |
| 65. | Cresskill Borough | 0.63% | 0.25%(+0.380)#65 | 0.12%(+0.510)#577 |
| 66. | Woodland Park Borough | 0.62% | 0.25%(+0.378)#66 | 0.12%(+0.509)#579 |
| 67. | Dumont Borough | 0.62% | 0.25%(+0.370)#67 | 0.12%(+0.500)#587 |
| 68. | Park Ridge Borough | 0.60% | 0.25%(+0.358)#68 | 0.12%(+0.489)#601 |
| 69. | Watchung Borough | 0.59% | 0.25%(+0.346)#69 | 0.12%(+0.476)#612 |
| 70. | Ramsey Borough | 0.57% | 0.25%(+0.324)#70 | 0.12%(+0.454)#637 |
| 71. | Preakness | 0.56% | 0.25%(+0.319)#71 | 0.12%(+0.449)#641 |
| 72. | Vernon Center | 0.54% | 0.25%(+0.290)#72 | 0.12%(+0.420)#677 |
| 73. | Ashland | 0.52% | 0.25%(+0.276)#73 | 0.12%(+0.406)#692 |
| 74. | Mercerville | 0.52% | 0.25%(+0.276)#74 | 0.12%(+0.406)#693 |
| 75. | Estell Manor | 0.52% | 0.25%(+0.274)#75 | 0.12%(+0.405)#695 |
| 76. | Mount Hope | 0.52% | 0.25%(+0.271)#76 | 0.12%(+0.402)#698 |
| 77. | Montvale Borough | 0.51% | 0.25%(+0.265)#77 | 0.12%(+0.395)#707 |
| 78. | Martinsville | 0.51% | 0.25%(+0.263)#78 | 0.12%(+0.394)#709 |
| 79. | Colonia | 0.51% | 0.25%(+0.260)#79 | 0.12%(+0.390)#715 |
| 80. | Cedar Knolls | 0.50% | 0.25%(+0.256)#80 | 0.12%(+0.386)#720 |
| 81. | Rutherford Borough | 0.50% | 0.25%(+0.255)#81 | 0.12%(+0.385)#722 |
| 82. | Summit | 0.50% | 0.25%(+0.255)#82 | 0.12%(+0.385)#723 |
| 83. | Pompton Lakes Borough | 0.50% | 0.25%(+0.252)#83 | 0.12%(+0.382)#727 |
| 84. | Bergenfield Borough | 0.49% | 0.25%(+0.239)#84 | 0.12%(+0.370)#736 |
| 85. | Hightstown Borough | 0.48% | 0.25%(+0.231)#85 | 0.12%(+0.362)#746 |
| 86. | Bayonne | 0.48% | 0.25%(+0.229)#86 | 0.12%(+0.359)#754 |
| 87. | Wanaque Borough | 0.47% | 0.25%(+0.226)#87 | 0.12%(+0.357)#759 |
| 88. | New Providence Borough | 0.45% | 0.25%(+0.203)#88 | 0.12%(+0.333)#795 |
| 89. | Upper Saddle River Borough | 0.43% | 0.25%(+0.187)#89 | 0.12%(+0.317)#818 |
| 90. | Wrightstown Borough | 0.43% | 0.25%(+0.182)#90 | 0.12%(+0.312)#827 |
| 91. | Brookdale | 0.42% | 0.25%(+0.171)#91 | 0.12%(+0.301)#846 |
| 92. | Lake Hiawatha | 0.41% | 0.25%(+0.161)#92 | 0.12%(+0.292)#873 |
| 93. | Clifton | 0.40% | 0.25%(+0.155)#93 | 0.12%(+0.286)#882 |
| 94. | Freehold Borough | 0.40% | 0.25%(+0.154)#94 | 0.12%(+0.284)#885 |
| 95. | Beattystown | 0.40% | 0.25%(+0.151)#95 | 0.12%(+0.281)#890 |
| 96. | Stanhope Borough | 0.40% | 0.25%(+0.150)#96 | 0.12%(+0.280)#893 |
| 97. | South Bound Brook Borough | 0.39% | 0.25%(+0.147)#97 | 0.12%(+0.277)#897 |
| 98. | Morganville | 0.39% | 0.25%(+0.142)#98 | 0.12%(+0.272)#904 |
| 99. | Linden | 0.39% | 0.25%(+0.140)#99 | 0.12%(+0.271)#907 |
| 100. | Sayreville Borough | 0.39% | 0.25%(+0.139)#100 | 0.12%(+0.270)#910 |
Common Questions
What are the Top 10 Cities with the Highest Percentage of Immigrants from Ukraine in New Jersey?
Top 10 Cities with the Highest Percentage of Immigrants from Ukraine in New Jersey are:
#1
4.83%
#2
4.55%
#3
2.92%
#4
2.09%
#5
1.83%
#6
1.82%
#7
1.67%
#8
1.52%
#9
1.41%
#10
1.32%
What city has the Highest Percentage of Immigrants from Ukraine in New Jersey?
Yorketown has the Highest Percentage of Immigrants from Ukraine in New Jersey with 4.83%.
What is the Percentage of Immigrants from Ukraine in the State of New Jersey?
Percentage of Immigrants from Ukraine in New Jersey is 0.25%.
What is the Percentage of Immigrants from Ukraine in the United States?
Percentage of Immigrants from Ukraine in the United States is 0.12%.