Cities with the Most Immigrants from Ukraine in New Jersey
RELATED REPORTS & OPTIONS
Ukraine
New Jersey
Compare Cities
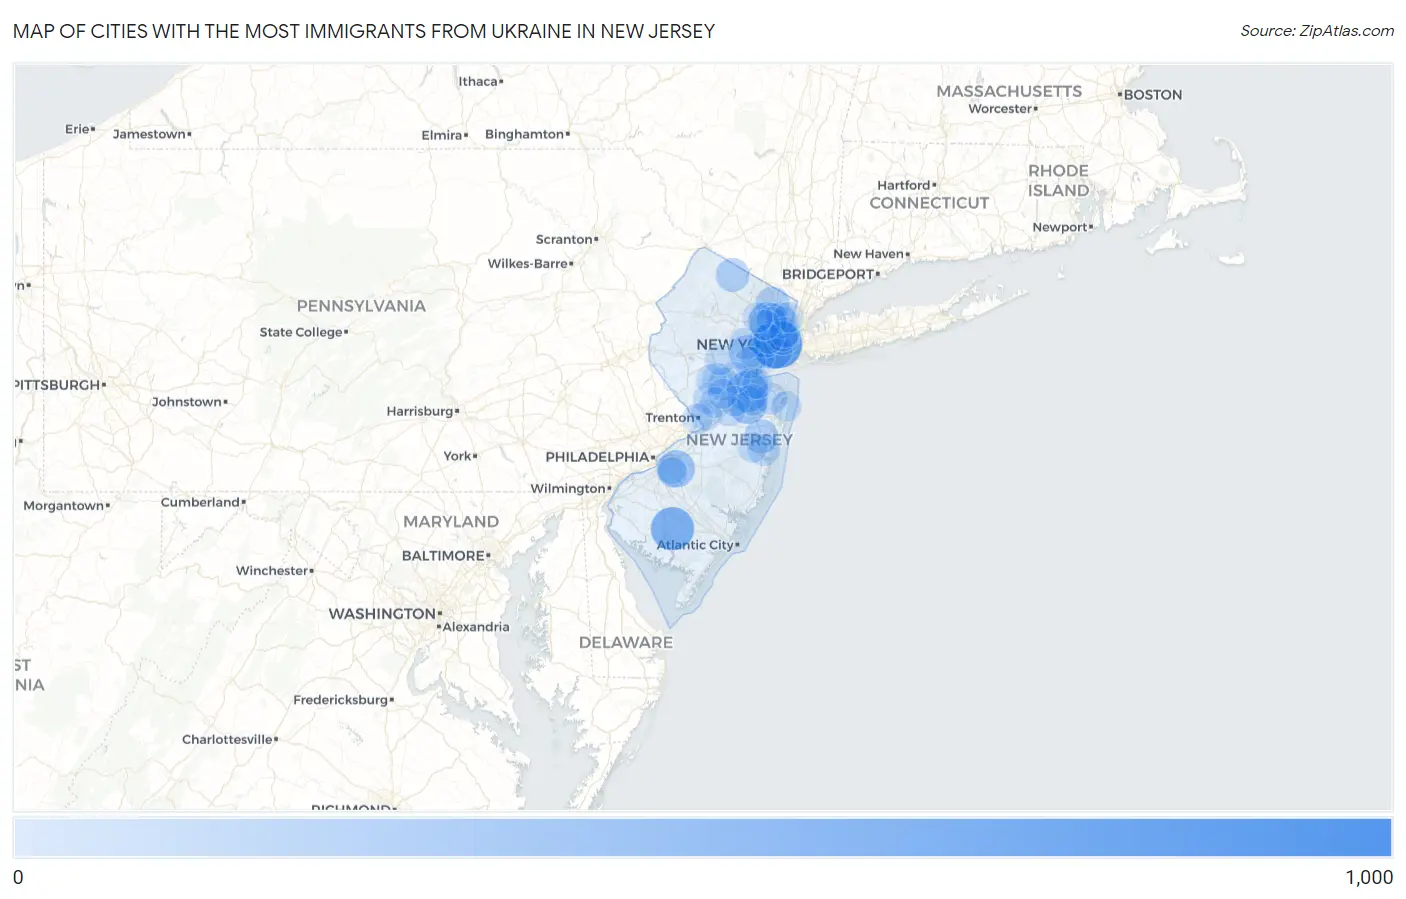
Map of Cities with the Most Immigrants from Ukraine in New Jersey
0
1,000
Cities with the Most Immigrants from Ukraine in New Jersey
| City | Ukraine | vs State | vs National | |
| 1. | Fair Lawn Borough | 926 | 22,760(4.07%)#1 | 383,359(0.24%)#35 |
| 2. | Jersey City | 821 | 22,760(3.61%)#2 | 383,359(0.21%)#42 |
| 3. | Vineland | 560 | 22,760(2.46%)#3 | 383,359(0.15%)#71 |
| 4. | Old Bridge | 470 | 22,760(2.07%)#4 | 383,359(0.12%)#94 |
| 5. | Fort Lee Borough | 424 | 22,760(1.86%)#5 | 383,359(0.11%)#105 |
| 6. | Cliffside Park Borough | 405 | 22,760(1.78%)#6 | 383,359(0.11%)#110 |
| 7. | Clifton | 359 | 22,760(1.58%)#7 | 383,359(0.09%)#134 |
| 8. | Yorketown | 348 | 22,760(1.53%)#8 | 383,359(0.09%)#138 |
| 9. | Bayonne | 335 | 22,760(1.47%)#9 | 383,359(0.09%)#142 |
| 10. | Springdale | 318 | 22,760(1.40%)#10 | 383,359(0.08%)#154 |
| 11. | Tenafly Borough | 293 | 22,760(1.29%)#11 | 383,359(0.08%)#172 |
| 12. | Lebanon Borough | 285 | 22,760(1.25%)#12 | 383,359(0.07%)#178 |
| 13. | Towaco | 266 | 22,760(1.17%)#13 | 383,359(0.07%)#193 |
| 14. | Wallington Borough | 235 | 22,760(1.03%)#14 | 383,359(0.06%)#220 |
| 15. | Westfield | 217 | 22,760(0.95%)#15 | 383,359(0.06%)#236 |
| 16. | Elmwood Park Borough | 213 | 22,760(0.94%)#16 | 383,359(0.06%)#245 |
| 17. | Ridgewood | 200 | 22,760(0.88%)#17 | 383,359(0.05%)#259 |
| 18. | Lakewood | 190 | 22,760(0.83%)#18 | 383,359(0.05%)#268 |
| 19. | Highland Lakes | 186 | 22,760(0.82%)#19 | 383,359(0.05%)#282 |
| 20. | Hasbrouck Heights Borough | 178 | 22,760(0.78%)#20 | 383,359(0.05%)#300 |
| 21. | Sayreville Borough | 174 | 22,760(0.76%)#21 | 383,359(0.05%)#308 |
| 22. | Linden | 168 | 22,760(0.74%)#22 | 383,359(0.04%)#315 |
| 23. | Newark | 154 | 22,760(0.68%)#23 | 383,359(0.04%)#342 |
| 24. | Hoboken | 141 | 22,760(0.62%)#24 | 383,359(0.04%)#367 |
| 25. | Bergenfield Borough | 137 | 22,760(0.60%)#25 | 383,359(0.04%)#381 |
| 26. | Whippany | 133 | 22,760(0.58%)#26 | 383,359(0.03%)#394 |
| 27. | Highland Park Borough | 121 | 22,760(0.53%)#27 | 383,359(0.03%)#433 |
| 28. | South River Borough | 117 | 22,760(0.51%)#28 | 383,359(0.03%)#442 |
| 29. | New Milford Borough | 116 | 22,760(0.51%)#29 | 383,359(0.03%)#444 |
| 30. | Summit | 113 | 22,760(0.50%)#30 | 383,359(0.03%)#456 |
| 31. | Englewood Cliffs Borough | 113 | 22,760(0.50%)#31 | 383,359(0.03%)#458 |
| 32. | Manville Borough | 112 | 22,760(0.49%)#32 | 383,359(0.03%)#462 |
| 33. | Dumont Borough | 111 | 22,760(0.49%)#33 | 383,359(0.03%)#464 |
| 34. | Toms River | 108 | 22,760(0.47%)#34 | 383,359(0.03%)#472 |
| 35. | Preakness | 105 | 22,760(0.46%)#35 | 383,359(0.03%)#494 |
| 36. | Metuchen Borough | 105 | 22,760(0.46%)#36 | 383,359(0.03%)#495 |
| 37. | Lincroft | 103 | 22,760(0.45%)#37 | 383,359(0.03%)#503 |
| 38. | Madison Park | 102 | 22,760(0.45%)#38 | 383,359(0.03%)#506 |
| 39. | Franklin Park | 100 | 22,760(0.44%)#39 | 383,359(0.03%)#515 |
| 40. | Edgewater Borough | 98 | 22,760(0.43%)#40 | 383,359(0.03%)#524 |
| 41. | Rutherford Borough | 94 | 22,760(0.41%)#41 | 383,359(0.02%)#551 |
| 42. | Colonia | 94 | 22,760(0.41%)#42 | 383,359(0.02%)#552 |
| 43. | Millington | 94 | 22,760(0.41%)#43 | 383,359(0.02%)#558 |
| 44. | Robertsville | 92 | 22,760(0.40%)#44 | 383,359(0.02%)#573 |
| 45. | Ridgefield Park | 91 | 22,760(0.40%)#45 | 383,359(0.02%)#576 |
| 46. | Glen Rock Borough | 86 | 22,760(0.38%)#46 | 383,359(0.02%)#602 |
| 47. | Garfield | 84 | 22,760(0.37%)#47 | 383,359(0.02%)#614 |
| 48. | Ramsey Borough | 84 | 22,760(0.37%)#48 | 383,359(0.02%)#617 |
| 49. | Woodland Park Borough | 83 | 22,760(0.36%)#49 | 383,359(0.02%)#622 |
| 50. | Helmetta Borough | 83 | 22,760(0.36%)#50 | 383,359(0.02%)#624 |
| 51. | Keyport Borough | 80 | 22,760(0.35%)#51 | 383,359(0.02%)#645 |
| 52. | Princeton | 79 | 22,760(0.35%)#52 | 383,359(0.02%)#651 |
| 53. | Paramus Borough | 75 | 22,760(0.33%)#53 | 383,359(0.02%)#680 |
| 54. | Mercerville | 75 | 22,760(0.33%)#54 | 383,359(0.02%)#682 |
| 55. | New Brunswick | 73 | 22,760(0.32%)#55 | 383,359(0.02%)#692 |
| 56. | Passaic | 72 | 22,760(0.32%)#56 | 383,359(0.02%)#706 |
| 57. | East Vineland | 72 | 22,760(0.32%)#57 | 383,359(0.02%)#715 |
| 58. | Hackensack | 70 | 22,760(0.31%)#58 | 383,359(0.02%)#731 |
| 59. | Blackwells Mills | 69 | 22,760(0.30%)#59 | 383,359(0.02%)#741 |
| 60. | Belle Mead | 69 | 22,760(0.30%)#60 | 383,359(0.02%)#742 |
| 61. | Carteret Borough | 66 | 22,760(0.29%)#61 | 383,359(0.02%)#766 |
| 62. | Hillsborough | 65 | 22,760(0.29%)#62 | 383,359(0.02%)#782 |
| 63. | Martinsville | 63 | 22,760(0.28%)#63 | 383,359(0.02%)#799 |
| 64. | New Providence Borough | 61 | 22,760(0.27%)#64 | 383,359(0.02%)#814 |
| 65. | Troy Hills | 60 | 22,760(0.26%)#65 | 383,359(0.02%)#829 |
| 66. | Princeton Junction | 59 | 22,760(0.26%)#66 | 383,359(0.02%)#839 |
| 67. | Trenton | 58 | 22,760(0.25%)#67 | 383,359(0.02%)#848 |
| 68. | Union City | 57 | 22,760(0.25%)#68 | 383,359(0.01%)#859 |
| 69. | Long Branch | 57 | 22,760(0.25%)#69 | 383,359(0.01%)#862 |
| 70. | Cresskill Borough | 57 | 22,760(0.25%)#70 | 383,359(0.01%)#863 |
| 71. | West New York | 56 | 22,760(0.25%)#71 | 383,359(0.01%)#872 |
| 72. | Pompton Lakes Borough | 55 | 22,760(0.24%)#72 | 383,359(0.01%)#889 |
| 73. | Park Ridge Borough | 55 | 22,760(0.24%)#73 | 383,359(0.01%)#892 |
| 74. | Kenilworth Borough | 54 | 22,760(0.24%)#74 | 383,359(0.01%)#899 |
| 75. | Wanaque Borough | 53 | 22,760(0.23%)#75 | 383,359(0.01%)#909 |
| 76. | Hopatcong Borough | 52 | 22,760(0.23%)#76 | 383,359(0.01%)#921 |
| 77. | Twin Rivers | 52 | 22,760(0.23%)#77 | 383,359(0.01%)#923 |
| 78. | Mount Arlington Borough | 52 | 22,760(0.23%)#78 | 383,359(0.01%)#925 |
| 79. | Englewood | 51 | 22,760(0.22%)#79 | 383,359(0.01%)#932 |
| 80. | Demarest Borough | 51 | 22,760(0.22%)#80 | 383,359(0.01%)#937 |
| 81. | Freehold Borough | 50 | 22,760(0.22%)#81 | 383,359(0.01%)#950 |
| 82. | Ashland | 49 | 22,760(0.22%)#82 | 383,359(0.01%)#966 |
| 83. | Leisure Knoll | 48 | 22,760(0.21%)#83 | 383,359(0.01%)#982 |
| 84. | Englishtown Borough | 47 | 22,760(0.21%)#84 | 383,359(0.01%)#996 |
| 85. | Parsippany | 46 | 22,760(0.20%)#85 | 383,359(0.01%)#1,002 |
| 86. | Laurence Harbor | 46 | 22,760(0.20%)#86 | 383,359(0.01%)#1,006 |
| 87. | Harrison | 44 | 22,760(0.19%)#87 | 383,359(0.01%)#1,035 |
| 88. | Whittingham | 44 | 22,760(0.19%)#88 | 383,359(0.01%)#1,044 |
| 89. | Brookdale | 43 | 22,760(0.19%)#89 | 383,359(0.01%)#1,059 |
| 90. | Montvale Borough | 43 | 22,760(0.19%)#90 | 383,359(0.01%)#1,061 |
| 91. | Singac | 42 | 22,760(0.18%)#91 | 383,359(0.01%)#1,082 |
| 92. | Lake Hiawatha | 41 | 22,760(0.18%)#92 | 383,359(0.01%)#1,097 |
| 93. | The Hills | 40 | 22,760(0.18%)#93 | 383,359(0.01%)#1,109 |
| 94. | Echelon | 39 | 22,760(0.17%)#94 | 383,359(0.01%)#1,126 |
| 95. | Bound Brook Borough | 38 | 22,760(0.17%)#95 | 383,359(0.01%)#1,145 |
| 96. | Watchung Borough | 38 | 22,760(0.17%)#96 | 383,359(0.01%)#1,147 |
| 97. | Keasbey | 38 | 22,760(0.17%)#97 | 383,359(0.01%)#1,148 |
| 98. | Franklin Lakes Borough | 37 | 22,760(0.16%)#98 | 383,359(0.01%)#1,168 |
| 99. | Monmouth Junction | 37 | 22,760(0.16%)#99 | 383,359(0.01%)#1,170 |
| 100. | Upper Saddle River Borough | 36 | 22,760(0.16%)#100 | 383,359(0.01%)#1,184 |
Common Questions
What are the Top 10 Cities with the Most Immigrants from Ukraine in New Jersey?
Top 10 Cities with the Most Immigrants from Ukraine in New Jersey are:
#1
821
#2
560
#3
470
#4
359
#5
348
#6
335
#7
318
#8
217
#9
200
#10
190
What city has the Most Immigrants from Ukraine in New Jersey?
Jersey City has the Most Immigrants from Ukraine in New Jersey with 821.
What is the Total Immigrants from Ukraine in the State of New Jersey?
Total Immigrants from Ukraine in New Jersey is 22,760.
What is the Total Immigrants from Ukraine in the United States?
Total Immigrants from Ukraine in the United States is 383,359.