Cities with the Most Immigrants from Europe in New Jersey
RELATED REPORTS & OPTIONS
Europe
New Jersey
Compare Cities
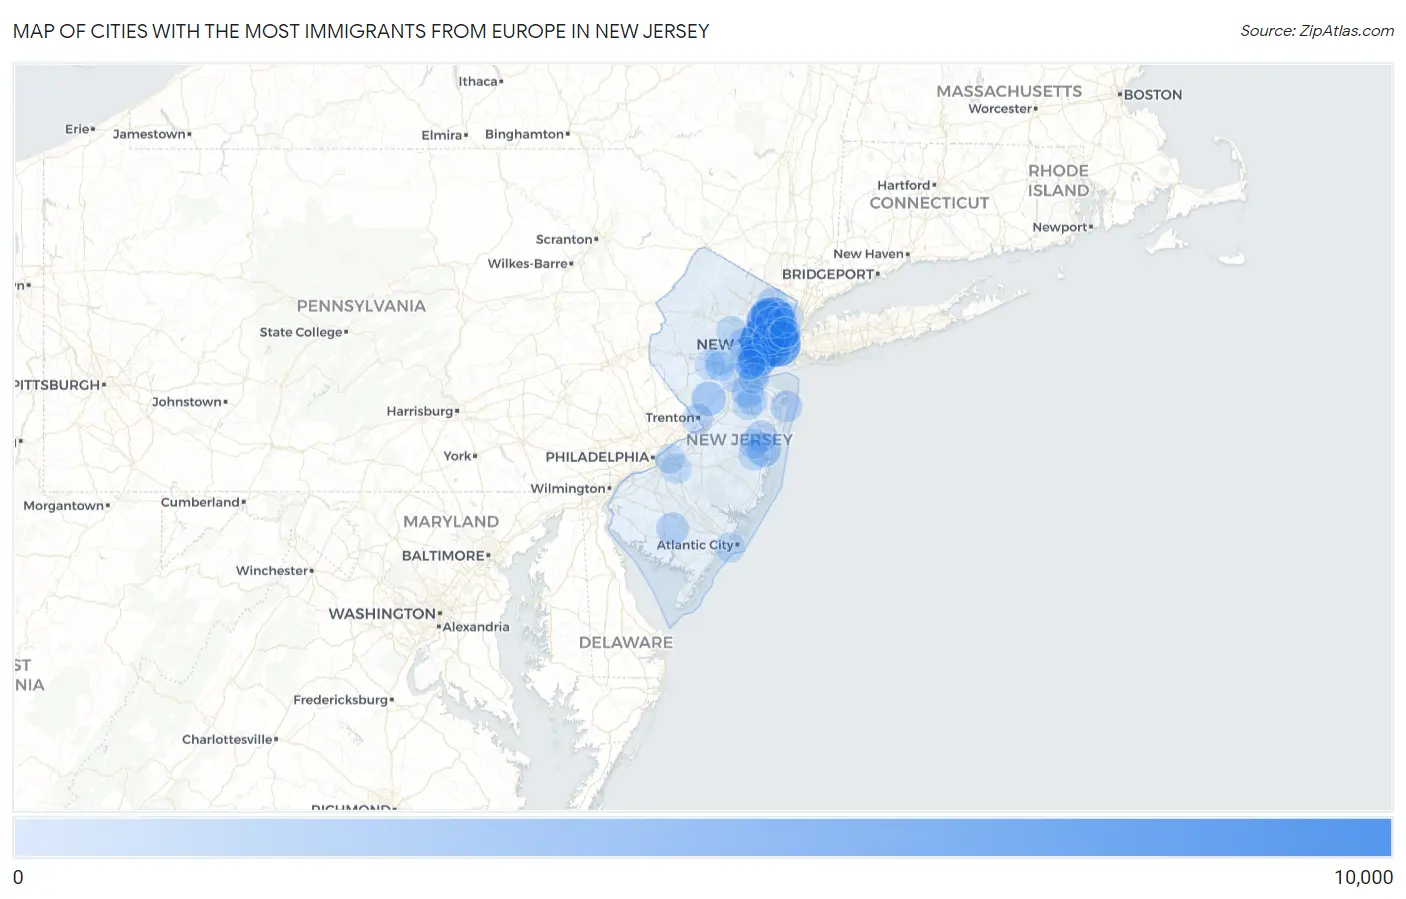
Map of Cities with the Most Immigrants from Europe in New Jersey
0
10,000
Cities with the Most Immigrants from Europe in New Jersey
| City | Europe | vs State | vs National | |
| 1. | Newark | 9,630 | 295,020(3.26%)#1 | 4,820,287(0.20%)#22 |
| 2. | Jersey City | 8,007 | 295,020(2.71%)#2 | 4,820,287(0.17%)#27 |
| 3. | Garfield | 6,552 | 295,020(2.22%)#3 | 4,820,287(0.14%)#44 |
| 4. | Clifton | 5,847 | 295,020(1.98%)#4 | 4,820,287(0.12%)#55 |
| 5. | Fair Lawn Borough | 4,625 | 295,020(1.57%)#5 | 4,820,287(0.10%)#93 |
| 6. | Elizabeth | 4,507 | 295,020(1.53%)#6 | 4,820,287(0.09%)#97 |
| 7. | Linden | 4,469 | 295,020(1.51%)#7 | 4,820,287(0.09%)#99 |
| 8. | Kearny | 4,016 | 295,020(1.36%)#8 | 4,820,287(0.08%)#118 |
| 9. | Wallington Borough | 3,960 | 295,020(1.34%)#9 | 4,820,287(0.08%)#124 |
| 10. | Hoboken | 3,006 | 295,020(1.02%)#10 | 4,820,287(0.06%)#184 |
| 11. | Cliffside Park Borough | 2,663 | 295,020(0.90%)#11 | 4,820,287(0.06%)#210 |
| 12. | Fort Lee Borough | 2,652 | 295,020(0.90%)#12 | 4,820,287(0.06%)#212 |
| 13. | Elmwood Park Borough | 2,616 | 295,020(0.89%)#13 | 4,820,287(0.05%)#214 |
| 14. | Princeton | 2,433 | 295,020(0.82%)#14 | 4,820,287(0.05%)#234 |
| 15. | Sayreville Borough | 2,364 | 295,020(0.80%)#15 | 4,820,287(0.05%)#244 |
| 16. | Toms River | 2,303 | 295,020(0.78%)#16 | 4,820,287(0.05%)#252 |
| 17. | Bayonne | 2,237 | 295,020(0.76%)#17 | 4,820,287(0.05%)#260 |
| 18. | Lodi Borough | 2,027 | 295,020(0.69%)#18 | 4,820,287(0.04%)#300 |
| 19. | North Arlington Borough | 1,694 | 295,020(0.57%)#19 | 4,820,287(0.04%)#370 |
| 20. | Vineland | 1,627 | 295,020(0.55%)#20 | 4,820,287(0.03%)#394 |
| 21. | Old Bridge | 1,608 | 295,020(0.55%)#21 | 4,820,287(0.03%)#398 |
| 22. | Colonia | 1,544 | 295,020(0.52%)#22 | 4,820,287(0.03%)#420 |
| 23. | Paramus Borough | 1,445 | 295,020(0.49%)#23 | 4,820,287(0.03%)#469 |
| 24. | Ridgewood | 1,417 | 295,020(0.48%)#24 | 4,820,287(0.03%)#483 |
| 25. | Summit | 1,383 | 295,020(0.47%)#25 | 4,820,287(0.03%)#495 |
| 26. | Long Branch | 1,320 | 295,020(0.45%)#26 | 4,820,287(0.03%)#525 |
| 27. | South River Borough | 1,286 | 295,020(0.44%)#27 | 4,820,287(0.03%)#543 |
| 28. | Hackensack | 1,275 | 295,020(0.43%)#28 | 4,820,287(0.03%)#548 |
| 29. | Lakewood | 1,247 | 295,020(0.42%)#29 | 4,820,287(0.03%)#566 |
| 30. | Edgewater Borough | 1,217 | 295,020(0.41%)#30 | 4,820,287(0.03%)#580 |
| 31. | Paterson | 1,186 | 295,020(0.40%)#31 | 4,820,287(0.02%)#587 |
| 32. | Hawthorne Borough | 1,183 | 295,020(0.40%)#32 | 4,820,287(0.02%)#588 |
| 33. | Westfield | 1,174 | 295,020(0.40%)#33 | 4,820,287(0.02%)#591 |
| 34. | Secaucus | 1,172 | 295,020(0.40%)#34 | 4,820,287(0.02%)#593 |
| 35. | Harrison | 1,165 | 295,020(0.39%)#35 | 4,820,287(0.02%)#598 |
| 36. | West New York | 1,075 | 295,020(0.36%)#36 | 4,820,287(0.02%)#654 |
| 37. | Hillsborough | 1,062 | 295,020(0.36%)#37 | 4,820,287(0.02%)#663 |
| 38. | Fairview Borough | 1,051 | 295,020(0.36%)#38 | 4,820,287(0.02%)#667 |
| 39. | Rahway | 1,023 | 295,020(0.35%)#39 | 4,820,287(0.02%)#682 |
| 40. | Union City | 980 | 295,020(0.33%)#40 | 4,820,287(0.02%)#708 |
| 41. | Lincoln Park Borough | 931 | 295,020(0.32%)#41 | 4,820,287(0.02%)#744 |
| 42. | Woodland Park Borough | 904 | 295,020(0.31%)#42 | 4,820,287(0.02%)#762 |
| 43. | Rutherford Borough | 901 | 295,020(0.31%)#43 | 4,820,287(0.02%)#767 |
| 44. | Highland Park Borough | 900 | 295,020(0.31%)#44 | 4,820,287(0.02%)#768 |
| 45. | Trenton | 892 | 295,020(0.30%)#45 | 4,820,287(0.02%)#773 |
| 46. | Holiday City Berkeley | 882 | 295,020(0.30%)#46 | 4,820,287(0.02%)#781 |
| 47. | Oakland Borough | 846 | 295,020(0.29%)#47 | 4,820,287(0.02%)#809 |
| 48. | Perth Amboy | 802 | 295,020(0.27%)#48 | 4,820,287(0.02%)#846 |
| 49. | Passaic | 784 | 295,020(0.27%)#49 | 4,820,287(0.02%)#870 |
| 50. | Robertsville | 764 | 295,020(0.26%)#50 | 4,820,287(0.02%)#888 |
| 51. | Morristown | 760 | 295,020(0.26%)#51 | 4,820,287(0.02%)#895 |
| 52. | Preakness | 749 | 295,020(0.25%)#52 | 4,820,287(0.02%)#910 |
| 53. | Hasbrouck Heights Borough | 748 | 295,020(0.25%)#53 | 4,820,287(0.02%)#913 |
| 54. | Martinsville | 720 | 295,020(0.24%)#54 | 4,820,287(0.01%)#945 |
| 55. | Little Ferry Borough | 720 | 295,020(0.24%)#55 | 4,820,287(0.01%)#946 |
| 56. | Ramsey Borough | 716 | 295,020(0.24%)#56 | 4,820,287(0.01%)#955 |
| 57. | Springdale | 708 | 295,020(0.24%)#57 | 4,820,287(0.01%)#971 |
| 58. | Tenafly Borough | 703 | 295,020(0.24%)#58 | 4,820,287(0.01%)#982 |
| 59. | Englewood | 673 | 295,020(0.23%)#59 | 4,820,287(0.01%)#1,040 |
| 60. | Cedar Glen West | 658 | 295,020(0.22%)#60 | 4,820,287(0.01%)#1,052 |
| 61. | East Rutherford Borough | 649 | 295,020(0.22%)#61 | 4,820,287(0.01%)#1,070 |
| 62. | Pompton Lakes Borough | 646 | 295,020(0.22%)#62 | 4,820,287(0.01%)#1,075 |
| 63. | North Haledon Borough | 637 | 295,020(0.22%)#63 | 4,820,287(0.01%)#1,086 |
| 64. | Madison Borough | 633 | 295,020(0.21%)#64 | 4,820,287(0.01%)#1,096 |
| 65. | Kenilworth Borough | 630 | 295,020(0.21%)#65 | 4,820,287(0.01%)#1,100 |
| 66. | Parsippany | 618 | 295,020(0.21%)#66 | 4,820,287(0.01%)#1,125 |
| 67. | Franklin Lakes Borough | 610 | 295,020(0.21%)#67 | 4,820,287(0.01%)#1,143 |
| 68. | New Brunswick | 608 | 295,020(0.21%)#68 | 4,820,287(0.01%)#1,146 |
| 69. | Manville Borough | 604 | 295,020(0.20%)#69 | 4,820,287(0.01%)#1,156 |
| 70. | Metuchen Borough | 601 | 295,020(0.20%)#70 | 4,820,287(0.01%)#1,163 |
| 71. | Bradley Gardens | 595 | 295,020(0.20%)#71 | 4,820,287(0.01%)#1,175 |
| 72. | Dumont Borough | 591 | 295,020(0.20%)#72 | 4,820,287(0.01%)#1,180 |
| 73. | Ridgefield Borough | 582 | 295,020(0.20%)#73 | 4,820,287(0.01%)#1,199 |
| 74. | Carteret Borough | 575 | 295,020(0.19%)#74 | 4,820,287(0.01%)#1,214 |
| 75. | Yorketown | 575 | 295,020(0.19%)#75 | 4,820,287(0.01%)#1,215 |
| 76. | New Providence Borough | 574 | 295,020(0.19%)#76 | 4,820,287(0.01%)#1,217 |
| 77. | Cresskill Borough | 569 | 295,020(0.19%)#77 | 4,820,287(0.01%)#1,230 |
| 78. | Wood Ridge Borough | 566 | 295,020(0.19%)#78 | 4,820,287(0.01%)#1,238 |
| 79. | Ventnor City | 559 | 295,020(0.19%)#79 | 4,820,287(0.01%)#1,254 |
| 80. | Wanaque Borough | 558 | 295,020(0.19%)#80 | 4,820,287(0.01%)#1,257 |
| 81. | Bergenfield Borough | 551 | 295,020(0.19%)#81 | 4,820,287(0.01%)#1,268 |
| 82. | Hillsdale Borough | 551 | 295,020(0.19%)#82 | 4,820,287(0.01%)#1,271 |
| 83. | Ridgefield Park | 549 | 295,020(0.19%)#83 | 4,820,287(0.01%)#1,277 |
| 84. | Guttenberg | 549 | 295,020(0.19%)#84 | 4,820,287(0.01%)#1,278 |
| 85. | Eatontown Borough | 534 | 295,020(0.18%)#85 | 4,820,287(0.01%)#1,302 |
| 86. | South Amboy | 523 | 295,020(0.18%)#86 | 4,820,287(0.01%)#1,321 |
| 87. | Haledon Borough | 522 | 295,020(0.18%)#87 | 4,820,287(0.01%)#1,322 |
| 88. | New Milford Borough | 521 | 295,020(0.18%)#88 | 4,820,287(0.01%)#1,326 |
| 89. | Palisades Park Borough | 520 | 295,020(0.18%)#89 | 4,820,287(0.01%)#1,330 |
| 90. | Mountainside Borough | 506 | 295,020(0.17%)#90 | 4,820,287(0.01%)#1,363 |
| 91. | Iselin | 498 | 295,020(0.17%)#91 | 4,820,287(0.01%)#1,384 |
| 92. | South Plainfield Borough | 493 | 295,020(0.17%)#92 | 4,820,287(0.01%)#1,393 |
| 93. | Roselle Park Borough | 488 | 295,020(0.17%)#93 | 4,820,287(0.01%)#1,407 |
| 94. | Finderne | 477 | 295,020(0.16%)#94 | 4,820,287(0.01%)#1,436 |
| 95. | Cherry Hill Mall | 474 | 295,020(0.16%)#95 | 4,820,287(0.01%)#1,446 |
| 96. | Glen Rock Borough | 472 | 295,020(0.16%)#96 | 4,820,287(0.01%)#1,451 |
| 97. | Hopatcong Borough | 471 | 295,020(0.16%)#97 | 4,820,287(0.01%)#1,453 |
| 98. | Lake Hopatcong | 471 | 295,020(0.16%)#98 | 4,820,287(0.01%)#1,454 |
| 99. | Totowa Borough | 470 | 295,020(0.16%)#99 | 4,820,287(0.01%)#1,456 |
| 100. | Pompton Plains | 461 | 295,020(0.16%)#100 | 4,820,287(0.01%)#1,470 |
Common Questions
What are the Top 10 Cities with the Most Immigrants from Europe in New Jersey?
Top 10 Cities with the Most Immigrants from Europe in New Jersey are:
#1
9,630
#2
8,007
#3
6,552
#4
5,847
#5
4,507
#6
4,469
#7
4,016
#8
3,006
#9
2,433
#10
2,303
What city has the Most Immigrants from Europe in New Jersey?
Newark has the Most Immigrants from Europe in New Jersey with 9,630.
What is the Total Immigrants from Europe in the State of New Jersey?
Total Immigrants from Europe in New Jersey is 295,020.
What is the Total Immigrants from Europe in the United States?
Total Immigrants from Europe in the United States is 4,820,287.