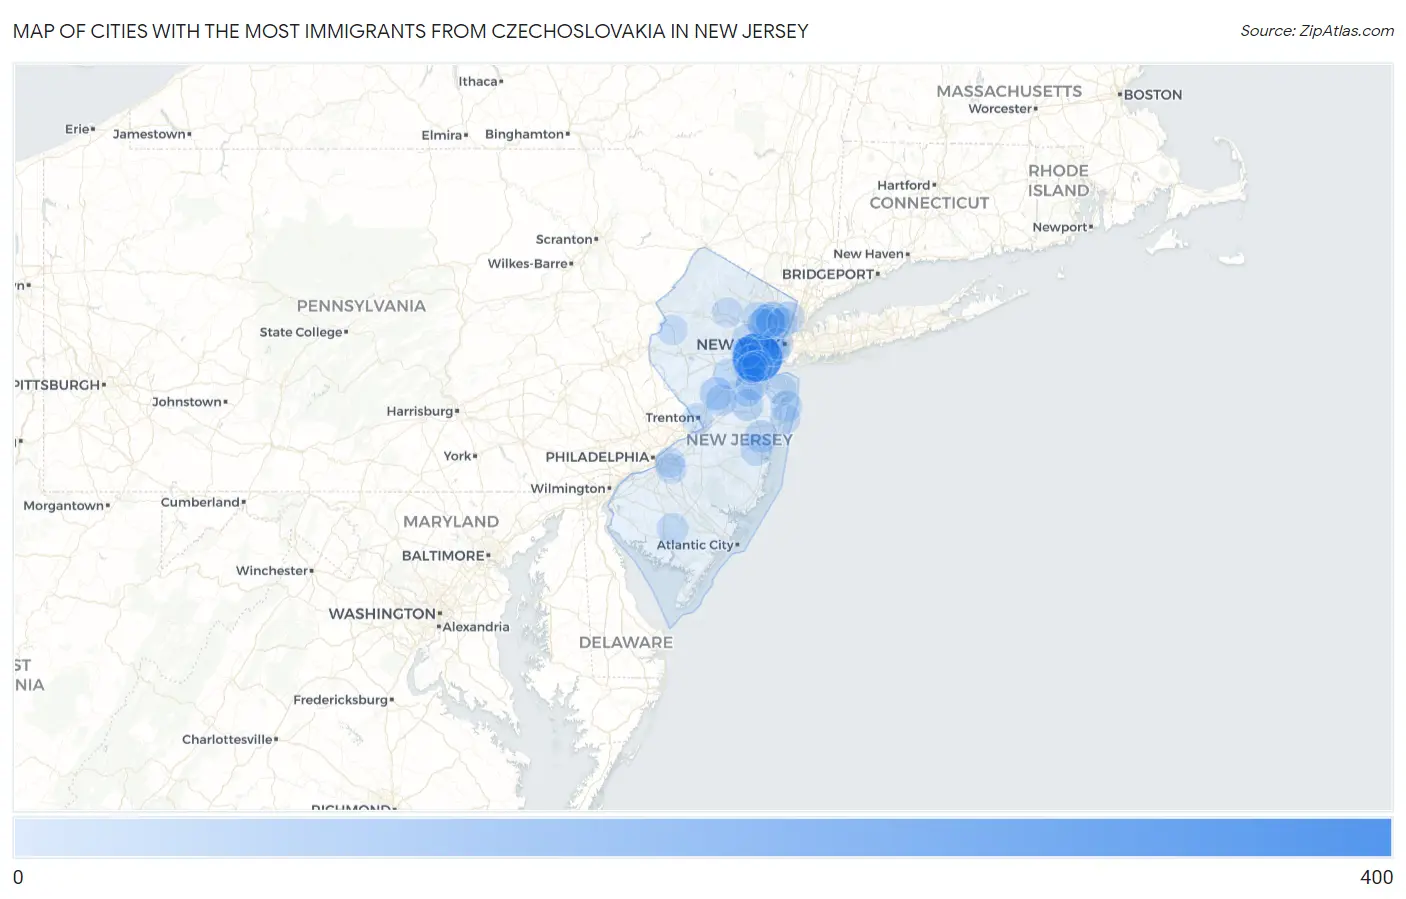
Cities with the Most Immigrants from Czechoslovakia in New Jersey
RELATED REPORTS & OPTIONS
Czechoslovakia
New Jersey
Compare Cities
Map of Cities with the Most Immigrants from Czechoslovakia in New Jersey
0
400
Cities with the Most Immigrants from Czechoslovakia in New Jersey
| City | Czechoslovakia | vs State | vs National | |
| 1. | Linden | 391 | 3,968(9.85%)#1 | 65,085(0.60%)#6 |
| 2. | Point Pleasant Beach Borough | 152 | 3,968(3.83%)#2 | 65,085(0.23%)#36 |
| 3. | Lake Hopatcong | 106 | 3,968(2.67%)#3 | 65,085(0.16%)#78 |
| 4. | Colonia | 92 | 3,968(2.32%)#4 | 65,085(0.14%)#102 |
| 5. | Garfield | 82 | 3,968(2.07%)#5 | 65,085(0.13%)#116 |
| 6. | Sayreville Borough | 76 | 3,968(1.92%)#6 | 65,085(0.12%)#129 |
| 7. | Clifton | 72 | 3,968(1.81%)#7 | 65,085(0.11%)#137 |
| 8. | Lincoln Park Borough | 68 | 3,968(1.71%)#8 | 65,085(0.10%)#151 |
| 9. | Hasbrouck Heights Borough | 62 | 3,968(1.56%)#9 | 65,085(0.10%)#163 |
| 10. | Kingston | 59 | 3,968(1.49%)#10 | 65,085(0.09%)#178 |
| 11. | Franklin Lakes Borough | 57 | 3,968(1.44%)#11 | 65,085(0.09%)#187 |
| 12. | Elmwood Park Borough | 56 | 3,968(1.41%)#12 | 65,085(0.09%)#191 |
| 13. | Madison Park | 49 | 3,968(1.23%)#13 | 65,085(0.08%)#232 |
| 14. | Lakewood | 47 | 3,968(1.18%)#14 | 65,085(0.07%)#239 |
| 15. | Dumont Borough | 47 | 3,968(1.18%)#15 | 65,085(0.07%)#241 |
| 16. | Wallington Borough | 46 | 3,968(1.16%)#16 | 65,085(0.07%)#252 |
| 17. | Bayonne | 43 | 3,968(1.08%)#17 | 65,085(0.07%)#273 |
| 18. | Rahway | 40 | 3,968(1.01%)#18 | 65,085(0.06%)#314 |
| 19. | Englewood | 37 | 3,968(0.93%)#19 | 65,085(0.06%)#344 |
| 20. | Yorketown | 36 | 3,968(0.91%)#20 | 65,085(0.06%)#359 |
| 21. | Short Hills | 34 | 3,968(0.86%)#21 | 65,085(0.05%)#384 |
| 22. | Oakland Borough | 34 | 3,968(0.86%)#22 | 65,085(0.05%)#385 |
| 23. | Woodland Park Borough | 31 | 3,968(0.78%)#23 | 65,085(0.05%)#429 |
| 24. | Jersey City | 30 | 3,968(0.76%)#24 | 65,085(0.05%)#432 |
| 25. | Princeton Meadows | 30 | 3,968(0.76%)#25 | 65,085(0.05%)#442 |
| 26. | Pine Lake Park | 30 | 3,968(0.76%)#26 | 65,085(0.05%)#445 |
| 27. | West Long Branch Borough | 30 | 3,968(0.76%)#27 | 65,085(0.05%)#446 |
| 28. | Vineland | 29 | 3,968(0.73%)#28 | 65,085(0.04%)#454 |
| 29. | Long Branch | 28 | 3,968(0.71%)#29 | 65,085(0.04%)#475 |
| 30. | Singac | 27 | 3,968(0.68%)#30 | 65,085(0.04%)#493 |
| 31. | Metuchen Borough | 24 | 3,968(0.60%)#31 | 65,085(0.04%)#550 |
| 32. | Elizabeth | 23 | 3,968(0.58%)#32 | 65,085(0.04%)#557 |
| 33. | Carlstadt Borough | 23 | 3,968(0.58%)#33 | 65,085(0.04%)#577 |
| 34. | Demarest Borough | 23 | 3,968(0.58%)#34 | 65,085(0.04%)#580 |
| 35. | Park Ridge Borough | 21 | 3,968(0.53%)#35 | 65,085(0.03%)#622 |
| 36. | New Providence Borough | 20 | 3,968(0.50%)#36 | 65,085(0.03%)#655 |
| 37. | Navesink | 20 | 3,968(0.50%)#37 | 65,085(0.03%)#663 |
| 38. | Trenton | 19 | 3,968(0.48%)#38 | 65,085(0.03%)#667 |
| 39. | Dunellen Borough | 19 | 3,968(0.48%)#39 | 65,085(0.03%)#687 |
| 40. | Westfield | 18 | 3,968(0.45%)#40 | 65,085(0.03%)#704 |
| 41. | Old Bridge | 18 | 3,968(0.45%)#41 | 65,085(0.03%)#707 |
| 42. | East Rutherford Borough | 18 | 3,968(0.45%)#42 | 65,085(0.03%)#720 |
| 43. | Jamesburg Borough | 18 | 3,968(0.45%)#43 | 65,085(0.03%)#725 |
| 44. | Passaic | 17 | 3,968(0.43%)#44 | 65,085(0.03%)#739 |
| 45. | Somerset | 17 | 3,968(0.43%)#45 | 65,085(0.03%)#747 |
| 46. | Fords | 17 | 3,968(0.43%)#46 | 65,085(0.03%)#754 |
| 47. | Port Reading | 17 | 3,968(0.43%)#47 | 65,085(0.03%)#762 |
| 48. | Renaissance At Monroe | 16 | 3,968(0.40%)#48 | 65,085(0.02%)#803 |
| 49. | Highland Park Borough | 15 | 3,968(0.38%)#49 | 65,085(0.02%)#827 |
| 50. | Bound Brook Borough | 15 | 3,968(0.38%)#50 | 65,085(0.02%)#833 |
| 51. | Mountainside Borough | 13 | 3,968(0.33%)#51 | 65,085(0.02%)#924 |
| 52. | Fair Lawn Borough | 12 | 3,968(0.30%)#52 | 65,085(0.02%)#942 |
| 53. | Woodbridge | 12 | 3,968(0.30%)#53 | 65,085(0.02%)#951 |
| 54. | Upper Montclair | 12 | 3,968(0.30%)#54 | 65,085(0.02%)#959 |
| 55. | Westwood Borough | 12 | 3,968(0.30%)#55 | 65,085(0.02%)#962 |
| 56. | Ocean Grove | 12 | 3,968(0.30%)#56 | 65,085(0.02%)#967 |
| 57. | Manville Borough | 11 | 3,968(0.28%)#57 | 65,085(0.02%)#1,006 |
| 58. | Chatham Borough | 11 | 3,968(0.28%)#58 | 65,085(0.02%)#1,008 |
| 59. | Englishtown Borough | 11 | 3,968(0.28%)#59 | 65,085(0.02%)#1,022 |
| 60. | Ramsey Borough | 10 | 3,968(0.25%)#60 | 65,085(0.02%)#1,065 |
| 61. | Ashland | 10 | 3,968(0.25%)#61 | 65,085(0.02%)#1,073 |
| 62. | Basking Ridge | 10 | 3,968(0.25%)#62 | 65,085(0.02%)#1,075 |
| 63. | Garwood Borough | 10 | 3,968(0.25%)#63 | 65,085(0.02%)#1,083 |
| 64. | Seaville | 10 | 3,968(0.25%)#64 | 65,085(0.02%)#1,087 |
| 65. | Ogdensburg Borough | 10 | 3,968(0.25%)#65 | 65,085(0.02%)#1,092 |
| 66. | Flagtown | 10 | 3,968(0.25%)#66 | 65,085(0.02%)#1,094 |
| 67. | White Meadow Lake | 9 | 3,968(0.23%)#67 | 65,085(0.01%)#1,146 |
| 68. | Watchung Borough | 9 | 3,968(0.23%)#68 | 65,085(0.01%)#1,153 |
| 69. | Ringwood Borough | 8 | 3,968(0.20%)#69 | 65,085(0.01%)#1,222 |
| 70. | Waldwick Borough | 8 | 3,968(0.20%)#70 | 65,085(0.01%)#1,226 |
| 71. | Ridgefield Park | 7 | 3,968(0.18%)#71 | 65,085(0.01%)#1,277 |
| 72. | Hillsdale Borough | 7 | 3,968(0.18%)#72 | 65,085(0.01%)#1,279 |
| 73. | Ellisburg | 7 | 3,968(0.18%)#73 | 65,085(0.01%)#1,284 |
| 74. | Oxford | 6 | 3,968(0.15%)#74 | 65,085(0.01%)#1,342 |
| 75. | Emerson Borough | 5 | 3,968(0.13%)#75 | 65,085(0.01%)#1,376 |
| 76. | Chester Borough | 5 | 3,968(0.13%)#76 | 65,085(0.01%)#1,394 |
| 77. | Hopewell Borough | 4 | 3,968(0.10%)#77 | 65,085(0.01%)#1,436 |
| 78. | Roosevelt Borough | 4 | 3,968(0.10%)#78 | 65,085(0.01%)#1,445 |
| 79. | Tinton Falls Borough | 3 | 3,968(0.08%)#79 | 65,085(0.00%)#1,455 |
| 80. | Hampton Borough | 3 | 3,968(0.08%)#80 | 65,085(0.00%)#1,471 |
| 81. | Far Hills Borough | 2 | 3,968(0.05%)#81 | 65,085(0.00%)#1,490 |
| 82. | Millstone Borough | 1 | 3,968(0.03%)#82 | 65,085(0.00%)#1,520 |
Common Questions
What are the Top 10 Cities with the Most Immigrants from Czechoslovakia in New Jersey?
Top 10 Cities with the Most Immigrants from Czechoslovakia in New Jersey are:
What city has the Most Immigrants from Czechoslovakia in New Jersey?
Linden has the Most Immigrants from Czechoslovakia in New Jersey with 391.
What is the Total Immigrants from Czechoslovakia in the State of New Jersey?
Total Immigrants from Czechoslovakia in New Jersey is 3,968.
What is the Total Immigrants from Czechoslovakia in the United States?
Total Immigrants from Czechoslovakia in the United States is 65,085.