Bradley Gardens, NJ Map & Demographics
Bradley Gardens Map
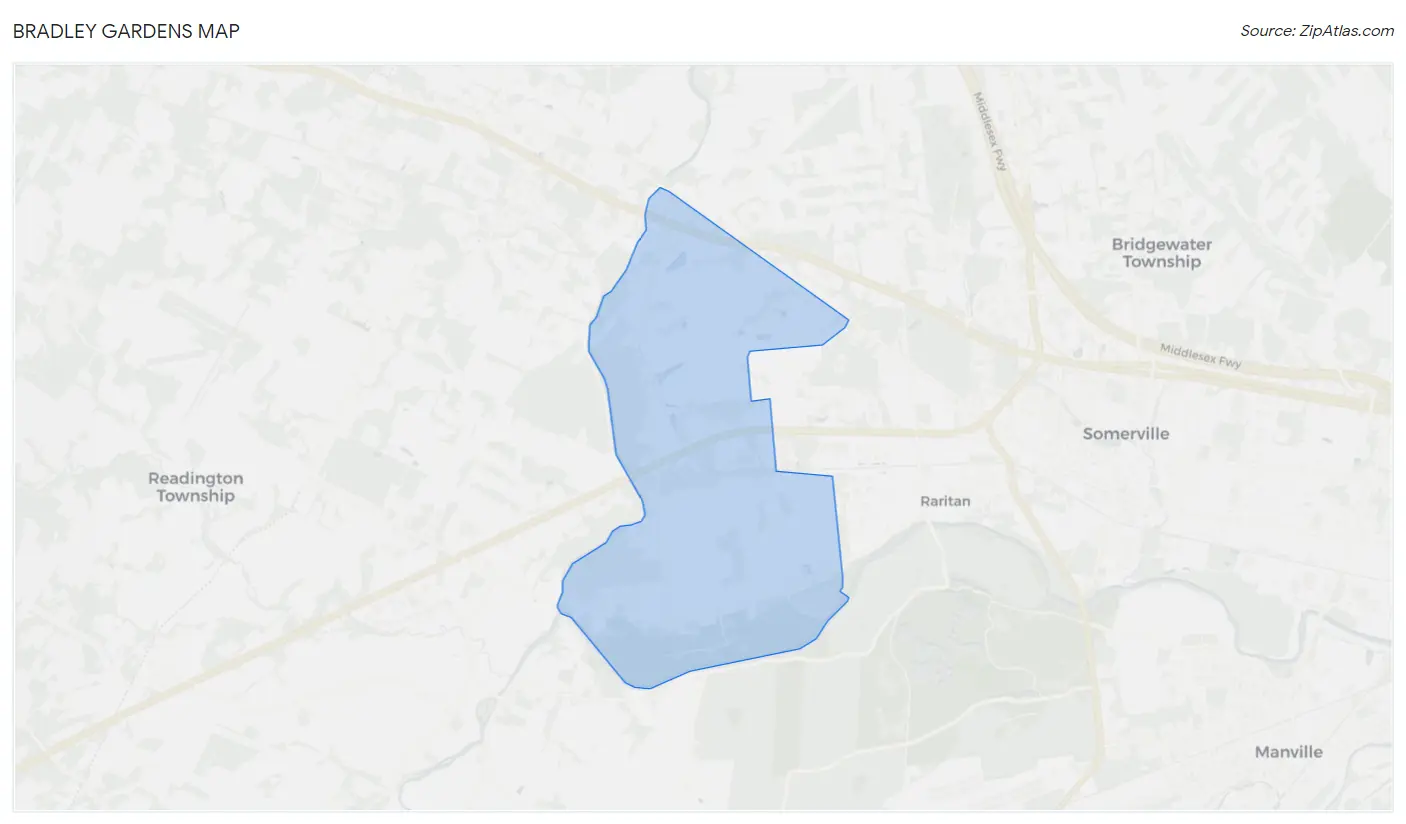
Bradley Gardens Overview
$65,287
PER CAPITA INCOME
$190,000
AVG FAMILY INCOME
$170,063
AVG HOUSEHOLD INCOME
49.2%
WAGE / INCOME GAP [ % ]
50.8¢/ $1
WAGE / INCOME GAP [ $ ]
0.36
INEQUALITY / GINI INDEX
14,345
TOTAL POPULATION
6,849
MALE POPULATION
7,496
FEMALE POPULATION
91.37
MALES / 100 FEMALES
109.45
FEMALES / 100 MALES
42.6
MEDIAN AGE
3.2
AVG FAMILY SIZE
2.8
AVG HOUSEHOLD SIZE
8,348
LABOR FORCE [ PEOPLE ]
71.5%
PERCENT IN LABOR FORCE
3.1%
UNEMPLOYMENT RATE
Income in Bradley Gardens
Income Overview in Bradley Gardens
Per Capita Income in Bradley Gardens is $65,287, while median incomes of families and households are $190,000 and $170,063 respectively.
| Characteristic | Number | Measure |
| Per Capita Income | 14,345 | $65,287 |
| Median Family Income | 3,942 | $190,000 |
| Mean Family Income | 3,942 | $205,993 |
| Median Household Income | 5,146 | $170,063 |
| Mean Household Income | 5,146 | $180,063 |
| Income Deficit | 3,942 | $0 |
| Wage / Income Gap (%) | 14,345 | 49.19% |
| Wage / Income Gap ($) | 14,345 | 50.81¢ per $1 |
| Gini / Inequality Index | 14,345 | 0.36 |
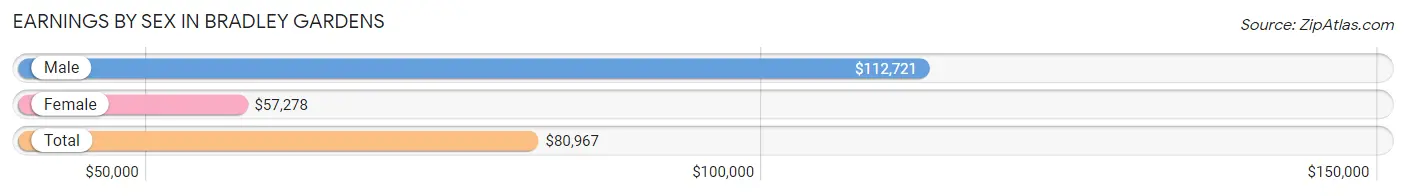
Earnings by Sex in Bradley Gardens
Average Earnings in Bradley Gardens are $80,967, $112,721 for men and $57,278 for women, a difference of 49.2%.
| Sex | Number | Average Earnings |
| Male | 4,458 (50.3%) | $112,721 |
| Female | 4,406 (49.7%) | $57,278 |
| Total | 8,864 (100.0%) | $80,967 |
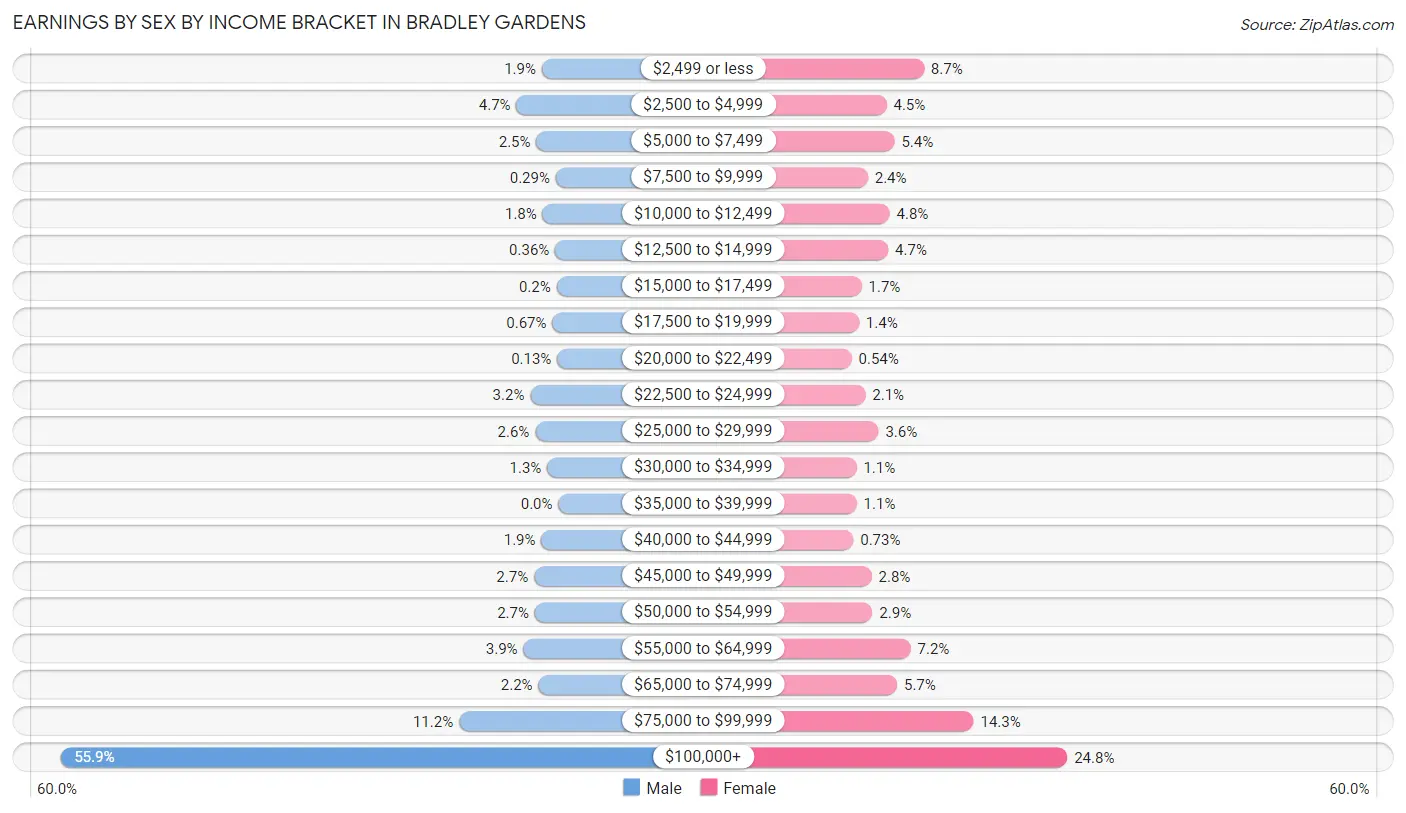
Earnings by Sex by Income Bracket in Bradley Gardens
The most common earnings brackets in Bradley Gardens are $100,000+ for men (2,491 | 55.9%) and $100,000+ for women (1,092 | 24.8%).
| Income | Male | Female |
| $2,499 or less | 83 (1.9%) | 382 (8.7%) |
| $2,500 to $4,999 | 210 (4.7%) | 197 (4.5%) |
| $5,000 to $7,499 | 110 (2.5%) | 236 (5.4%) |
| $7,500 to $9,999 | 13 (0.3%) | 104 (2.4%) |
| $10,000 to $12,499 | 79 (1.8%) | 212 (4.8%) |
| $12,500 to $14,999 | 16 (0.4%) | 205 (4.6%) |
| $15,000 to $17,499 | 9 (0.2%) | 73 (1.7%) |
| $17,500 to $19,999 | 30 (0.7%) | 60 (1.4%) |
| $20,000 to $22,499 | 6 (0.1%) | 24 (0.5%) |
| $22,500 to $24,999 | 141 (3.2%) | 92 (2.1%) |
| $25,000 to $29,999 | 116 (2.6%) | 157 (3.6%) |
| $30,000 to $34,999 | 56 (1.3%) | 48 (1.1%) |
| $35,000 to $39,999 | 0 (0.0%) | 49 (1.1%) |
| $40,000 to $44,999 | 85 (1.9%) | 32 (0.7%) |
| $45,000 to $49,999 | 122 (2.7%) | 123 (2.8%) |
| $50,000 to $54,999 | 118 (2.6%) | 127 (2.9%) |
| $55,000 to $64,999 | 175 (3.9%) | 316 (7.2%) |
| $65,000 to $74,999 | 100 (2.2%) | 249 (5.7%) |
| $75,000 to $99,999 | 498 (11.2%) | 628 (14.2%) |
| $100,000+ | 2,491 (55.9%) | 1,092 (24.8%) |
| Total | 4,458 (100.0%) | 4,406 (100.0%) |
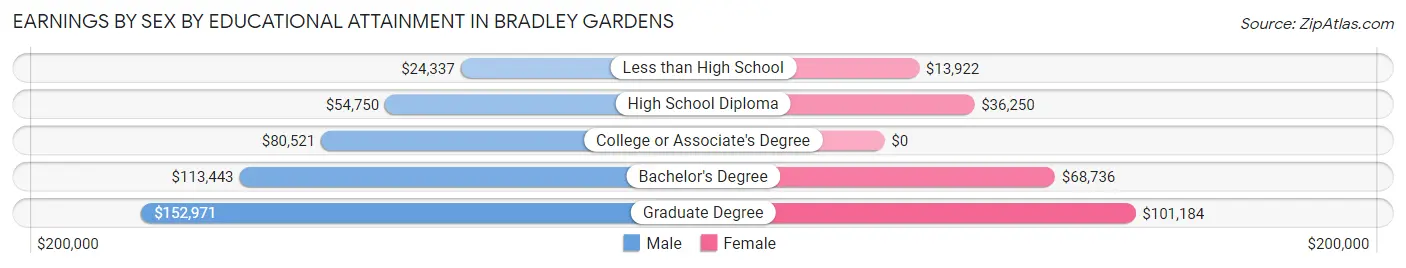
Earnings by Sex by Educational Attainment in Bradley Gardens
Average earnings in Bradley Gardens are $117,616 for men and $69,461 for women, a difference of 40.9%. Men with an educational attainment of graduate degree enjoy the highest average annual earnings of $152,971, while those with less than high school education earn the least with $24,337. Women with an educational attainment of graduate degree earn the most with the average annual earnings of $101,184, while those with less than high school education have the smallest earnings of $13,922.
| Educational Attainment | Male Income | Female Income |
| Less than High School | $24,337 | $13,922 |
| High School Diploma | $54,750 | $36,250 |
| College or Associate's Degree | $80,521 | $0 |
| Bachelor's Degree | $113,443 | $68,736 |
| Graduate Degree | $152,971 | $101,184 |
| Total | $117,616 | $69,461 |
Family Income in Bradley Gardens
Family Income Brackets in Bradley Gardens
According to the Bradley Gardens family income data, there are 1,837 families falling into the $200,000+ income range, which is the most common income bracket and makes up 46.6% of all families.
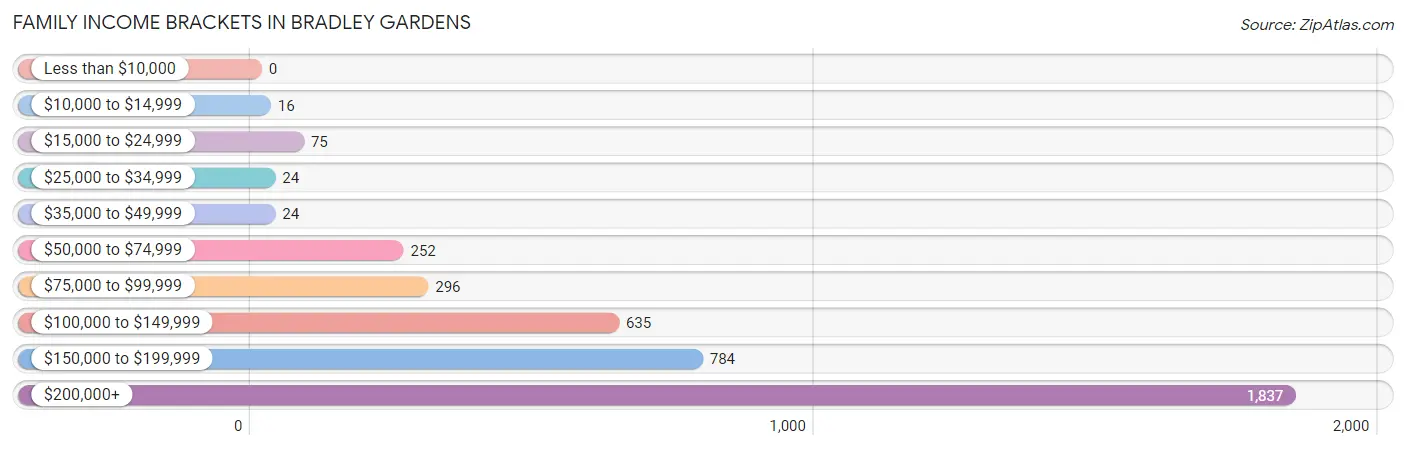
| Income Bracket | # Families | % Families |
| Less than $10,000 | 0 | 0.0% |
| $10,000 to $14,999 | 16 | 0.4% |
| $15,000 to $24,999 | 75 | 1.9% |
| $25,000 to $34,999 | 24 | 0.6% |
| $35,000 to $49,999 | 24 | 0.6% |
| $50,000 to $74,999 | 252 | 6.4% |
| $75,000 to $99,999 | 296 | 7.5% |
| $100,000 to $149,999 | 635 | 16.1% |
| $150,000 to $199,999 | 784 | 19.9% |
| $200,000+ | 1,837 | 46.6% |
Family Income by Famaliy Size in Bradley Gardens
4-person families (1,019 | 25.9%) account for the highest median family income in Bradley Gardens with $233,984 per family, while 2-person families (1,236 | 31.4%) have the highest median income of $83,772 per family member.
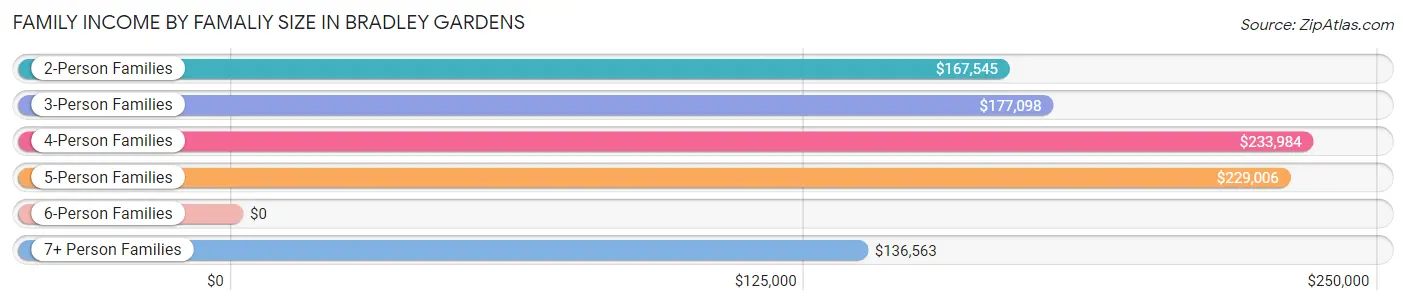
| Income Bracket | # Families | Median Income |
| 2-Person Families | 1,236 (31.4%) | $167,545 |
| 3-Person Families | 1,315 (33.4%) | $177,098 |
| 4-Person Families | 1,019 (25.9%) | $233,984 |
| 5-Person Families | 329 (8.4%) | $229,006 |
| 6-Person Families | 16 (0.4%) | $0 |
| 7+ Person Families | 27 (0.7%) | $136,563 |
| Total | 3,942 (100.0%) | $190,000 |
Family Income by Number of Earners in Bradley Gardens
The median family income in Bradley Gardens is $190,000, with families comprising 3+ earners (717) having the highest median family income of $236,908, while families with no earners (266) have the lowest median family income of $83,182, accounting for 18.2% and 6.8% of families, respectively.
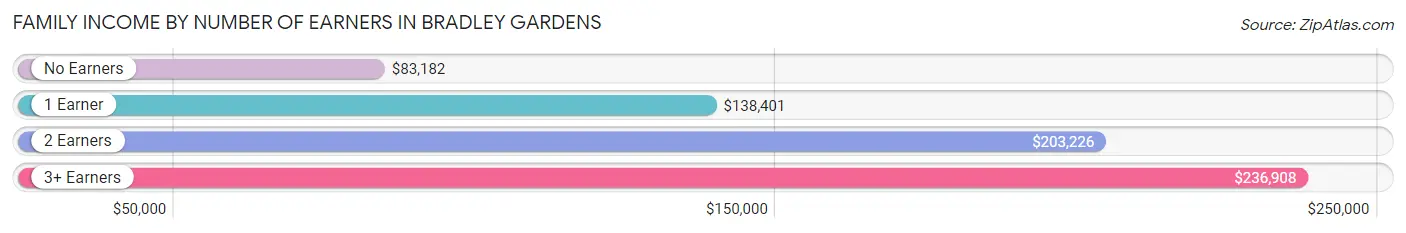
| Number of Earners | # Families | Median Income |
| No Earners | 266 (6.8%) | $83,182 |
| 1 Earner | 845 (21.4%) | $138,401 |
| 2 Earners | 2,114 (53.6%) | $203,226 |
| 3+ Earners | 717 (18.2%) | $236,908 |
| Total | 3,942 (100.0%) | $190,000 |
Household Income in Bradley Gardens
Household Income Brackets in Bradley Gardens
With 1,935 households falling in the category, the $200,000+ income range is the most frequent in Bradley Gardens, accounting for 37.6% of all households. In contrast, only 31 households (0.6%) fall into the less than $10,000 income bracket, making it the least populous group.
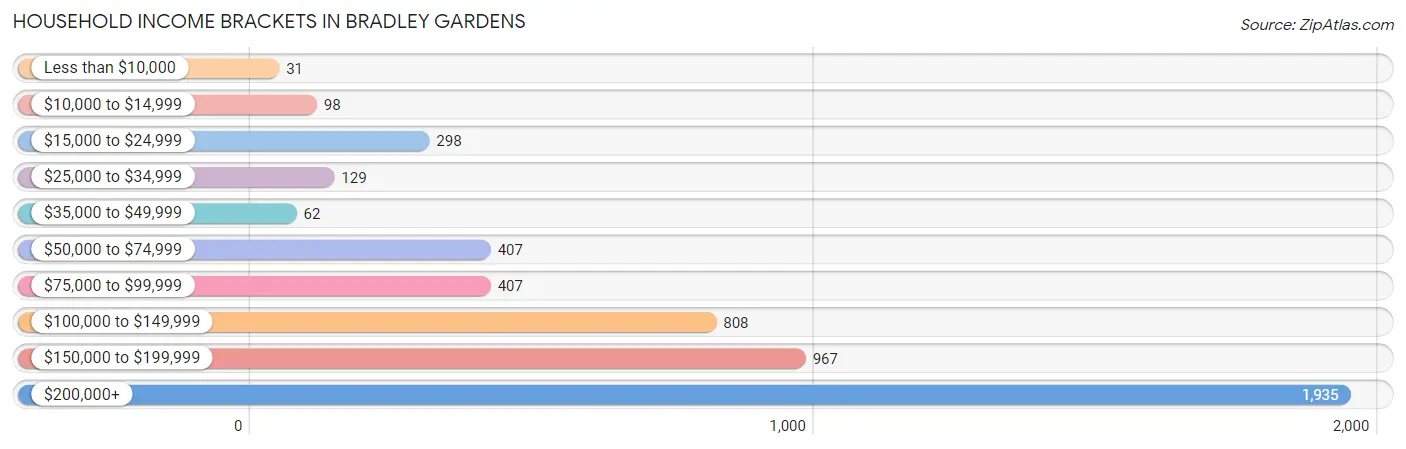
| Income Bracket | # Households | % Households |
| Less than $10,000 | 31 | 0.6% |
| $10,000 to $14,999 | 98 | 1.9% |
| $15,000 to $24,999 | 298 | 5.8% |
| $25,000 to $34,999 | 129 | 2.5% |
| $35,000 to $49,999 | 62 | 1.2% |
| $50,000 to $74,999 | 407 | 7.9% |
| $75,000 to $99,999 | 407 | 7.9% |
| $100,000 to $149,999 | 808 | 15.7% |
| $150,000 to $199,999 | 967 | 18.8% |
| $200,000+ | 1,935 | 37.6% |
Household Income by Householder Age in Bradley Gardens
The median household income in Bradley Gardens is $170,063, with the highest median household income of $178,507 found in the 45 to 64 years age bracket for the primary householder. A total of 2,949 households (57.3%) fall into this category. Meanwhile, the 15 to 24 years age bracket for the primary householder has the lowest median household income of $0, with 13 households (0.3%) in this group.
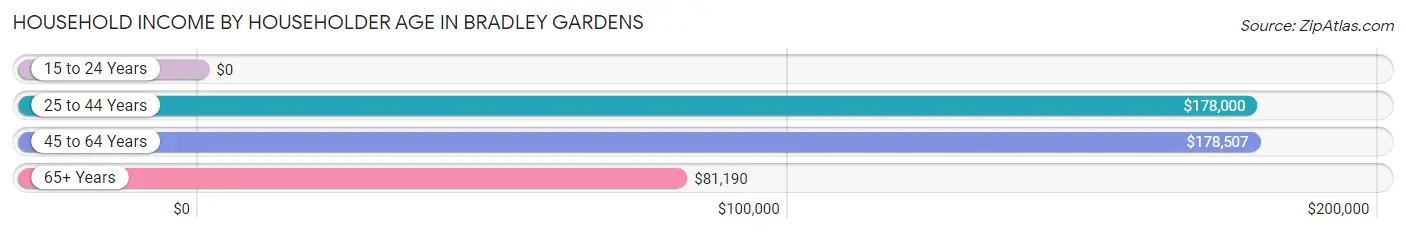
| Income Bracket | # Households | Median Income |
| 15 to 24 Years | 13 (0.3%) | $0 |
| 25 to 44 Years | 1,320 (25.7%) | $178,000 |
| 45 to 64 Years | 2,949 (57.3%) | $178,507 |
| 65+ Years | 864 (16.8%) | $81,190 |
| Total | 5,146 (100.0%) | $170,063 |
Poverty in Bradley Gardens
Income Below Poverty by Sex and Age in Bradley Gardens
With 3.8% poverty level for males and 3.4% for females among the residents of Bradley Gardens, 15 year old males and 15 year old females are the most vulnerable to poverty, with 56 males (40.9%) and 13 females (15.9%) in their respective age groups living below the poverty level.
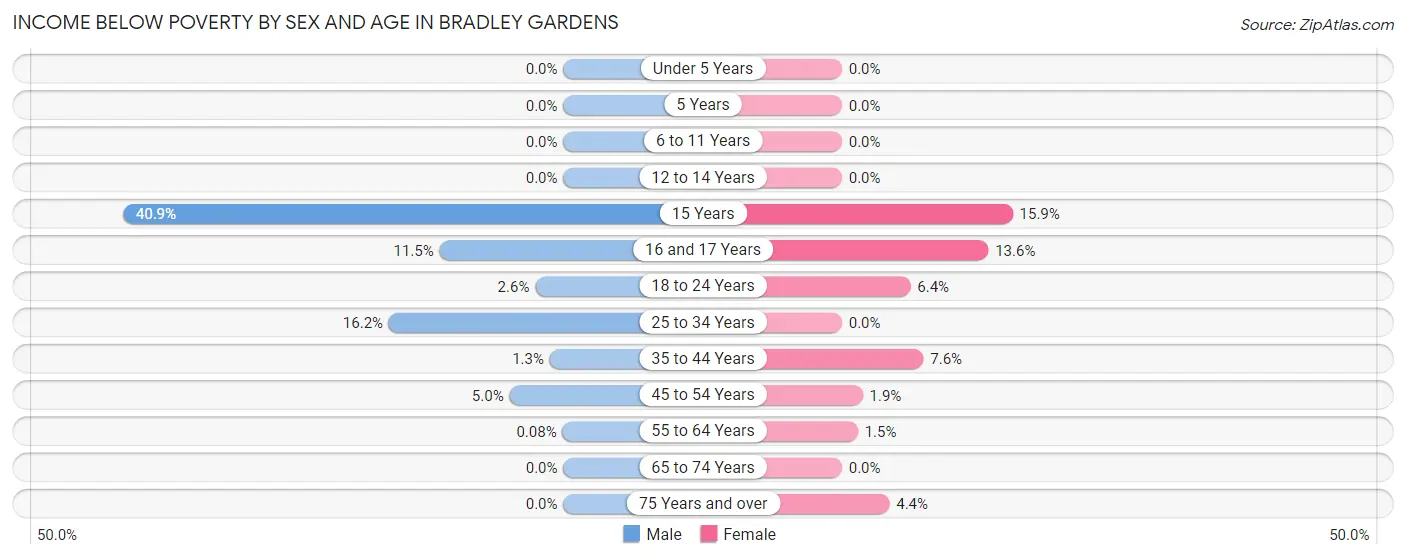
| Age Bracket | Male | Female |
| Under 5 Years | 0 (0.0%) | 0 (0.0%) |
| 5 Years | 0 (0.0%) | 0 (0.0%) |
| 6 to 11 Years | 0 (0.0%) | 0 (0.0%) |
| 12 to 14 Years | 0 (0.0%) | 0 (0.0%) |
| 15 Years | 56 (40.9%) | 13 (15.9%) |
| 16 and 17 Years | 17 (11.5%) | 56 (13.6%) |
| 18 to 24 Years | 13 (2.6%) | 42 (6.4%) |
| 25 to 34 Years | 91 (16.2%) | 0 (0.0%) |
| 35 to 44 Years | 13 (1.3%) | 80 (7.6%) |
| 45 to 54 Years | 65 (5.0%) | 26 (1.9%) |
| 55 to 64 Years | 1 (0.1%) | 15 (1.5%) |
| 65 to 74 Years | 0 (0.0%) | 0 (0.0%) |
| 75 Years and over | 0 (0.0%) | 20 (4.4%) |
| Total | 256 (3.8%) | 252 (3.4%) |
Income Above Poverty by Sex and Age in Bradley Gardens
According to the poverty statistics in Bradley Gardens, males aged under 5 years and females aged under 5 years are the age groups that are most secure financially, with 100.0% of males and 100.0% of females in these age groups living above the poverty line.
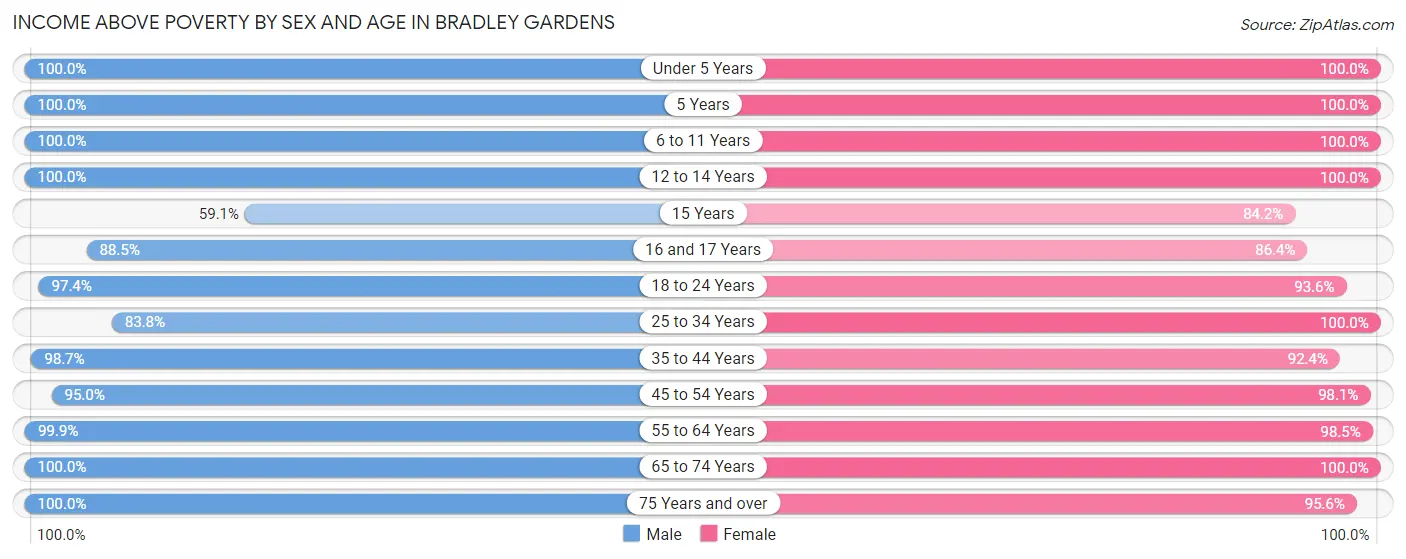
| Age Bracket | Male | Female |
| Under 5 Years | 130 (100.0%) | 419 (100.0%) |
| 5 Years | 82 (100.0%) | 65 (100.0%) |
| 6 to 11 Years | 571 (100.0%) | 454 (100.0%) |
| 12 to 14 Years | 355 (100.0%) | 339 (100.0%) |
| 15 Years | 81 (59.1%) | 69 (84.2%) |
| 16 and 17 Years | 131 (88.5%) | 356 (86.4%) |
| 18 to 24 Years | 485 (97.4%) | 618 (93.6%) |
| 25 to 34 Years | 471 (83.8%) | 554 (100.0%) |
| 35 to 44 Years | 1,015 (98.7%) | 977 (92.4%) |
| 45 to 54 Years | 1,235 (95.0%) | 1,322 (98.1%) |
| 55 to 64 Years | 1,237 (99.9%) | 1,000 (98.5%) |
| 65 to 74 Years | 480 (100.0%) | 538 (100.0%) |
| 75 Years and over | 246 (100.0%) | 434 (95.6%) |
| Total | 6,519 (96.2%) | 7,145 (96.6%) |
Income Below Poverty Among Married-Couple Families in Bradley Gardens
The poverty statistics for married-couple families in Bradley Gardens show that 0.3% or 10 of the total 3,411 families live below the poverty line. Families with no children have the highest poverty rate of 0.6%, comprising of 10 families. On the other hand, families with 1 or 2 children have the lowest poverty rate of 0.0%, which includes 0 families.
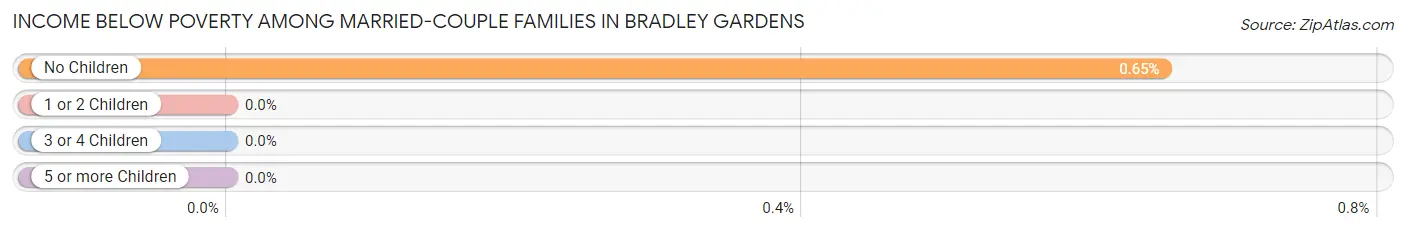
| Children | Above Poverty | Below Poverty |
| No Children | 1,531 (99.4%) | 10 (0.6%) |
| 1 or 2 Children | 1,729 (100.0%) | 0 (0.0%) |
| 3 or 4 Children | 135 (100.0%) | 0 (0.0%) |
| 5 or more Children | 6 (100.0%) | 0 (0.0%) |
| Total | 3,401 (99.7%) | 10 (0.3%) |
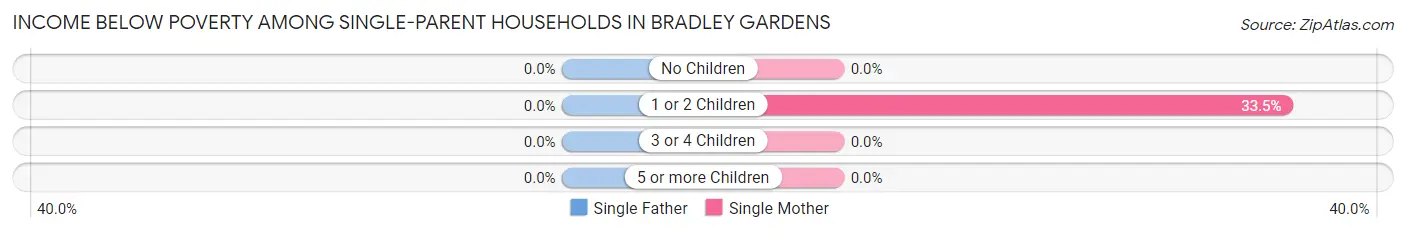
Income Below Poverty Among Single-Parent Households in Bradley Gardens
| Children | Single Father | Single Mother |
| No Children | 0 (0.0%) | 0 (0.0%) |
| 1 or 2 Children | 0 (0.0%) | 69 (33.5%) |
| 3 or 4 Children | 0 (0.0%) | 0 (0.0%) |
| 5 or more Children | 0 (0.0%) | 0 (0.0%) |
| Total | 0 (0.0%) | 69 (15.5%) |
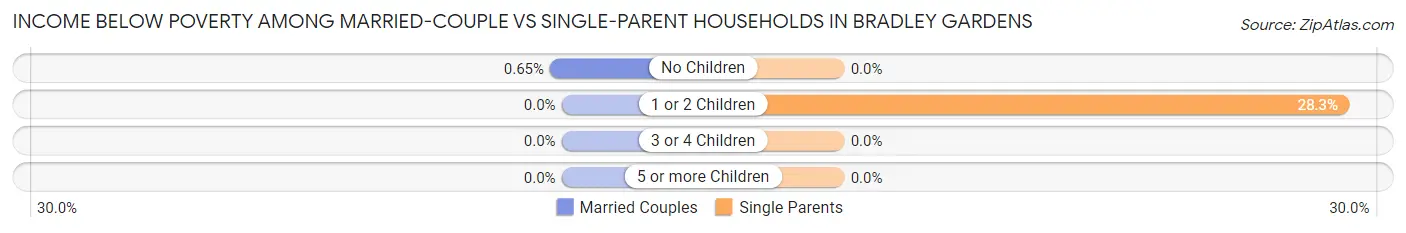
Income Below Poverty Among Married-Couple vs Single-Parent Households in Bradley Gardens
The poverty data for Bradley Gardens shows that 10 of the married-couple family households (0.3%) and 69 of the single-parent households (13.0%) are living below the poverty level. Within the married-couple family households, those with no children have the highest poverty rate, with 10 households (0.6%) falling below the poverty line. Among the single-parent households, those with 1 or 2 children have the highest poverty rate, with 69 household (28.3%) living below poverty.
| Children | Married-Couple Families | Single-Parent Households |
| No Children | 10 (0.6%) | 0 (0.0%) |
| 1 or 2 Children | 0 (0.0%) | 69 (28.3%) |
| 3 or 4 Children | 0 (0.0%) | 0 (0.0%) |
| 5 or more Children | 0 (0.0%) | 0 (0.0%) |
| Total | 10 (0.3%) | 69 (13.0%) |
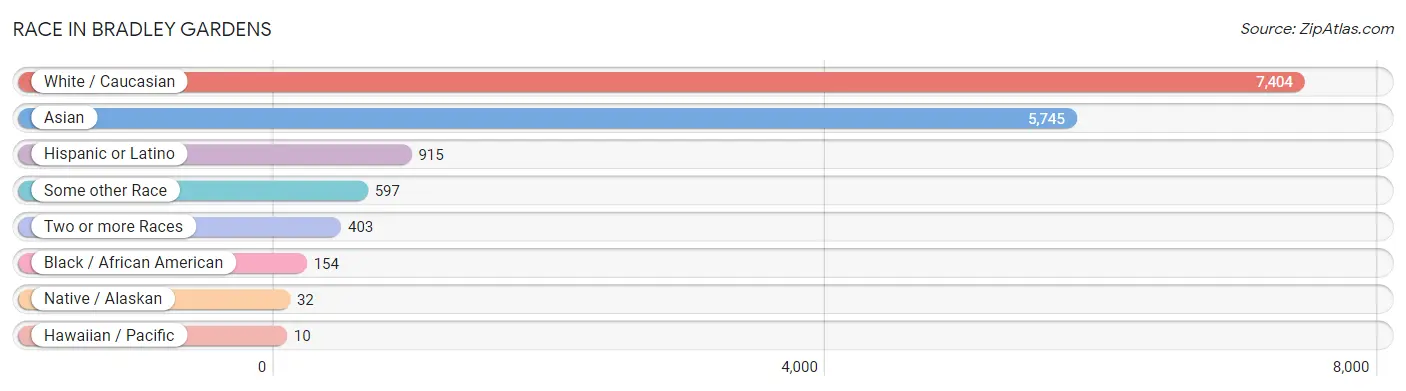
Race in Bradley Gardens
The most populous races in Bradley Gardens are White / Caucasian (7,404 | 51.6%), Asian (5,745 | 40.1%), and Hispanic or Latino (915 | 6.4%).
| Race | # Population | % Population |
| Asian | 5,745 | 40.1% |
| Black / African American | 154 | 1.1% |
| Hawaiian / Pacific | 10 | 0.1% |
| Hispanic or Latino | 915 | 6.4% |
| Native / Alaskan | 32 | 0.2% |
| White / Caucasian | 7,404 | 51.6% |
| Two or more Races | 403 | 2.8% |
| Some other Race | 597 | 4.2% |
| Total | 14,345 | 100.0% |
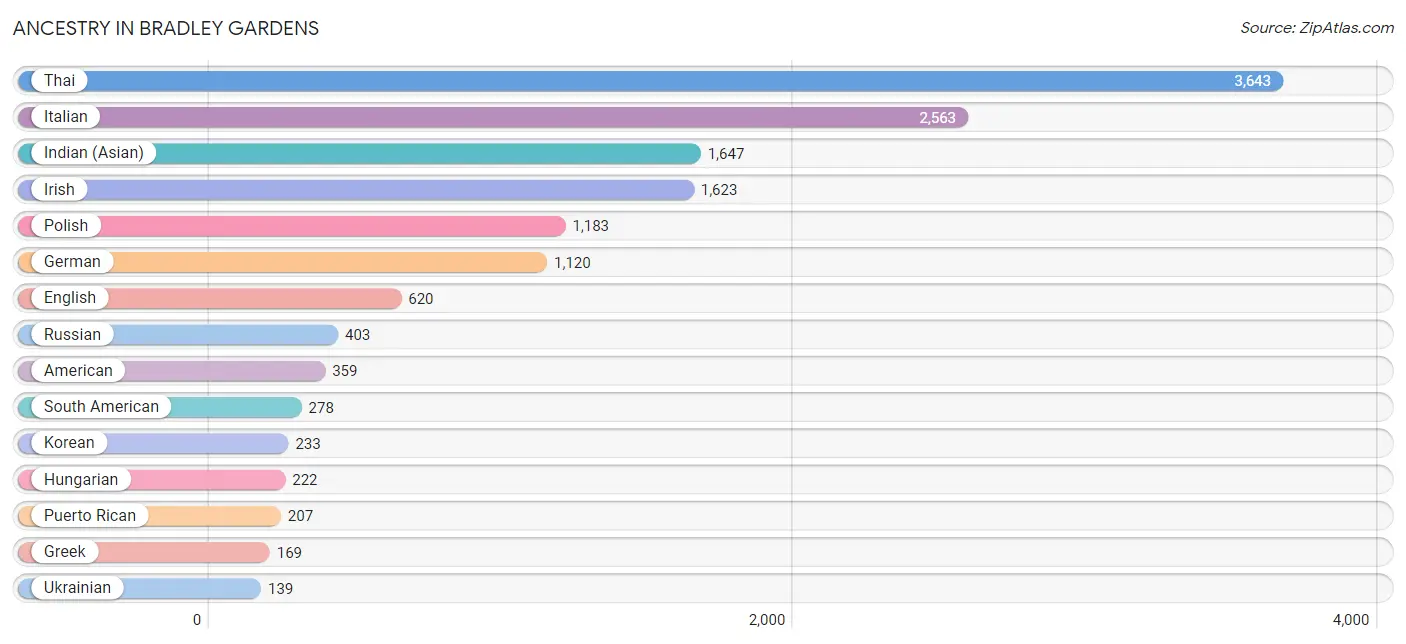
Ancestry in Bradley Gardens
The most populous ancestries reported in Bradley Gardens are Thai (3,643 | 25.4%), Italian (2,563 | 17.9%), Indian (Asian) (1,647 | 11.5%), Irish (1,623 | 11.3%), and Polish (1,183 | 8.3%), together accounting for 74.3% of all Bradley Gardens residents.
| Ancestry | # Population | % Population |
| American | 359 | 2.5% |
| Apache | 6 | 0.0% |
| Arab | 24 | 0.2% |
| Austrian | 80 | 0.6% |
| Belgian | 14 | 0.1% |
| Bolivian | 14 | 0.1% |
| Brazilian | 20 | 0.1% |
| Burmese | 89 | 0.6% |
| Canadian | 7 | 0.1% |
| Central American | 131 | 0.9% |
| Central American Indian | 114 | 0.8% |
| Colombian | 87 | 0.6% |
| Costa Rican | 81 | 0.6% |
| Cuban | 50 | 0.4% |
| Czech | 18 | 0.1% |
| Czechoslovakian | 50 | 0.4% |
| Dominican | 83 | 0.6% |
| Dutch | 90 | 0.6% |
| Eastern European | 77 | 0.5% |
| Ecuadorian | 21 | 0.2% |
| English | 620 | 4.3% |
| European | 9 | 0.1% |
| Filipino | 55 | 0.4% |
| Finnish | 19 | 0.1% |
| French | 57 | 0.4% |
| French Canadian | 42 | 0.3% |
| German | 1,120 | 7.8% |
| Ghanaian | 7 | 0.1% |
| Greek | 169 | 1.2% |
| Guatemalan | 38 | 0.3% |
| Hungarian | 222 | 1.5% |
| Indian (Asian) | 1,647 | 11.5% |
| Iraqi | 15 | 0.1% |
| Irish | 1,623 | 11.3% |
| Italian | 2,563 | 17.9% |
| Korean | 233 | 1.6% |
| Lebanese | 9 | 0.1% |
| Lithuanian | 71 | 0.5% |
| Maltese | 83 | 0.6% |
| Mexican | 26 | 0.2% |
| Native Hawaiian | 10 | 0.1% |
| Norwegian | 123 | 0.9% |
| Pennsylvania German | 11 | 0.1% |
| Peruvian | 131 | 0.9% |
| Polish | 1,183 | 8.3% |
| Portuguese | 130 | 0.9% |
| Puerto Rican | 207 | 1.4% |
| Russian | 403 | 2.8% |
| Salvadoran | 12 | 0.1% |
| Scotch-Irish | 54 | 0.4% |
| Scottish | 123 | 0.9% |
| Slovak | 107 | 0.7% |
| South African | 10 | 0.1% |
| South American | 278 | 1.9% |
| Spanish | 21 | 0.2% |
| Subsaharan African | 125 | 0.9% |
| Swedish | 104 | 0.7% |
| Swiss | 8 | 0.1% |
| Thai | 3,643 | 25.4% |
| Ukrainian | 139 | 1.0% |
| Venezuelan | 25 | 0.2% | View All 61 Rows |
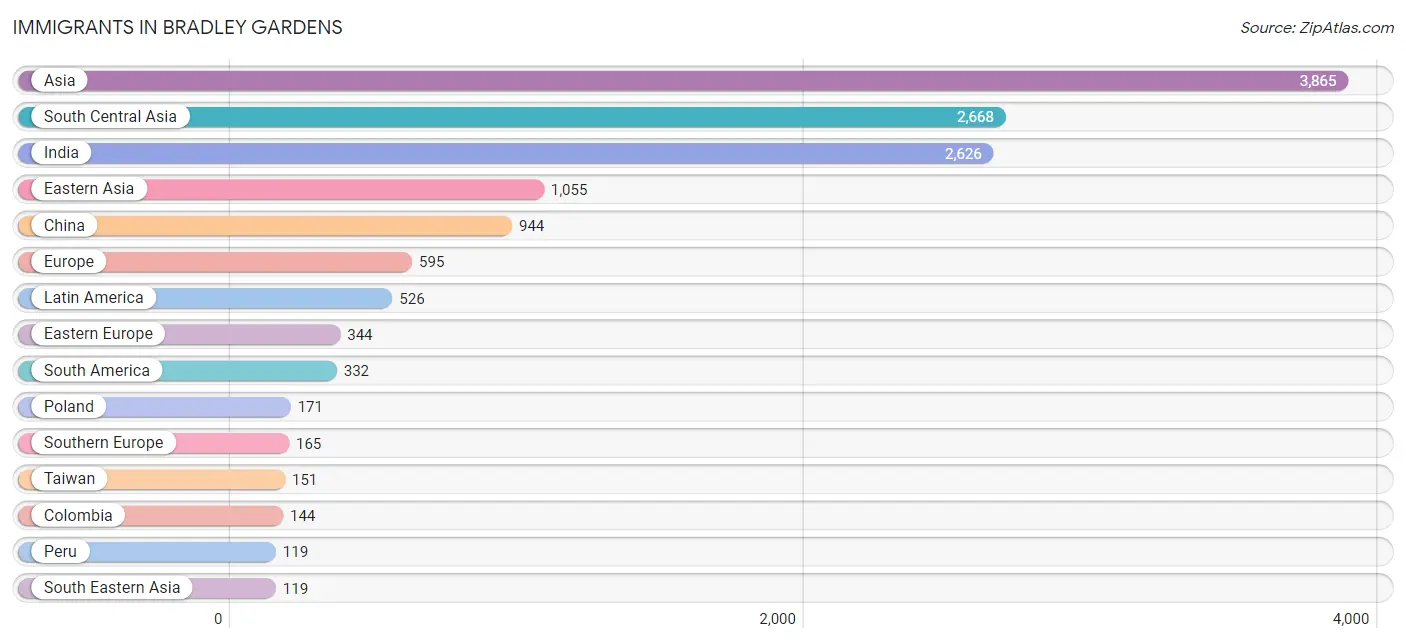
Immigrants in Bradley Gardens
The most numerous immigrant groups reported in Bradley Gardens came from Asia (3,865 | 26.9%), South Central Asia (2,668 | 18.6%), India (2,626 | 18.3%), Eastern Asia (1,055 | 7.3%), and China (944 | 6.6%), together accounting for 77.8% of all Bradley Gardens residents.
| Immigration Origin | # Population | % Population |
| Africa | 105 | 0.7% |
| Asia | 3,865 | 26.9% |
| Belarus | 68 | 0.5% |
| Belgium | 14 | 0.1% |
| Bolivia | 14 | 0.1% |
| Brazil | 20 | 0.1% |
| Canada | 70 | 0.5% |
| Caribbean | 95 | 0.7% |
| Central America | 99 | 0.7% |
| China | 944 | 6.6% |
| Colombia | 144 | 1.0% |
| Costa Rica | 74 | 0.5% |
| Cuba | 12 | 0.1% |
| Dominican Republic | 83 | 0.6% |
| Eastern Africa | 88 | 0.6% |
| Eastern Asia | 1,055 | 7.3% |
| Eastern Europe | 344 | 2.4% |
| Ecuador | 10 | 0.1% |
| England | 16 | 0.1% |
| Europe | 595 | 4.2% |
| France | 10 | 0.1% |
| Germany | 28 | 0.2% |
| Ghana | 7 | 0.1% |
| Greece | 9 | 0.1% |
| Guatemala | 25 | 0.2% |
| Hong Kong | 55 | 0.4% |
| Hungary | 27 | 0.2% |
| India | 2,626 | 18.3% |
| Iraq | 15 | 0.1% |
| Italy | 70 | 0.5% |
| Kazakhstan | 23 | 0.2% |
| Korea | 111 | 0.8% |
| Latin America | 526 | 3.7% |
| Malaysia | 11 | 0.1% |
| Northern Europe | 34 | 0.2% |
| Pakistan | 9 | 0.1% |
| Peru | 119 | 0.8% |
| Philippines | 108 | 0.7% |
| Poland | 171 | 1.2% |
| Portugal | 86 | 0.6% |
| Romania | 16 | 0.1% |
| Russia | 62 | 0.4% |
| Scotland | 9 | 0.1% |
| South Africa | 10 | 0.1% |
| South America | 332 | 2.3% |
| South Central Asia | 2,668 | 18.6% |
| South Eastern Asia | 119 | 0.8% |
| Southern Europe | 165 | 1.1% |
| Sri Lanka | 10 | 0.1% |
| Sweden | 9 | 0.1% |
| Taiwan | 151 | 1.1% |
| Uganda | 9 | 0.1% |
| Venezuela | 25 | 0.2% |
| Western Africa | 7 | 0.1% |
| Western Asia | 23 | 0.2% |
| Western Europe | 52 | 0.4% | View All 56 Rows |
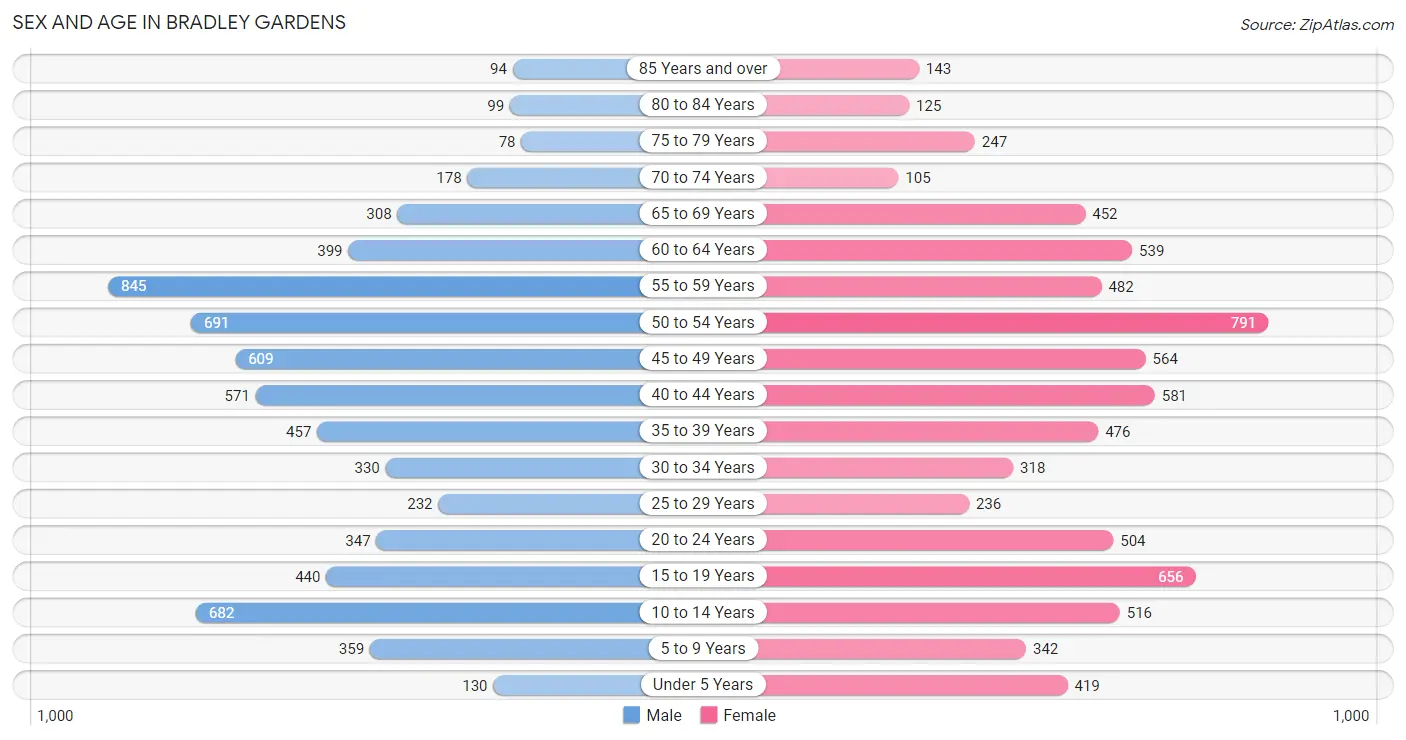
Sex and Age in Bradley Gardens
Sex and Age in Bradley Gardens
The most populous age groups in Bradley Gardens are 55 to 59 Years (845 | 12.3%) for men and 50 to 54 Years (791 | 10.5%) for women.
| Age Bracket | Male | Female |
| Under 5 Years | 130 (1.9%) | 419 (5.6%) |
| 5 to 9 Years | 359 (5.2%) | 342 (4.6%) |
| 10 to 14 Years | 682 (10.0%) | 516 (6.9%) |
| 15 to 19 Years | 440 (6.4%) | 656 (8.7%) |
| 20 to 24 Years | 347 (5.1%) | 504 (6.7%) |
| 25 to 29 Years | 232 (3.4%) | 236 (3.2%) |
| 30 to 34 Years | 330 (4.8%) | 318 (4.2%) |
| 35 to 39 Years | 457 (6.7%) | 476 (6.4%) |
| 40 to 44 Years | 571 (8.3%) | 581 (7.7%) |
| 45 to 49 Years | 609 (8.9%) | 564 (7.5%) |
| 50 to 54 Years | 691 (10.1%) | 791 (10.5%) |
| 55 to 59 Years | 845 (12.3%) | 482 (6.4%) |
| 60 to 64 Years | 399 (5.8%) | 539 (7.2%) |
| 65 to 69 Years | 308 (4.5%) | 452 (6.0%) |
| 70 to 74 Years | 178 (2.6%) | 105 (1.4%) |
| 75 to 79 Years | 78 (1.1%) | 247 (3.3%) |
| 80 to 84 Years | 99 (1.5%) | 125 (1.7%) |
| 85 Years and over | 94 (1.4%) | 143 (1.9%) |
| Total | 6,849 (100.0%) | 7,496 (100.0%) |
Families and Households in Bradley Gardens
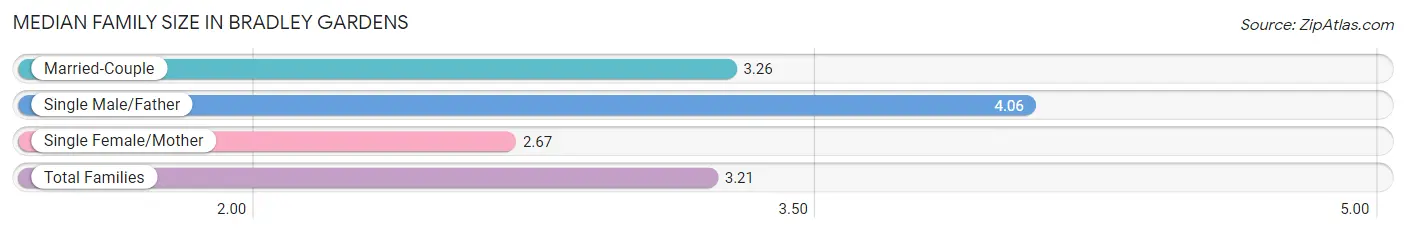
Median Family Size in Bradley Gardens
The median family size in Bradley Gardens is 3.21 persons per family, with single male/father families (87 | 2.2%) accounting for the largest median family size of 4.06 persons per family. On the other hand, single female/mother families (444 | 11.3%) represent the smallest median family size with 2.67 persons per family.
| Family Type | # Families | Family Size |
| Married-Couple | 3,411 (86.5%) | 3.26 |
| Single Male/Father | 87 (2.2%) | 4.06 |
| Single Female/Mother | 444 (11.3%) | 2.67 |
| Total Families | 3,942 (100.0%) | 3.21 |
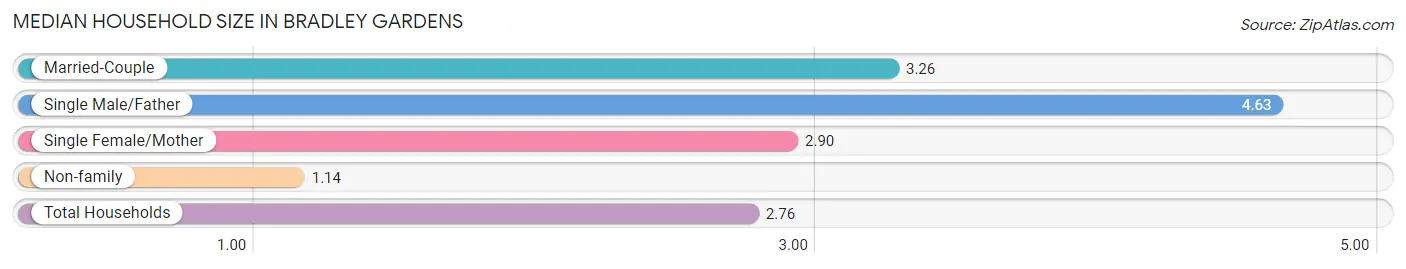
Median Household Size in Bradley Gardens
The median household size in Bradley Gardens is 2.76 persons per household, with single male/father households (87 | 1.7%) accounting for the largest median household size of 4.63 persons per household. non-family households (1,204 | 23.4%) represent the smallest median household size with 1.14 persons per household.
| Household Type | # Households | Household Size |
| Married-Couple | 3,411 (66.3%) | 3.26 |
| Single Male/Father | 87 (1.7%) | 4.63 |
| Single Female/Mother | 444 (8.6%) | 2.90 |
| Non-family | 1,204 (23.4%) | 1.14 |
| Total Households | 5,146 (100.0%) | 2.76 |
Household Size by Marriage Status in Bradley Gardens
Out of a total of 5,146 households in Bradley Gardens, 3,942 (76.6%) are family households, while 1,204 (23.4%) are nonfamily households. The most numerous type of family households are 3-person households, comprising 1,330, and the most common type of nonfamily households are 1-person households, comprising 1,062.
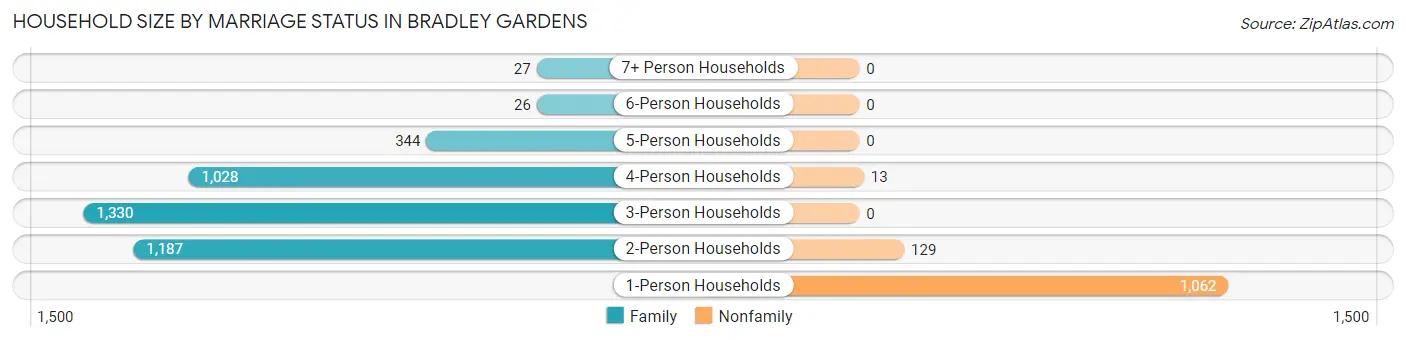
| Household Size | Family Households | Nonfamily Households |
| 1-Person Households | - | 1,062 (20.6%) |
| 2-Person Households | 1,187 (23.1%) | 129 (2.5%) |
| 3-Person Households | 1,330 (25.9%) | 0 (0.0%) |
| 4-Person Households | 1,028 (20.0%) | 13 (0.3%) |
| 5-Person Households | 344 (6.7%) | 0 (0.0%) |
| 6-Person Households | 26 (0.5%) | 0 (0.0%) |
| 7+ Person Households | 27 (0.5%) | 0 (0.0%) |
| Total | 3,942 (76.6%) | 1,204 (23.4%) |
Female Fertility in Bradley Gardens
Fertility by Age in Bradley Gardens
Average fertility rate in Bradley Gardens is 51.0 births per 1,000 women. Women in the age bracket of 20 to 34 years have the highest fertility rate with 65.0 births per 1,000 women. Women in the age bracket of 35 to 50 years acount for 60.3% of all women with births.
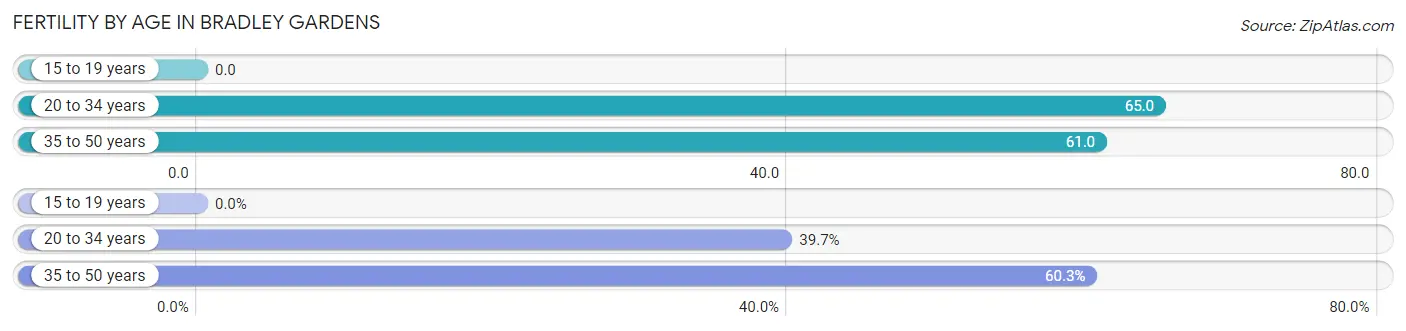
| Age Bracket | Women with Births | Births / 1,000 Women |
| 15 to 19 years | 0 (0.0%) | 0.0 |
| 20 to 34 years | 69 (39.7%) | 65.0 |
| 35 to 50 years | 105 (60.3%) | 61.0 |
| Total | 174 (100.0%) | 51.0 |
Fertility by Age by Marriage Status in Bradley Gardens
58.0% of women with births (174) in Bradley Gardens are married. The highest percentage of unmarried women with births falls into 35 to 50 years age bracket with 69.5% of them unmarried at the time of birth, while the lowest percentage of unmarried women with births belong to 20 to 34 years age bracket with 0.0% of them unmarried.
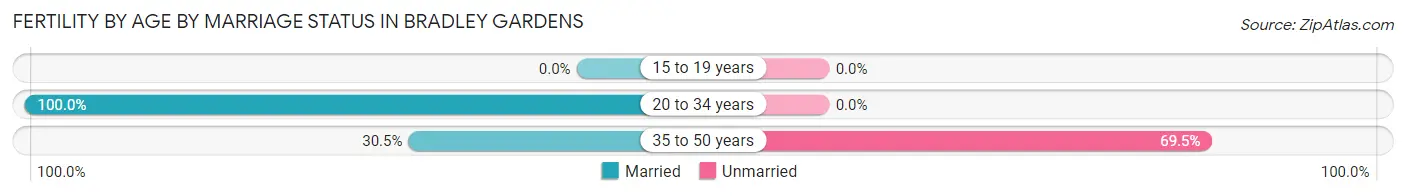
| Age Bracket | Married | Unmarried |
| 15 to 19 years | 0 (0.0%) | 0 (0.0%) |
| 20 to 34 years | 69 (100.0%) | 0 (0.0%) |
| 35 to 50 years | 32 (30.5%) | 73 (69.5%) |
| Total | 101 (58.1%) | 73 (41.9%) |
Fertility by Education in Bradley Gardens
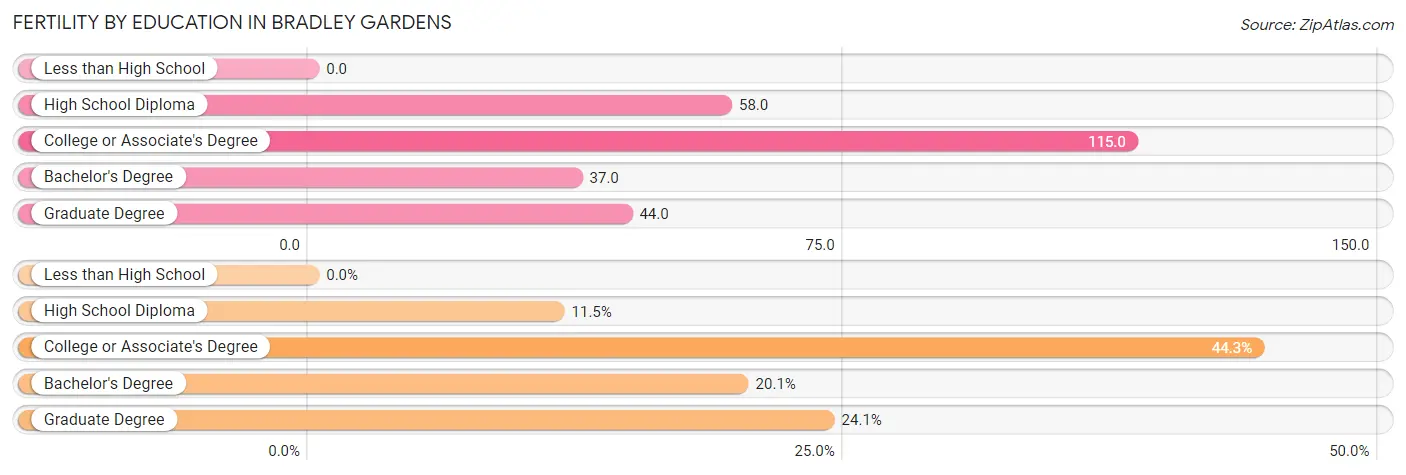
| Educational Attainment | Women with Births | Births / 1,000 Women |
| Less than High School | 0 (0.0%) | 0.0 |
| High School Diploma | 20 (11.5%) | 58.0 |
| College or Associate's Degree | 77 (44.3%) | 115.0 |
| Bachelor's Degree | 35 (20.1%) | 37.0 |
| Graduate Degree | 42 (24.1%) | 44.0 |
| Total | 174 (100.0%) | 51.0 |
Fertility by Education by Marriage Status in Bradley Gardens
41.9% of women with births in Bradley Gardens are unmarried. Women with the educational attainment of bachelor's degree are most likely to be married with 100.0% of them married at childbirth, while women with the educational attainment of high school diploma are least likely to be married with 100.0% of them unmarried at childbirth.
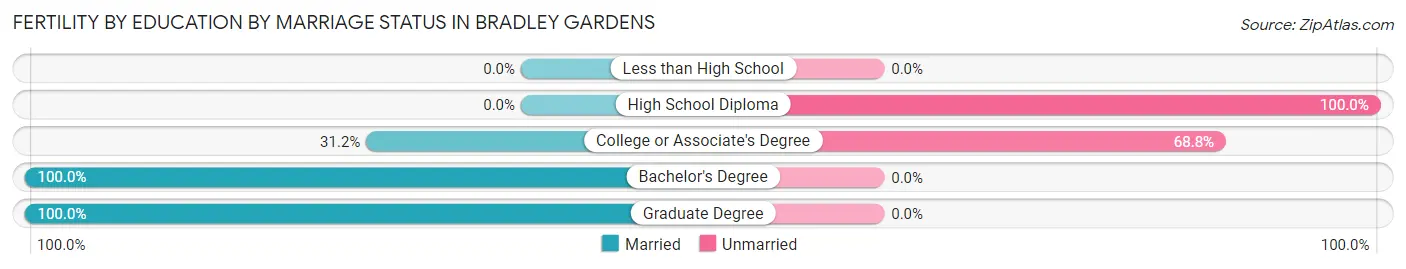
| Educational Attainment | Married | Unmarried |
| Less than High School | 0 (0.0%) | 0 (0.0%) |
| High School Diploma | 0 (0.0%) | 20 (100.0%) |
| College or Associate's Degree | 24 (31.2%) | 53 (68.8%) |
| Bachelor's Degree | 35 (100.0%) | 0 (0.0%) |
| Graduate Degree | 42 (100.0%) | 0 (0.0%) |
| Total | 101 (58.1%) | 73 (41.9%) |
Employment Characteristics in Bradley Gardens
Employment by Class of Employer in Bradley Gardens
Among the 7,951 employed individuals in Bradley Gardens, private company employees (6,315 | 79.4%), local government employees (575 | 7.2%), and not-for-profit organizations (342 | 4.3%) make up the most common classes of employment.
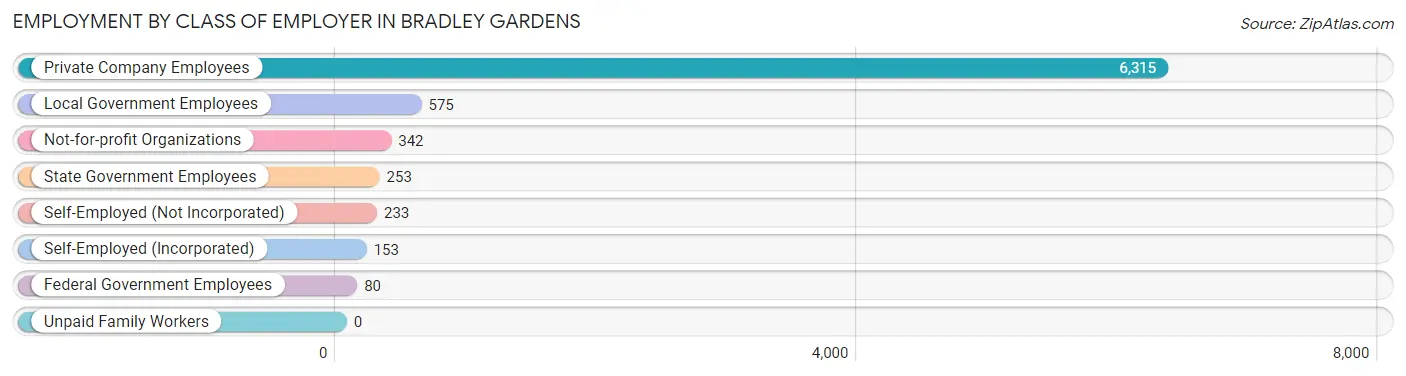
| Employer Class | # Employees | % Employees |
| Private Company Employees | 6,315 | 79.4% |
| Self-Employed (Incorporated) | 153 | 1.9% |
| Self-Employed (Not Incorporated) | 233 | 2.9% |
| Not-for-profit Organizations | 342 | 4.3% |
| Local Government Employees | 575 | 7.2% |
| State Government Employees | 253 | 3.2% |
| Federal Government Employees | 80 | 1.0% |
| Unpaid Family Workers | 0 | 0.0% |
| Total | 7,951 | 100.0% |
Employment Status by Age in Bradley Gardens
According to the labor force statistics for Bradley Gardens, out of the total population over 16 years of age (11,675), 71.5% or 8,348 individuals are in the labor force, with 3.1% or 259 of them unemployed. The age group with the highest labor force participation rate is 25 to 29 years, with 93.6% or 438 individuals in the labor force. Within the labor force, the 30 to 34 years age range has the highest percentage of unemployed individuals, with 8.5% or 46 of them being unemployed.
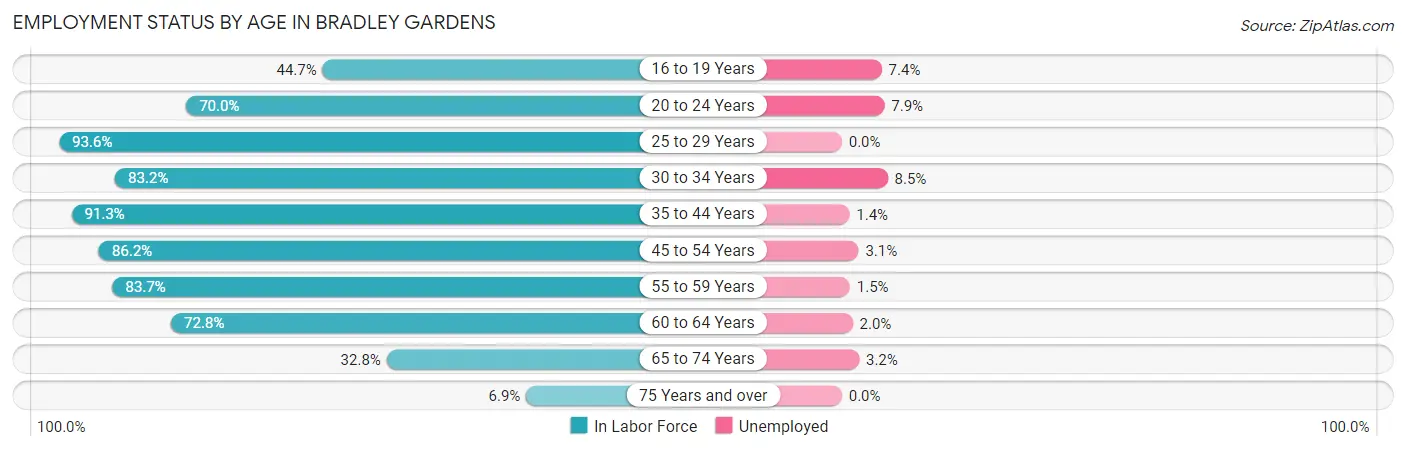
| Age Bracket | In Labor Force | Unemployed |
| 16 to 19 Years | 391 (44.7%) | 29 (7.4%) |
| 20 to 24 Years | 596 (70.0%) | 47 (7.9%) |
| 25 to 29 Years | 438 (93.6%) | 0 (0.0%) |
| 30 to 34 Years | 539 (83.2%) | 46 (8.5%) |
| 35 to 44 Years | 1,904 (91.3%) | 27 (1.4%) |
| 45 to 54 Years | 2,289 (86.2%) | 71 (3.1%) |
| 55 to 59 Years | 1,111 (83.7%) | 17 (1.5%) |
| 60 to 64 Years | 683 (72.8%) | 14 (2.0%) |
| 65 to 74 Years | 342 (32.8%) | 11 (3.2%) |
| 75 Years and over | 54 (6.9%) | 0 (0.0%) |
| Total | 8,348 (71.5%) | 259 (3.1%) |
Employment Status by Educational Attainment in Bradley Gardens
According to labor force statistics for Bradley Gardens, 85.7% of individuals (6,960) out of the total population between 25 and 64 years of age (8,121) are in the labor force, with 2.5% or 174 of them being unemployed. The group with the highest labor force participation rate are those with the educational attainment of bachelor's degree or higher, with 89.3% or 5,043 individuals in the labor force. Within the labor force, individuals with college / associate degree education have the highest percentage of unemployment, with 6.5% or 79 of them being unemployed.
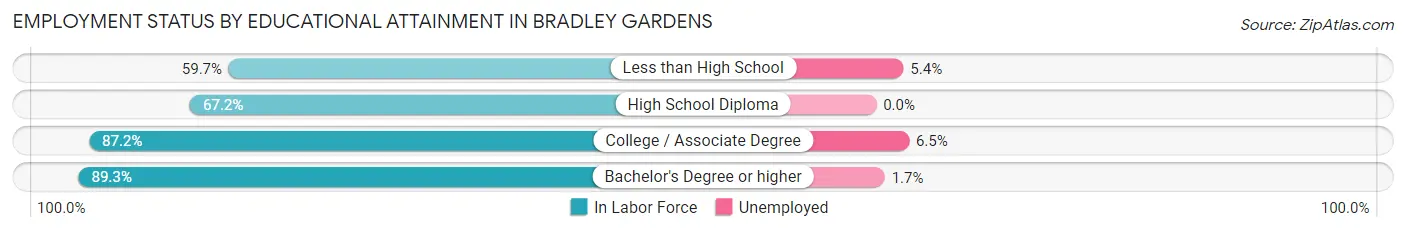
| Educational Attainment | In Labor Force | Unemployed |
| Less than High School | 184 (59.7%) | 17 (5.4%) |
| High School Diploma | 516 (67.2%) | 0 (0.0%) |
| College / Associate Degree | 1,219 (87.2%) | 91 (6.5%) |
| Bachelor's Degree or higher | 5,043 (89.3%) | 96 (1.7%) |
| Total | 6,960 (85.7%) | 203 (2.5%) |
Employment Occupations by Sex in Bradley Gardens
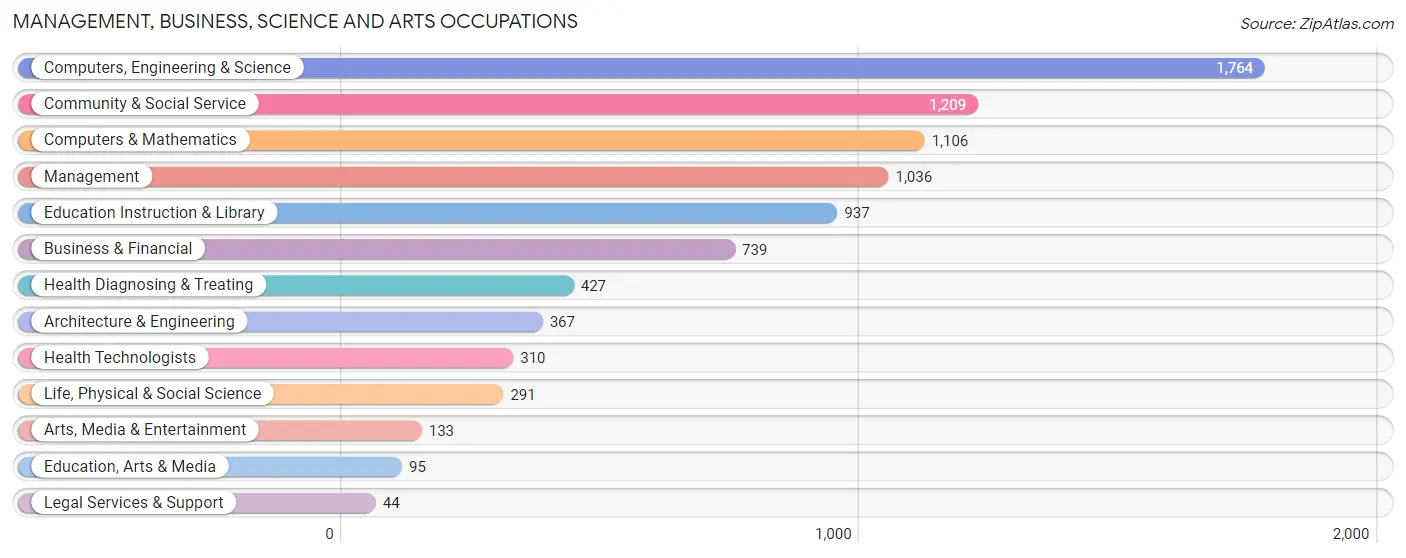
Management, Business, Science and Arts Occupations
The most common Management, Business, Science and Arts occupations in Bradley Gardens are Computers, Engineering & Science (1,764 | 21.8%), Community & Social Service (1,209 | 15.0%), Computers & Mathematics (1,106 | 13.7%), Management (1,036 | 12.8%), and Education Instruction & Library (937 | 11.6%).
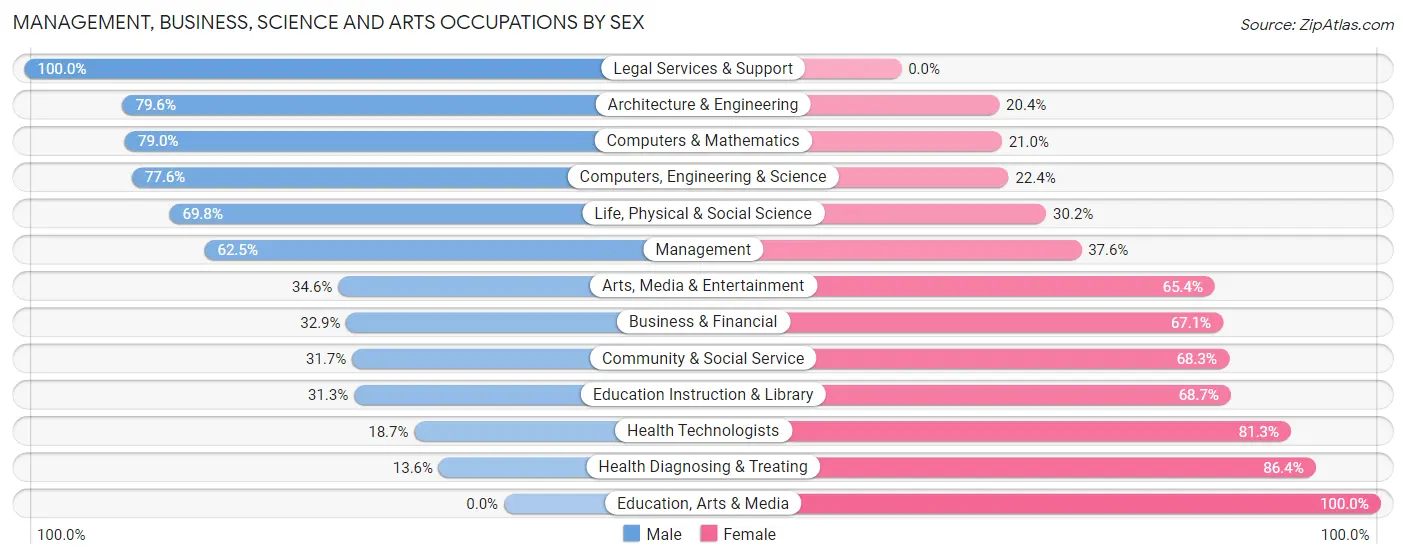
Management, Business, Science and Arts Occupations by Sex
Within the Management, Business, Science and Arts occupations in Bradley Gardens, the most male-oriented occupations are Legal Services & Support (100.0%), Architecture & Engineering (79.6%), and Computers & Mathematics (79.0%), while the most female-oriented occupations are Education, Arts & Media (100.0%), Health Diagnosing & Treating (86.4%), and Health Technologists (81.3%).
| Occupation | Male | Female |
| Management | 647 (62.5%) | 389 (37.6%) |
| Business & Financial | 243 (32.9%) | 496 (67.1%) |
| Computers, Engineering & Science | 1,369 (77.6%) | 395 (22.4%) |
| Computers & Mathematics | 874 (79.0%) | 232 (21.0%) |
| Architecture & Engineering | 292 (79.6%) | 75 (20.4%) |
| Life, Physical & Social Science | 203 (69.8%) | 88 (30.2%) |
| Community & Social Service | 383 (31.7%) | 826 (68.3%) |
| Education, Arts & Media | 0 (0.0%) | 95 (100.0%) |
| Legal Services & Support | 44 (100.0%) | 0 (0.0%) |
| Education Instruction & Library | 293 (31.3%) | 644 (68.7%) |
| Arts, Media & Entertainment | 46 (34.6%) | 87 (65.4%) |
| Health Diagnosing & Treating | 58 (13.6%) | 369 (86.4%) |
| Health Technologists | 58 (18.7%) | 252 (81.3%) |
| Total (Category) | 2,700 (52.2%) | 2,475 (47.8%) |
| Total (Overall) | 4,059 (50.2%) | 4,025 (49.8%) |
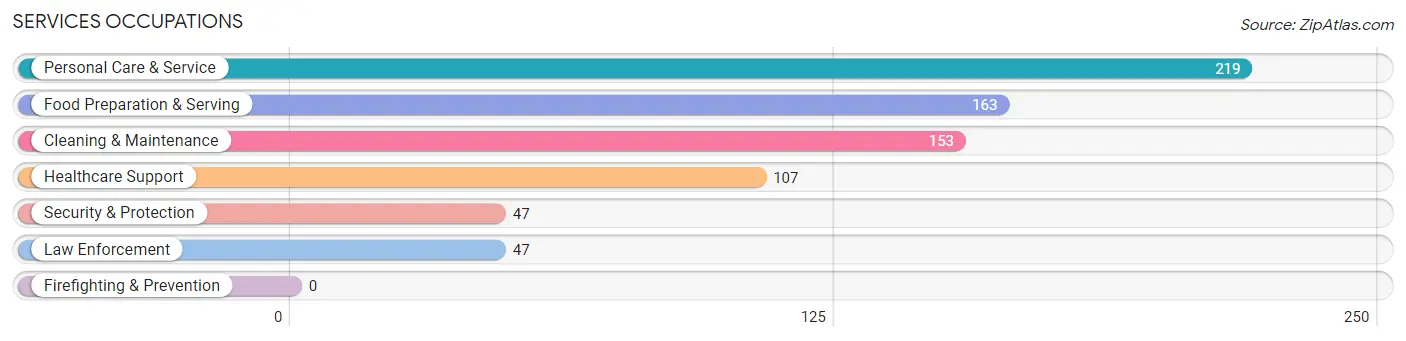
Services Occupations
The most common Services occupations in Bradley Gardens are Personal Care & Service (219 | 2.7%), Food Preparation & Serving (163 | 2.0%), Cleaning & Maintenance (153 | 1.9%), Healthcare Support (107 | 1.3%), and Security & Protection (47 | 0.6%).
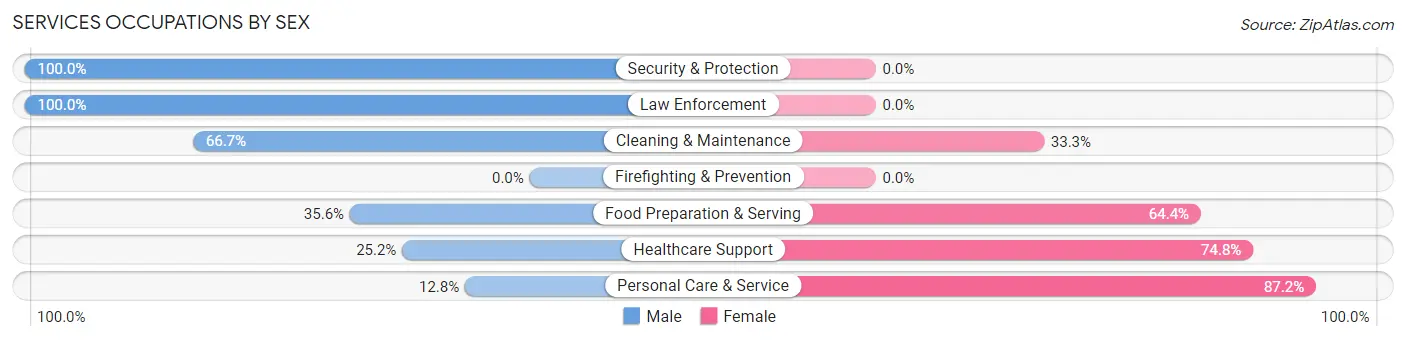
Services Occupations by Sex
Within the Services occupations in Bradley Gardens, the most male-oriented occupations are Security & Protection (100.0%), Law Enforcement (100.0%), and Cleaning & Maintenance (66.7%), while the most female-oriented occupations are Personal Care & Service (87.2%), Healthcare Support (74.8%), and Food Preparation & Serving (64.4%).
| Occupation | Male | Female |
| Healthcare Support | 27 (25.2%) | 80 (74.8%) |
| Security & Protection | 47 (100.0%) | 0 (0.0%) |
| Firefighting & Prevention | 0 (0.0%) | 0 (0.0%) |
| Law Enforcement | 47 (100.0%) | 0 (0.0%) |
| Food Preparation & Serving | 58 (35.6%) | 105 (64.4%) |
| Cleaning & Maintenance | 102 (66.7%) | 51 (33.3%) |
| Personal Care & Service | 28 (12.8%) | 191 (87.2%) |
| Total (Category) | 262 (38.0%) | 427 (62.0%) |
| Total (Overall) | 4,059 (50.2%) | 4,025 (49.8%) |
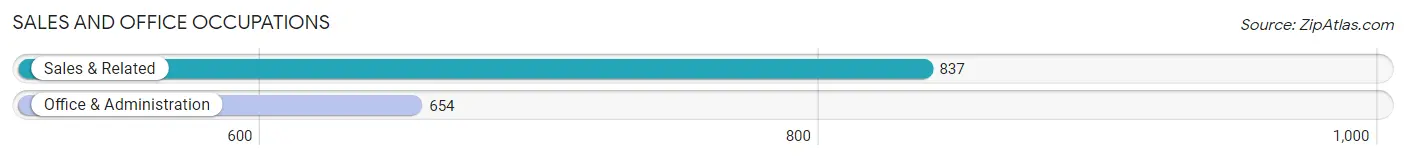
Sales and Office Occupations
The most common Sales and Office occupations in Bradley Gardens are Sales & Related (837 | 10.3%), and Office & Administration (654 | 8.1%).
Sales and Office Occupations by Sex
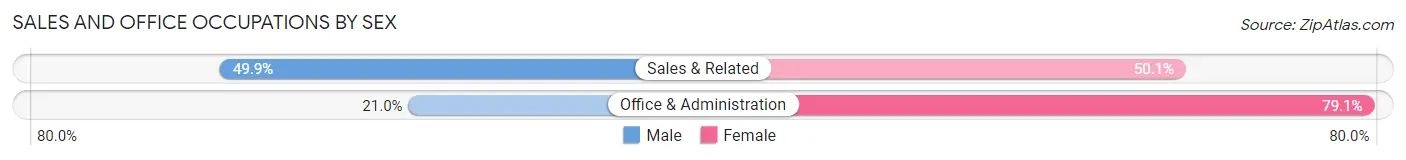
| Occupation | Male | Female |
| Sales & Related | 418 (49.9%) | 419 (50.1%) |
| Office & Administration | 137 (20.9%) | 517 (79.0%) |
| Total (Category) | 555 (37.2%) | 936 (62.8%) |
| Total (Overall) | 4,059 (50.2%) | 4,025 (49.8%) |
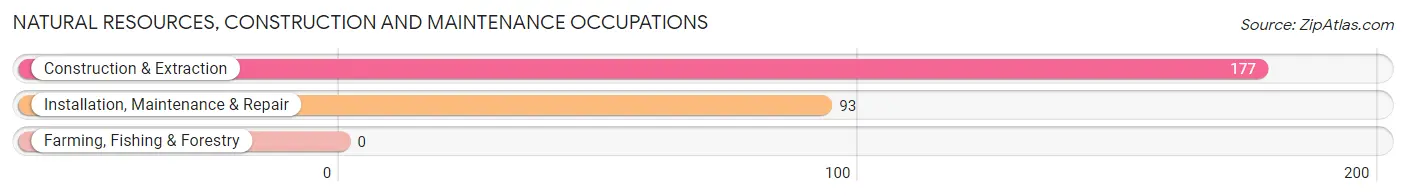
Natural Resources, Construction and Maintenance Occupations
The most common Natural Resources, Construction and Maintenance occupations in Bradley Gardens are Construction & Extraction (177 | 2.2%), and Installation, Maintenance & Repair (93 | 1.1%).
Natural Resources, Construction and Maintenance Occupations by Sex
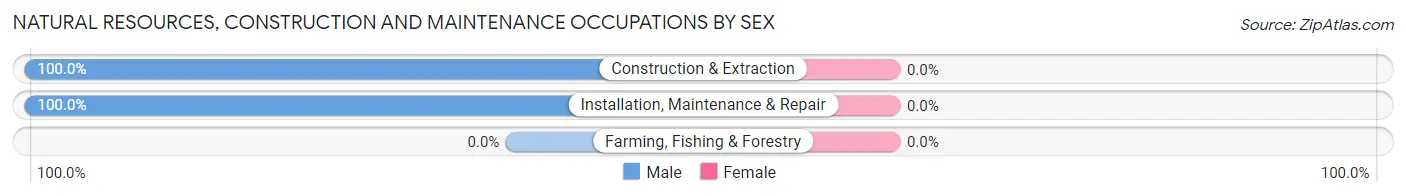
| Occupation | Male | Female |
| Farming, Fishing & Forestry | 0 (0.0%) | 0 (0.0%) |
| Construction & Extraction | 177 (100.0%) | 0 (0.0%) |
| Installation, Maintenance & Repair | 93 (100.0%) | 0 (0.0%) |
| Total (Category) | 270 (100.0%) | 0 (0.0%) |
| Total (Overall) | 4,059 (50.2%) | 4,025 (49.8%) |
Production, Transportation and Moving Occupations
The most common Production, Transportation and Moving occupations in Bradley Gardens are Production (208 | 2.6%), Transportation (133 | 1.7%), and Material Moving (118 | 1.5%).
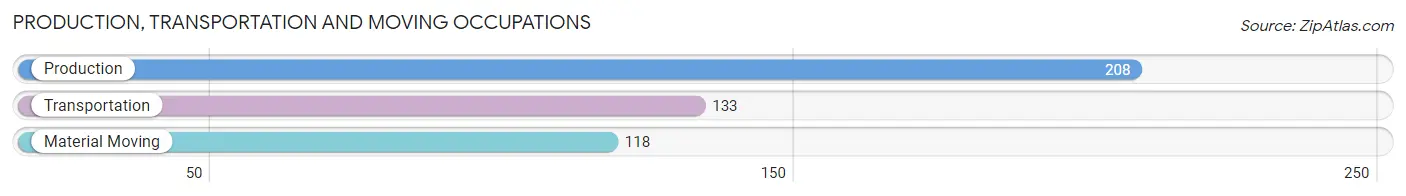
Production, Transportation and Moving Occupations by Sex
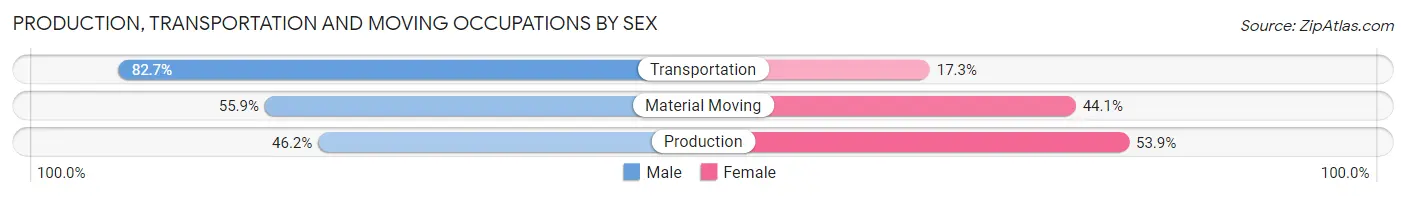
| Occupation | Male | Female |
| Production | 96 (46.2%) | 112 (53.8%) |
| Transportation | 110 (82.7%) | 23 (17.3%) |
| Material Moving | 66 (55.9%) | 52 (44.1%) |
| Total (Category) | 272 (59.3%) | 187 (40.7%) |
| Total (Overall) | 4,059 (50.2%) | 4,025 (49.8%) |
Employment Industries by Sex in Bradley Gardens
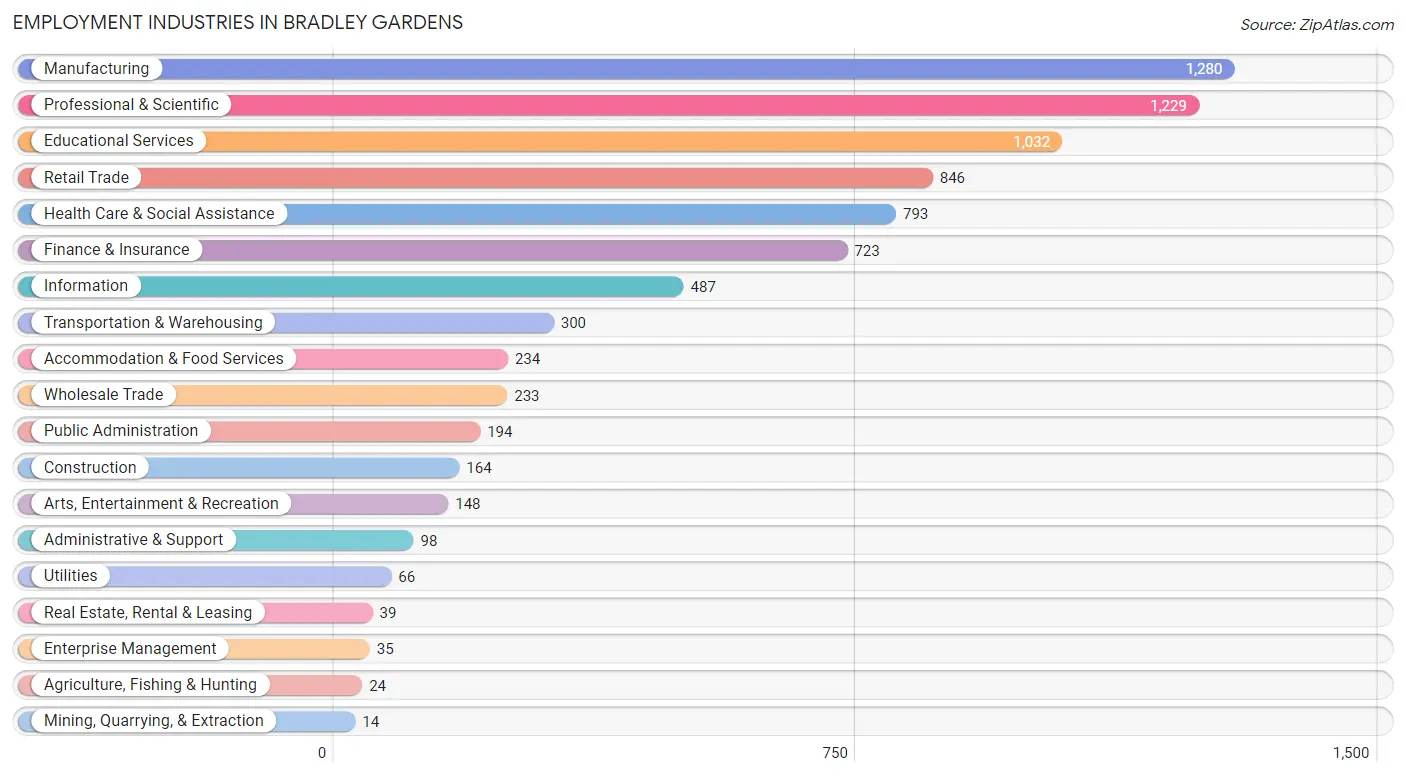
Employment Industries in Bradley Gardens
The major employment industries in Bradley Gardens include Manufacturing (1,280 | 15.8%), Professional & Scientific (1,229 | 15.2%), Educational Services (1,032 | 12.8%), Retail Trade (846 | 10.5%), and Health Care & Social Assistance (793 | 9.8%).
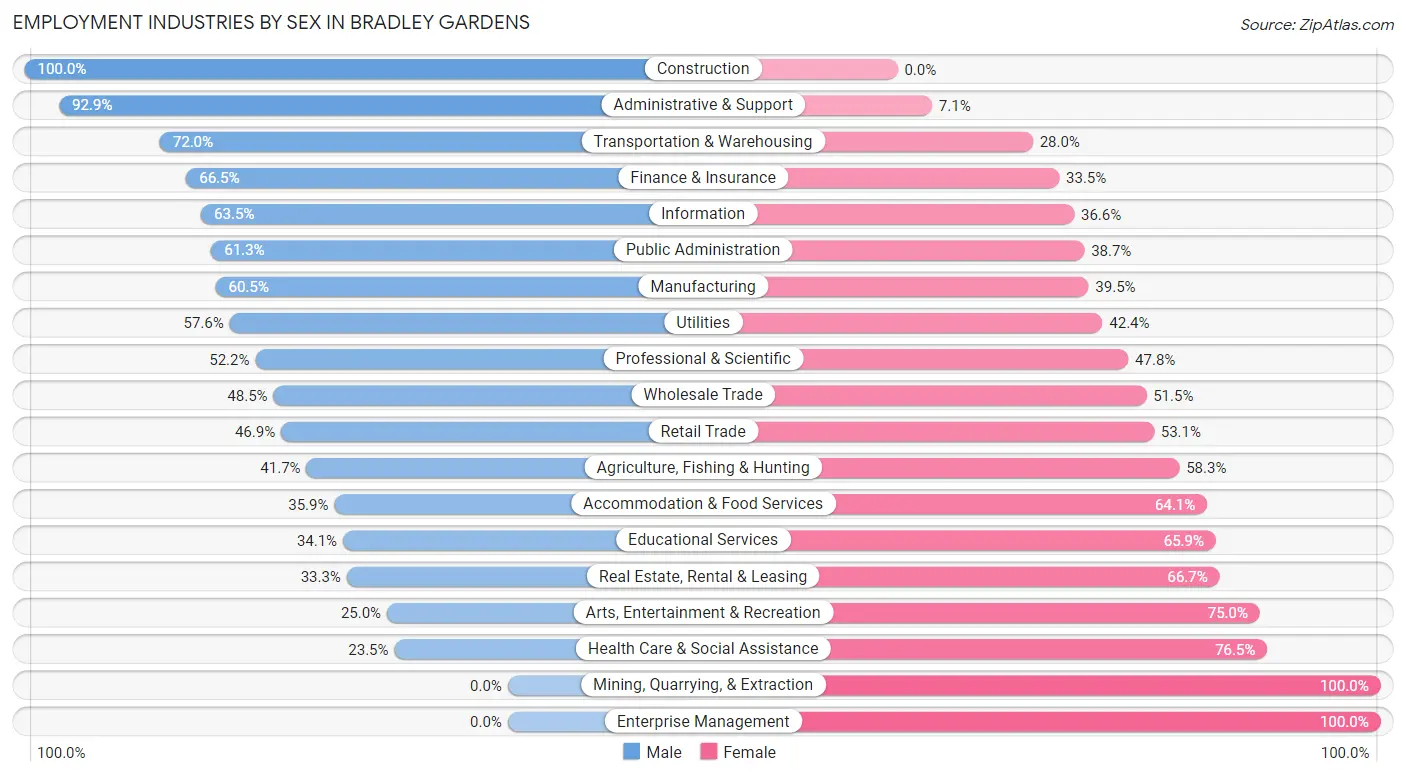
Employment Industries by Sex in Bradley Gardens
The Bradley Gardens industries that see more men than women are Construction (100.0%), Administrative & Support (92.9%), and Transportation & Warehousing (72.0%), whereas the industries that tend to have a higher number of women are Mining, Quarrying, & Extraction (100.0%), Enterprise Management (100.0%), and Health Care & Social Assistance (76.5%).
| Industry | Male | Female |
| Agriculture, Fishing & Hunting | 10 (41.7%) | 14 (58.3%) |
| Mining, Quarrying, & Extraction | 0 (0.0%) | 14 (100.0%) |
| Construction | 164 (100.0%) | 0 (0.0%) |
| Manufacturing | 774 (60.5%) | 506 (39.5%) |
| Wholesale Trade | 113 (48.5%) | 120 (51.5%) |
| Retail Trade | 397 (46.9%) | 449 (53.1%) |
| Transportation & Warehousing | 216 (72.0%) | 84 (28.0%) |
| Utilities | 38 (57.6%) | 28 (42.4%) |
| Information | 309 (63.4%) | 178 (36.5%) |
| Finance & Insurance | 481 (66.5%) | 242 (33.5%) |
| Real Estate, Rental & Leasing | 13 (33.3%) | 26 (66.7%) |
| Professional & Scientific | 642 (52.2%) | 587 (47.8%) |
| Enterprise Management | 0 (0.0%) | 35 (100.0%) |
| Administrative & Support | 91 (92.9%) | 7 (7.1%) |
| Educational Services | 352 (34.1%) | 680 (65.9%) |
| Health Care & Social Assistance | 186 (23.5%) | 607 (76.5%) |
| Arts, Entertainment & Recreation | 37 (25.0%) | 111 (75.0%) |
| Accommodation & Food Services | 84 (35.9%) | 150 (64.1%) |
| Public Administration | 119 (61.3%) | 75 (38.7%) |
| Total | 4,059 (50.2%) | 4,025 (49.8%) |
Education in Bradley Gardens
School Enrollment in Bradley Gardens
The most common levels of schooling among the 3,790 students in Bradley Gardens are high school (1,011 | 26.7%), middle school (844 | 22.3%), and college / undergraduate (717 | 18.9%).
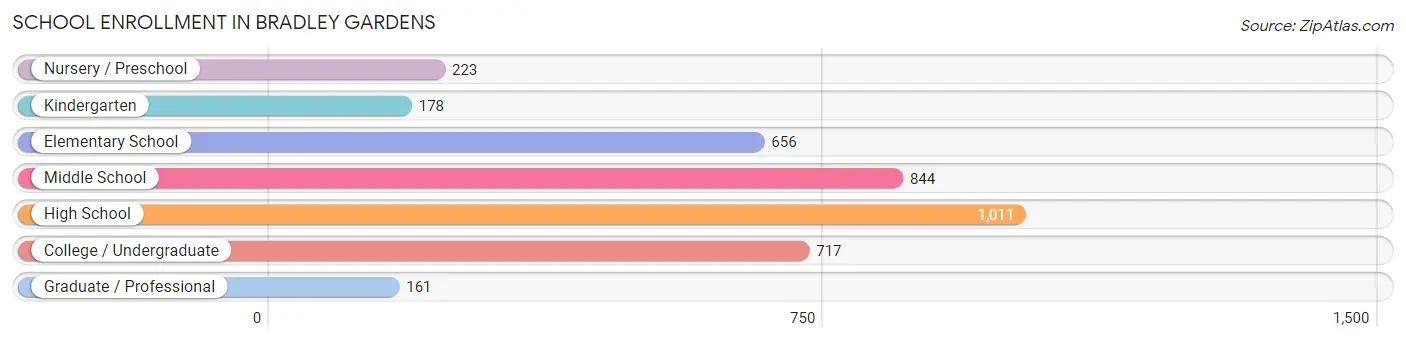
| School Level | # Students | % Students |
| Nursery / Preschool | 223 | 5.9% |
| Kindergarten | 178 | 4.7% |
| Elementary School | 656 | 17.3% |
| Middle School | 844 | 22.3% |
| High School | 1,011 | 26.7% |
| College / Undergraduate | 717 | 18.9% |
| Graduate / Professional | 161 | 4.3% |
| Total | 3,790 | 100.0% |
School Enrollment by Age by Funding Source in Bradley Gardens
Out of a total of 3,790 students who are enrolled in schools in Bradley Gardens, 667 (17.6%) attend a private institution, while the remaining 3,123 (82.4%) are enrolled in public schools. The age group of 3 to 4 year olds has the highest likelihood of being enrolled in private schools, with 83 (41.7% in the age bracket) enrolled. Conversely, the age group of 15 to 17 year olds has the lowest likelihood of being enrolled in a private school, with 749 (97.3% in the age bracket) attending a public institution.
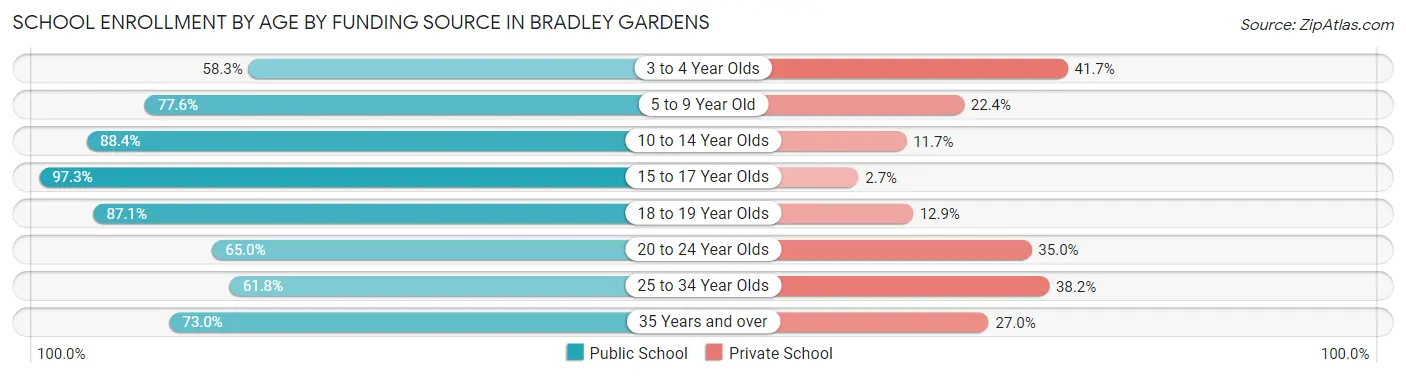
| Age Bracket | Public School | Private School |
| 3 to 4 Year Olds | 116 (58.3%) | 83 (41.7%) |
| 5 to 9 Year Old | 513 (77.6%) | 148 (22.4%) |
| 10 to 14 Year Olds | 1,031 (88.3%) | 136 (11.7%) |
| 15 to 17 Year Olds | 749 (97.3%) | 21 (2.7%) |
| 18 to 19 Year Olds | 271 (87.1%) | 40 (12.9%) |
| 20 to 24 Year Olds | 292 (65.0%) | 157 (35.0%) |
| 25 to 34 Year Olds | 105 (61.8%) | 65 (38.2%) |
| 35 Years and over | 46 (73.0%) | 17 (27.0%) |
| Total | 3,123 (82.4%) | 667 (17.6%) |
Educational Attainment by Field of Study in Bradley Gardens
Business (1,319 | 19.5%), engineering (1,249 | 18.5%), science & technology (678 | 10.0%), computers & mathematics (651 | 9.6%), and physical & health sciences (518 | 7.7%) are the most common fields of study among 6,763 individuals in Bradley Gardens who have obtained a bachelor's degree or higher.
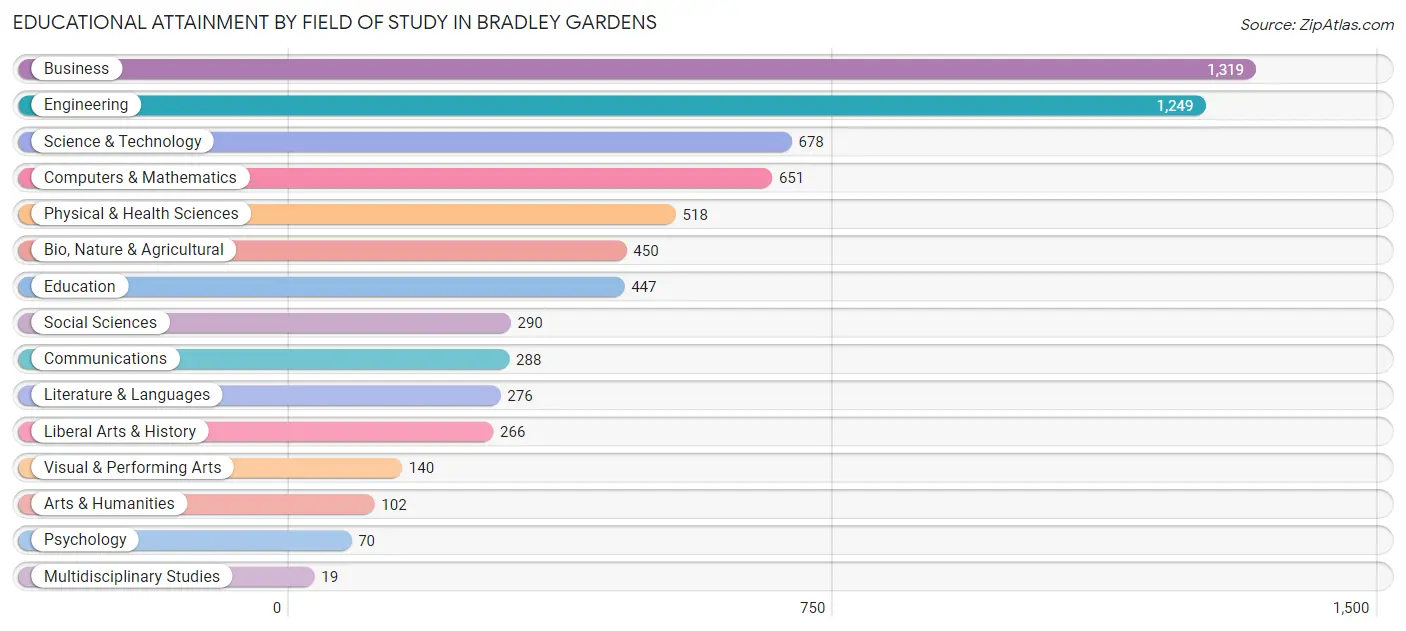
| Field of Study | # Graduates | % Graduates |
| Computers & Mathematics | 651 | 9.6% |
| Bio, Nature & Agricultural | 450 | 6.7% |
| Physical & Health Sciences | 518 | 7.7% |
| Psychology | 70 | 1.0% |
| Social Sciences | 290 | 4.3% |
| Engineering | 1,249 | 18.5% |
| Multidisciplinary Studies | 19 | 0.3% |
| Science & Technology | 678 | 10.0% |
| Business | 1,319 | 19.5% |
| Education | 447 | 6.6% |
| Literature & Languages | 276 | 4.1% |
| Liberal Arts & History | 266 | 3.9% |
| Visual & Performing Arts | 140 | 2.1% |
| Communications | 288 | 4.3% |
| Arts & Humanities | 102 | 1.5% |
| Total | 6,763 | 100.0% |
Transportation & Commute in Bradley Gardens
Vehicle Availability by Sex in Bradley Gardens
The most prevalent vehicle ownership categories in Bradley Gardens are males with 2 vehicles (2,047, accounting for 51.0%) and females with 2 vehicles (1,892, making up 52.0%).
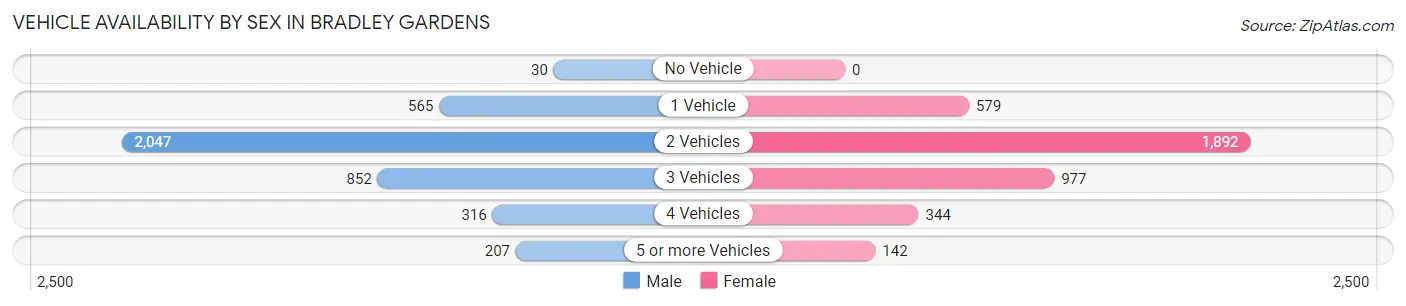
| Vehicles Available | Male | Female |
| No Vehicle | 30 (0.7%) | 0 (0.0%) |
| 1 Vehicle | 565 (14.1%) | 579 (14.7%) |
| 2 Vehicles | 2,047 (51.0%) | 1,892 (48.1%) |
| 3 Vehicles | 852 (21.2%) | 977 (24.8%) |
| 4 Vehicles | 316 (7.9%) | 344 (8.7%) |
| 5 or more Vehicles | 207 (5.1%) | 142 (3.6%) |
| Total | 4,017 (100.0%) | 3,934 (100.0%) |
Commute Time in Bradley Gardens
The most frequently occuring commute durations in Bradley Gardens are 45 to 59 minutes (1,082 commuters, 17.3%), 10 to 14 minutes (889 commuters, 14.2%), and 15 to 19 minutes (771 commuters, 12.3%).
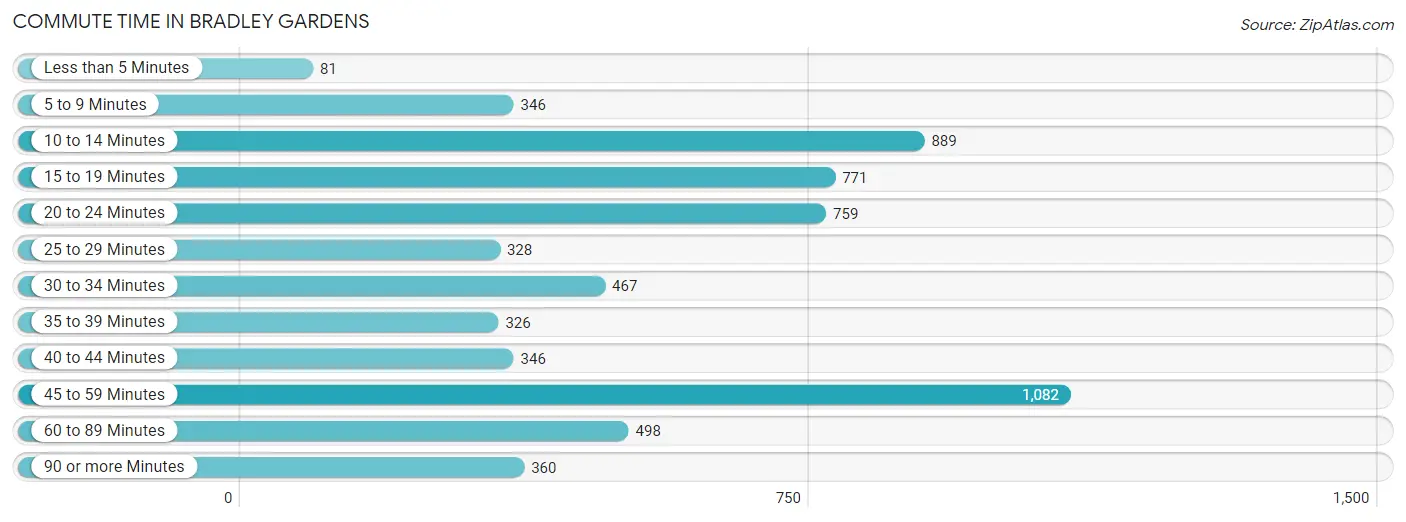
| Commute Time | # Commuters | % Commuters |
| Less than 5 Minutes | 81 | 1.3% |
| 5 to 9 Minutes | 346 | 5.5% |
| 10 to 14 Minutes | 889 | 14.2% |
| 15 to 19 Minutes | 771 | 12.3% |
| 20 to 24 Minutes | 759 | 12.1% |
| 25 to 29 Minutes | 328 | 5.2% |
| 30 to 34 Minutes | 467 | 7.5% |
| 35 to 39 Minutes | 326 | 5.2% |
| 40 to 44 Minutes | 346 | 5.5% |
| 45 to 59 Minutes | 1,082 | 17.3% |
| 60 to 89 Minutes | 498 | 8.0% |
| 90 or more Minutes | 360 | 5.8% |
Commute Time by Sex in Bradley Gardens
The most common commute times in Bradley Gardens are 45 to 59 minutes (563 commuters, 18.2%) for males and 10 to 14 minutes (586 commuters, 18.5%) for females.
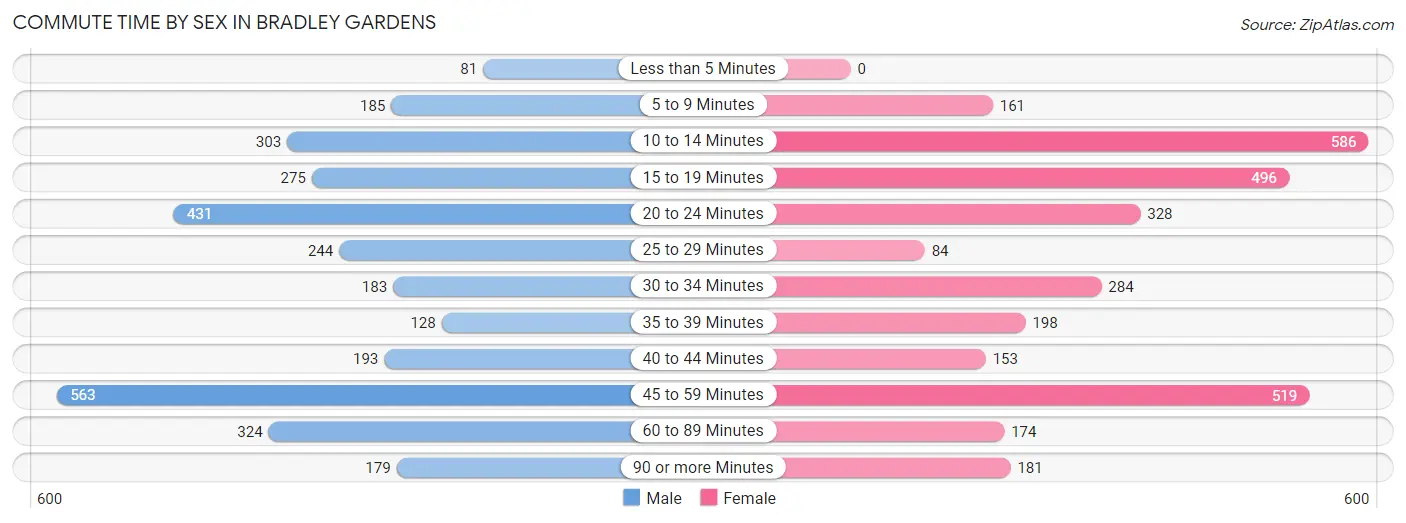
| Commute Time | Male | Female |
| Less than 5 Minutes | 81 (2.6%) | 0 (0.0%) |
| 5 to 9 Minutes | 185 (6.0%) | 161 (5.1%) |
| 10 to 14 Minutes | 303 (9.8%) | 586 (18.5%) |
| 15 to 19 Minutes | 275 (8.9%) | 496 (15.7%) |
| 20 to 24 Minutes | 431 (14.0%) | 328 (10.4%) |
| 25 to 29 Minutes | 244 (7.9%) | 84 (2.6%) |
| 30 to 34 Minutes | 183 (5.9%) | 284 (9.0%) |
| 35 to 39 Minutes | 128 (4.1%) | 198 (6.3%) |
| 40 to 44 Minutes | 193 (6.2%) | 153 (4.8%) |
| 45 to 59 Minutes | 563 (18.2%) | 519 (16.4%) |
| 60 to 89 Minutes | 324 (10.5%) | 174 (5.5%) |
| 90 or more Minutes | 179 (5.8%) | 181 (5.7%) |
Time of Departure to Work by Sex in Bradley Gardens
The most frequent times of departure to work in Bradley Gardens are 7:00 AM to 7:29 AM (630, 20.4%) for males and 7:00 AM to 7:29 AM (532, 16.8%) for females.
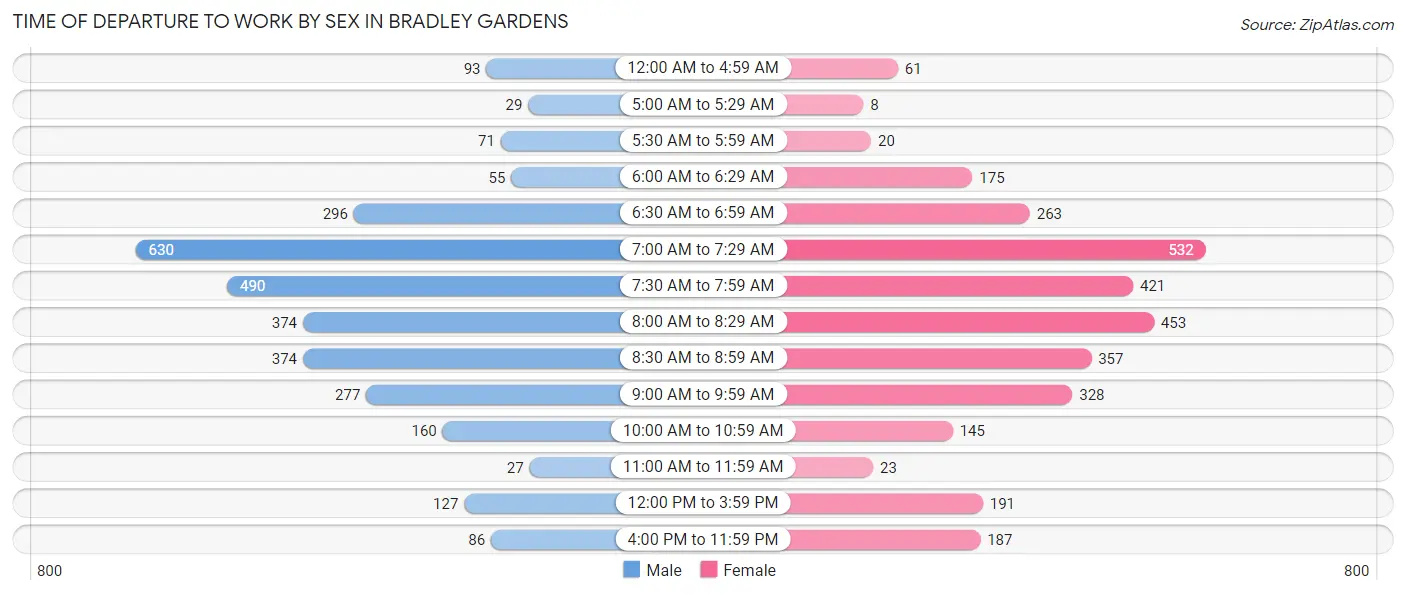
| Time of Departure | Male | Female |
| 12:00 AM to 4:59 AM | 93 (3.0%) | 61 (1.9%) |
| 5:00 AM to 5:29 AM | 29 (0.9%) | 8 (0.3%) |
| 5:30 AM to 5:59 AM | 71 (2.3%) | 20 (0.6%) |
| 6:00 AM to 6:29 AM | 55 (1.8%) | 175 (5.5%) |
| 6:30 AM to 6:59 AM | 296 (9.6%) | 263 (8.3%) |
| 7:00 AM to 7:29 AM | 630 (20.4%) | 532 (16.8%) |
| 7:30 AM to 7:59 AM | 490 (15.9%) | 421 (13.3%) |
| 8:00 AM to 8:29 AM | 374 (12.1%) | 453 (14.3%) |
| 8:30 AM to 8:59 AM | 374 (12.1%) | 357 (11.3%) |
| 9:00 AM to 9:59 AM | 277 (9.0%) | 328 (10.4%) |
| 10:00 AM to 10:59 AM | 160 (5.2%) | 145 (4.6%) |
| 11:00 AM to 11:59 AM | 27 (0.9%) | 23 (0.7%) |
| 12:00 PM to 3:59 PM | 127 (4.1%) | 191 (6.0%) |
| 4:00 PM to 11:59 PM | 86 (2.8%) | 187 (5.9%) |
| Total | 3,089 (100.0%) | 3,164 (100.0%) |
Housing Occupancy in Bradley Gardens
Occupancy by Ownership in Bradley Gardens
Of the total 5,146 dwellings in Bradley Gardens, owner-occupied units account for 4,653 (90.4%), while renter-occupied units make up 493 (9.6%).
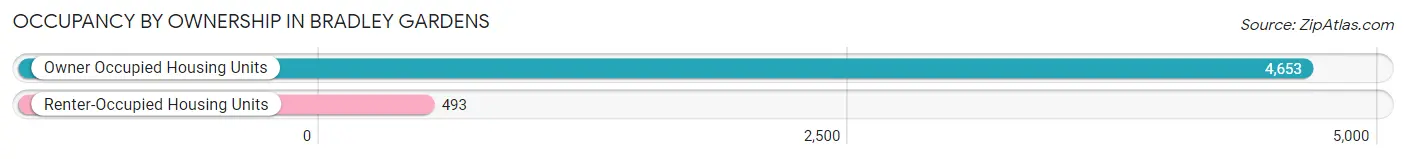
| Occupancy | # Housing Units | % Housing Units |
| Owner Occupied Housing Units | 4,653 | 90.4% |
| Renter-Occupied Housing Units | 493 | 9.6% |
| Total Occupied Housing Units | 5,146 | 100.0% |
Occupancy by Household Size in Bradley Gardens
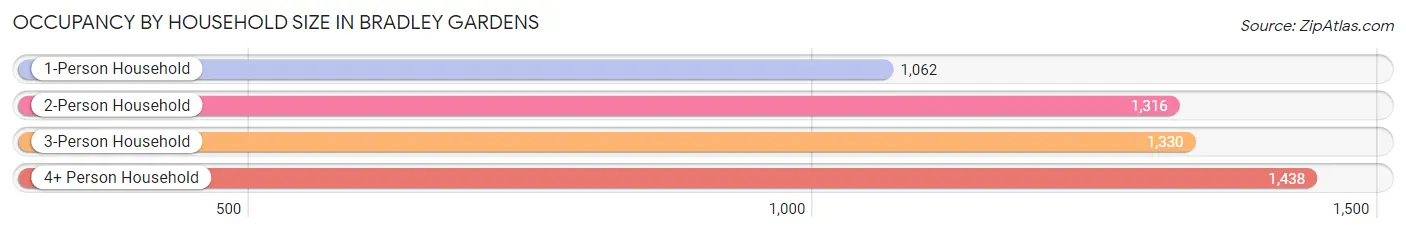
| Household Size | # Housing Units | % Housing Units |
| 1-Person Household | 1,062 | 20.6% |
| 2-Person Household | 1,316 | 25.6% |
| 3-Person Household | 1,330 | 25.9% |
| 4+ Person Household | 1,438 | 27.9% |
| Total Housing Units | 5,146 | 100.0% |
Occupancy by Ownership by Household Size in Bradley Gardens
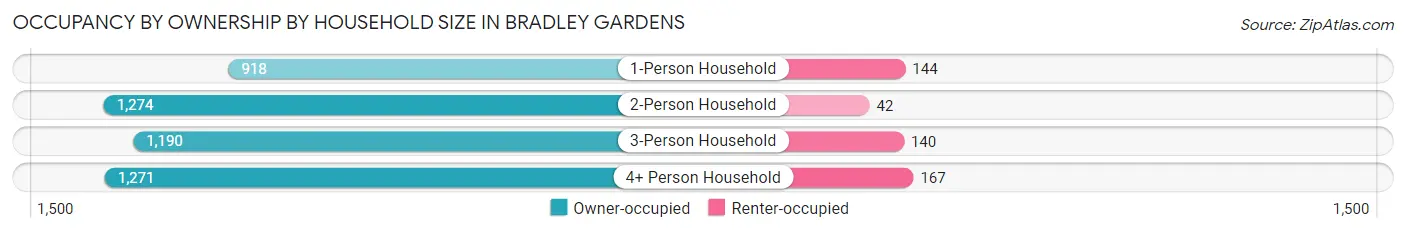
| Household Size | Owner-occupied | Renter-occupied |
| 1-Person Household | 918 (86.4%) | 144 (13.6%) |
| 2-Person Household | 1,274 (96.8%) | 42 (3.2%) |
| 3-Person Household | 1,190 (89.5%) | 140 (10.5%) |
| 4+ Person Household | 1,271 (88.4%) | 167 (11.6%) |
| Total Housing Units | 4,653 (90.4%) | 493 (9.6%) |
Occupancy by Educational Attainment in Bradley Gardens
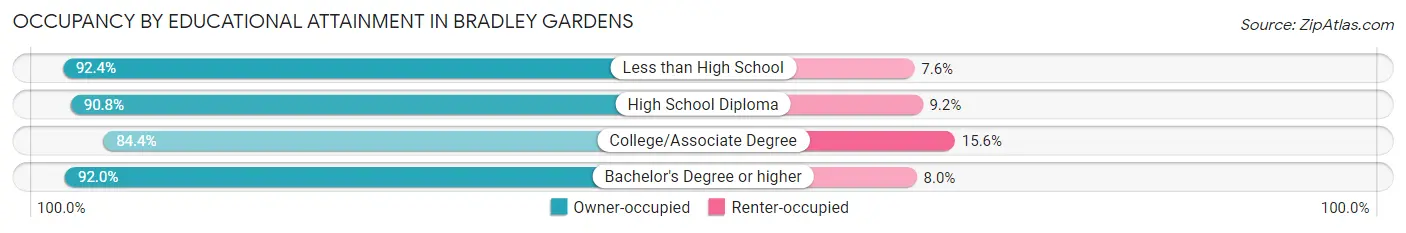
| Household Size | Owner-occupied | Renter-occupied |
| Less than High School | 171 (92.4%) | 14 (7.6%) |
| High School Diploma | 505 (90.8%) | 51 (9.2%) |
| College/Associate Degree | 833 (84.4%) | 154 (15.6%) |
| Bachelor's Degree or higher | 3,144 (92.0%) | 274 (8.0%) |
Occupancy by Age of Householder in Bradley Gardens
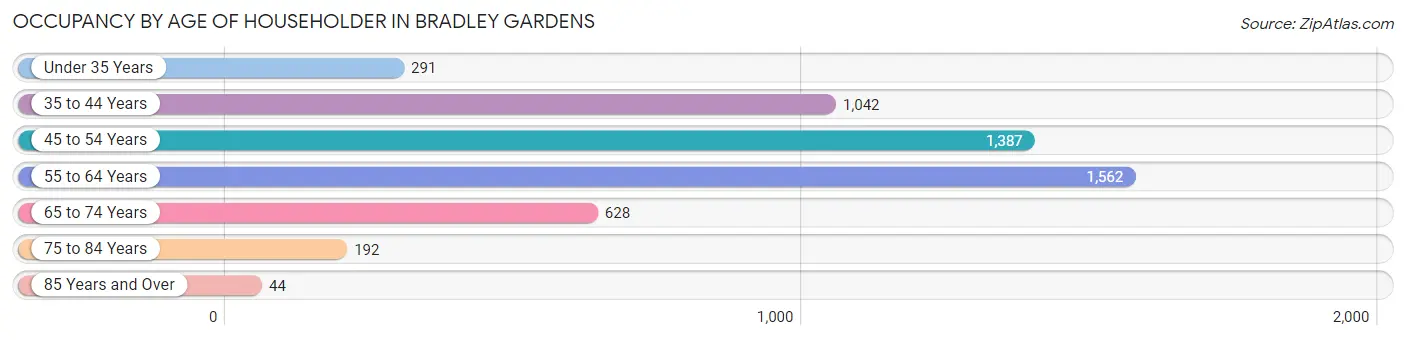
| Age Bracket | # Households | % Households |
| Under 35 Years | 291 | 5.7% |
| 35 to 44 Years | 1,042 | 20.3% |
| 45 to 54 Years | 1,387 | 27.0% |
| 55 to 64 Years | 1,562 | 30.3% |
| 65 to 74 Years | 628 | 12.2% |
| 75 to 84 Years | 192 | 3.7% |
| 85 Years and Over | 44 | 0.9% |
| Total | 5,146 | 100.0% |
Housing Finances in Bradley Gardens
Median Income by Occupancy in Bradley Gardens
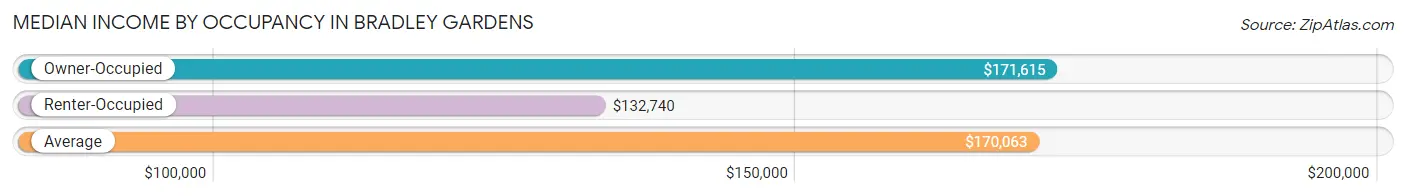
| Occupancy Type | # Households | Median Income |
| Owner-Occupied | 4,653 (90.4%) | $171,615 |
| Renter-Occupied | 493 (9.6%) | $132,740 |
| Average | 5,146 (100.0%) | $170,063 |
Occupancy by Householder Income Bracket in Bradley Gardens
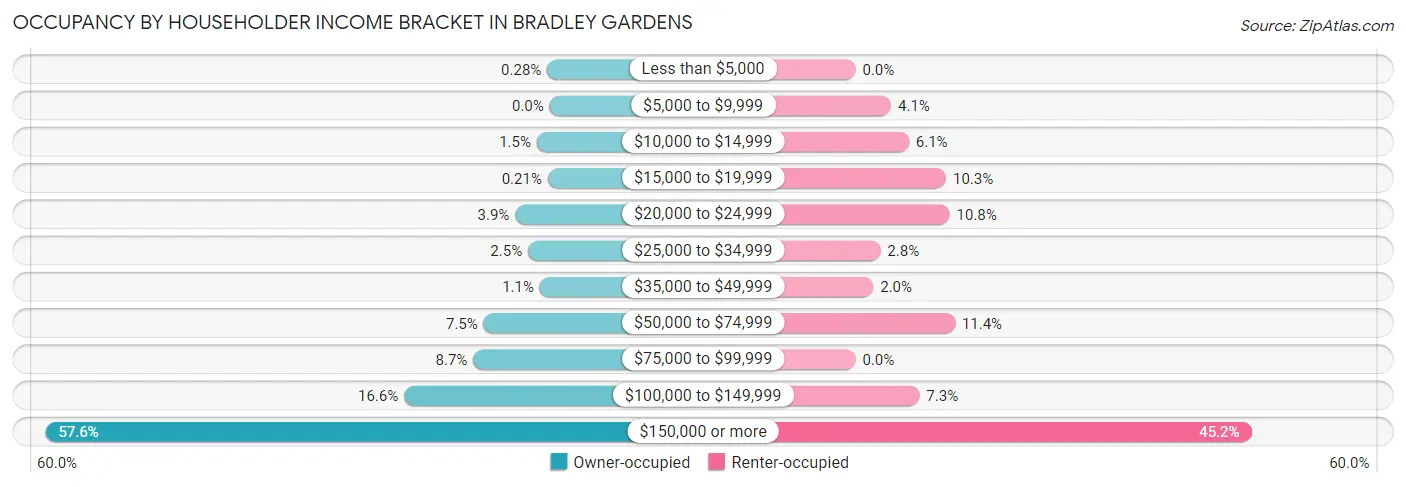
| Income Bracket | Owner-occupied | Renter-occupied |
| Less than $5,000 | 13 (0.3%) | 0 (0.0%) |
| $5,000 to $9,999 | 0 (0.0%) | 20 (4.1%) |
| $10,000 to $14,999 | 68 (1.5%) | 30 (6.1%) |
| $15,000 to $19,999 | 10 (0.2%) | 51 (10.3%) |
| $20,000 to $24,999 | 183 (3.9%) | 53 (10.7%) |
| $25,000 to $34,999 | 115 (2.5%) | 14 (2.8%) |
| $35,000 to $49,999 | 52 (1.1%) | 10 (2.0%) |
| $50,000 to $74,999 | 351 (7.5%) | 56 (11.4%) |
| $75,000 to $99,999 | 406 (8.7%) | 0 (0.0%) |
| $100,000 to $149,999 | 774 (16.6%) | 36 (7.3%) |
| $150,000 or more | 2,681 (57.6%) | 223 (45.2%) |
| Total | 4,653 (100.0%) | 493 (100.0%) |
Monthly Housing Cost Tiers in Bradley Gardens
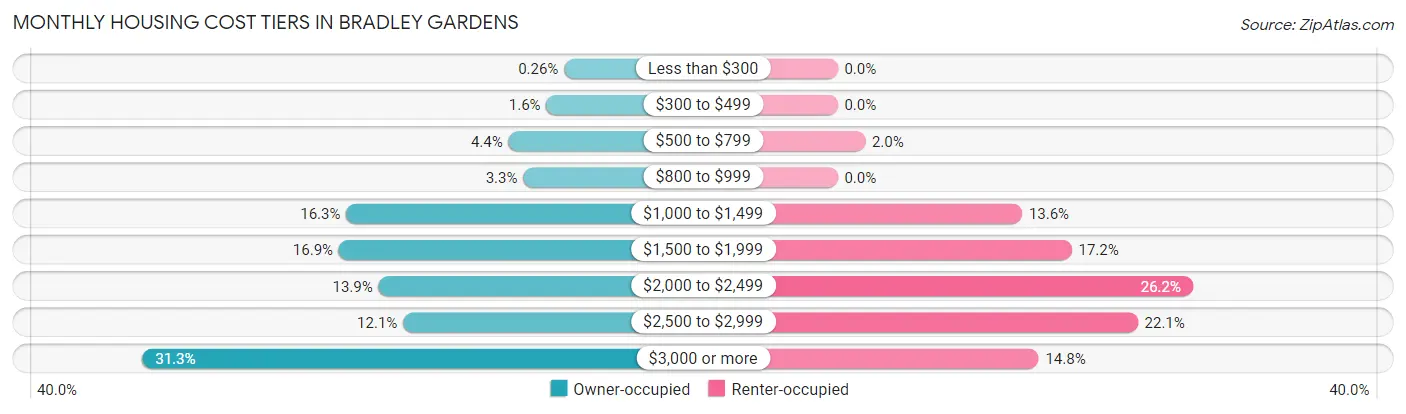
| Monthly Cost | Owner-occupied | Renter-occupied |
| Less than $300 | 12 (0.3%) | 0 (0.0%) |
| $300 to $499 | 73 (1.6%) | 0 (0.0%) |
| $500 to $799 | 203 (4.4%) | 10 (2.0%) |
| $800 to $999 | 152 (3.3%) | 0 (0.0%) |
| $1,000 to $1,499 | 759 (16.3%) | 67 (13.6%) |
| $1,500 to $1,999 | 784 (16.9%) | 85 (17.2%) |
| $2,000 to $2,499 | 648 (13.9%) | 129 (26.2%) |
| $2,500 to $2,999 | 564 (12.1%) | 109 (22.1%) |
| $3,000 or more | 1,458 (31.3%) | 73 (14.8%) |
| Total | 4,653 (100.0%) | 493 (100.0%) |
Physical Housing Characteristics in Bradley Gardens
Housing Structures in Bradley Gardens
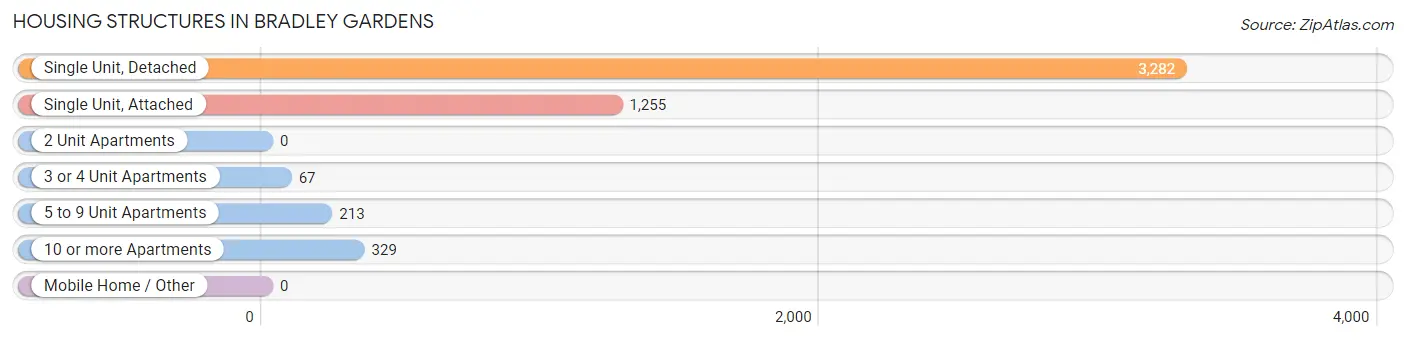
| Structure Type | # Housing Units | % Housing Units |
| Single Unit, Detached | 3,282 | 63.8% |
| Single Unit, Attached | 1,255 | 24.4% |
| 2 Unit Apartments | 0 | 0.0% |
| 3 or 4 Unit Apartments | 67 | 1.3% |
| 5 to 9 Unit Apartments | 213 | 4.1% |
| 10 or more Apartments | 329 | 6.4% |
| Mobile Home / Other | 0 | 0.0% |
| Total | 5,146 | 100.0% |
Housing Structures by Occupancy in Bradley Gardens
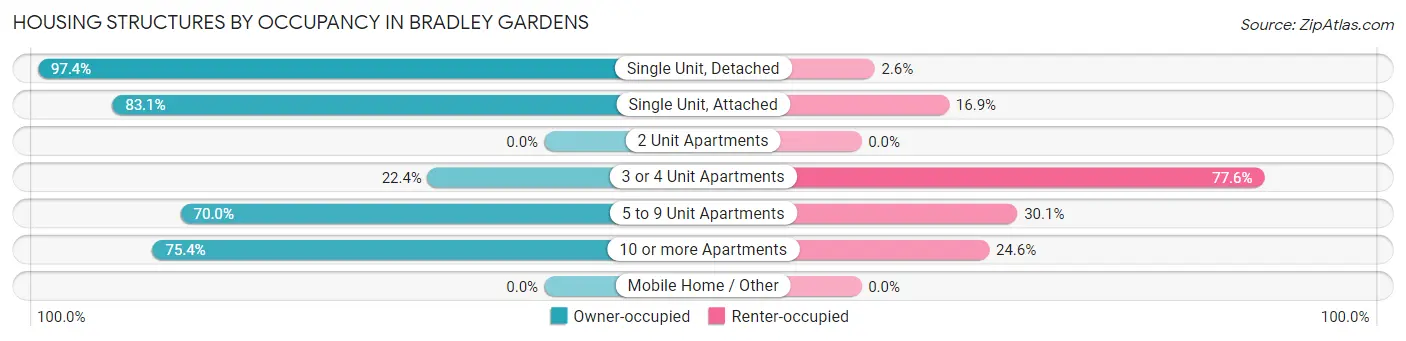
| Structure Type | Owner-occupied | Renter-occupied |
| Single Unit, Detached | 3,198 (97.4%) | 84 (2.6%) |
| Single Unit, Attached | 1,043 (83.1%) | 212 (16.9%) |
| 2 Unit Apartments | 0 (0.0%) | 0 (0.0%) |
| 3 or 4 Unit Apartments | 15 (22.4%) | 52 (77.6%) |
| 5 to 9 Unit Apartments | 149 (70.0%) | 64 (30.0%) |
| 10 or more Apartments | 248 (75.4%) | 81 (24.6%) |
| Mobile Home / Other | 0 (0.0%) | 0 (0.0%) |
| Total | 4,653 (90.4%) | 493 (9.6%) |
Housing Structures by Number of Rooms in Bradley Gardens
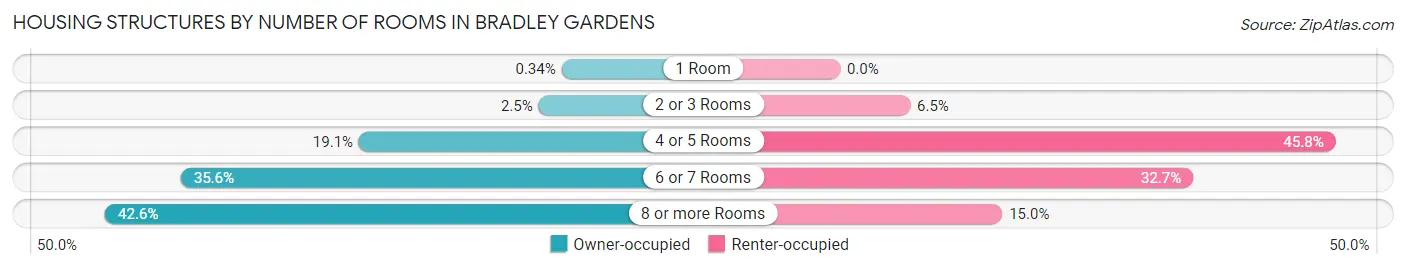
| Number of Rooms | Owner-occupied | Renter-occupied |
| 1 Room | 16 (0.3%) | 0 (0.0%) |
| 2 or 3 Rooms | 115 (2.5%) | 32 (6.5%) |
| 4 or 5 Rooms | 888 (19.1%) | 226 (45.8%) |
| 6 or 7 Rooms | 1,654 (35.5%) | 161 (32.7%) |
| 8 or more Rooms | 1,980 (42.5%) | 74 (15.0%) |
| Total | 4,653 (100.0%) | 493 (100.0%) |
Housing Structure by Heating Type in Bradley Gardens
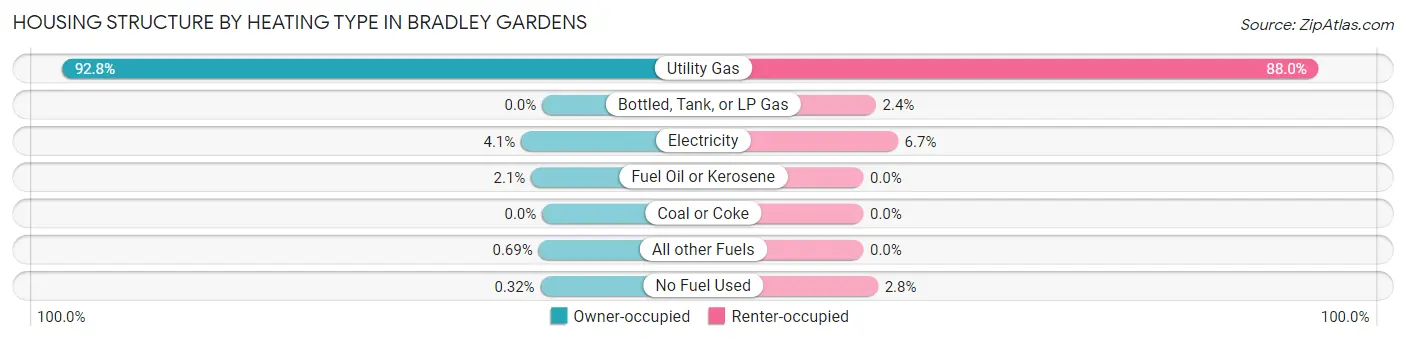
| Heating Type | Owner-occupied | Renter-occupied |
| Utility Gas | 4,319 (92.8%) | 434 (88.0%) |
| Bottled, Tank, or LP Gas | 0 (0.0%) | 12 (2.4%) |
| Electricity | 189 (4.1%) | 33 (6.7%) |
| Fuel Oil or Kerosene | 98 (2.1%) | 0 (0.0%) |
| Coal or Coke | 0 (0.0%) | 0 (0.0%) |
| All other Fuels | 32 (0.7%) | 0 (0.0%) |
| No Fuel Used | 15 (0.3%) | 14 (2.8%) |
| Total | 4,653 (100.0%) | 493 (100.0%) |
Household Vehicle Usage in Bradley Gardens
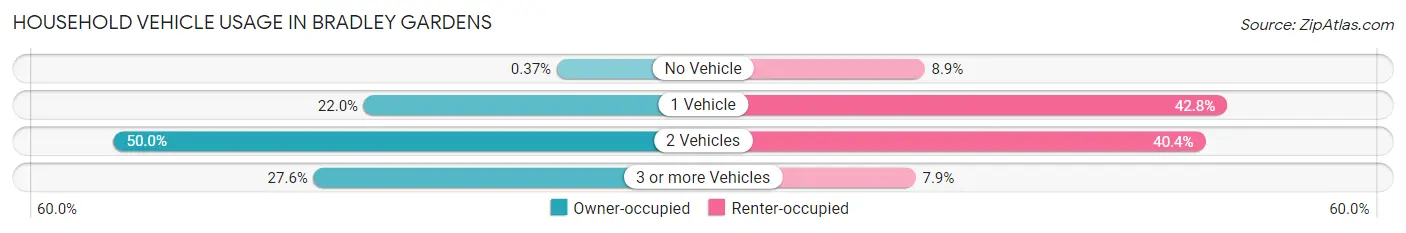
| Vehicles per Household | Owner-occupied | Renter-occupied |
| No Vehicle | 17 (0.4%) | 44 (8.9%) |
| 1 Vehicle | 1,023 (22.0%) | 211 (42.8%) |
| 2 Vehicles | 2,328 (50.0%) | 199 (40.4%) |
| 3 or more Vehicles | 1,285 (27.6%) | 39 (7.9%) |
| Total | 4,653 (100.0%) | 493 (100.0%) |
Real Estate & Mortgages in Bradley Gardens
Real Estate and Mortgage Overview in Bradley Gardens
| Characteristic | Without Mortgage | With Mortgage |
| Housing Units | 1,660 | 2,993 |
| Median Property Value | $518,700 | $505,300 |
| Median Household Income | $138,765 | $1,964 |
| Monthly Housing Costs | $1,315 | $1,458 |
| Real Estate Taxes | $9,844 | $22 |
Property Value by Mortgage Status in Bradley Gardens
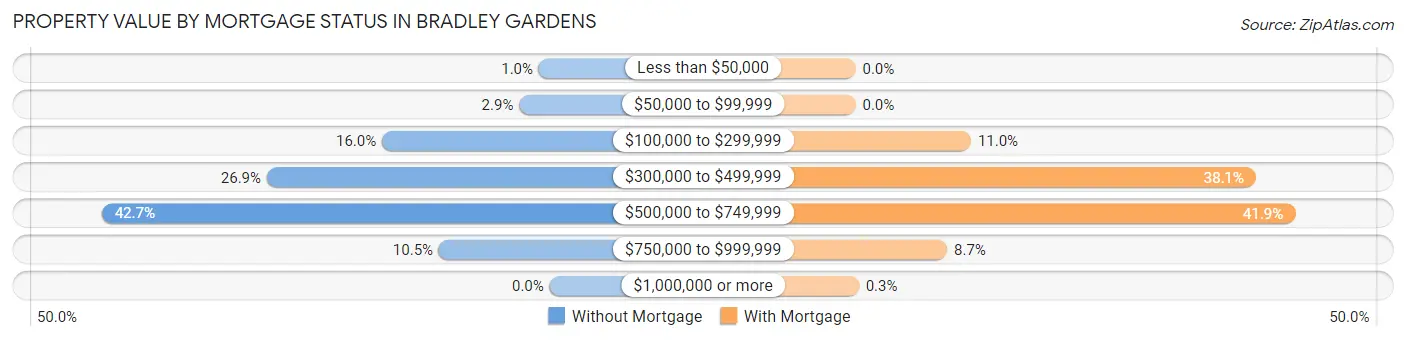
| Property Value | Without Mortgage | With Mortgage |
| Less than $50,000 | 17 (1.0%) | 0 (0.0%) |
| $50,000 to $99,999 | 48 (2.9%) | 0 (0.0%) |
| $100,000 to $299,999 | 265 (16.0%) | 329 (11.0%) |
| $300,000 to $499,999 | 447 (26.9%) | 1,141 (38.1%) |
| $500,000 to $749,999 | 708 (42.6%) | 1,253 (41.9%) |
| $750,000 to $999,999 | 175 (10.5%) | 261 (8.7%) |
| $1,000,000 or more | 0 (0.0%) | 9 (0.3%) |
| Total | 1,660 (100.0%) | 2,993 (100.0%) |
Household Income by Mortgage Status in Bradley Gardens
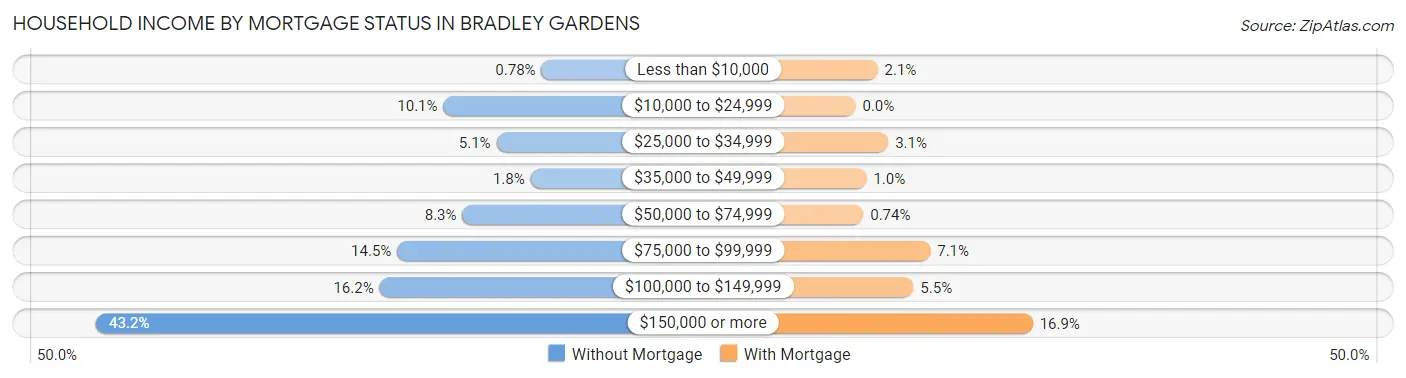
| Household Income | Without Mortgage | With Mortgage |
| Less than $10,000 | 13 (0.8%) | 63 (2.1%) |
| $10,000 to $24,999 | 168 (10.1%) | 0 (0.0%) |
| $25,000 to $34,999 | 84 (5.1%) | 93 (3.1%) |
| $35,000 to $49,999 | 30 (1.8%) | 31 (1.0%) |
| $50,000 to $74,999 | 138 (8.3%) | 22 (0.7%) |
| $75,000 to $99,999 | 241 (14.5%) | 213 (7.1%) |
| $100,000 to $149,999 | 269 (16.2%) | 165 (5.5%) |
| $150,000 or more | 717 (43.2%) | 505 (16.9%) |
| Total | 1,660 (100.0%) | 2,993 (100.0%) |
Property Value to Household Income Ratio in Bradley Gardens
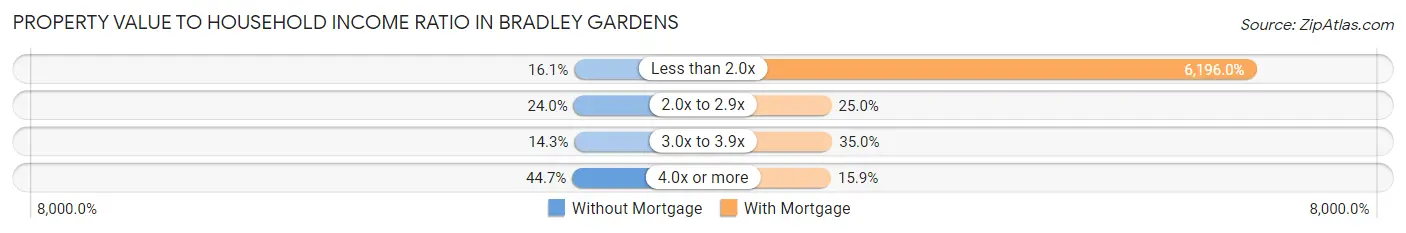
| Value-to-Income Ratio | Without Mortgage | With Mortgage |
| Less than 2.0x | 268 (16.1%) | 185,445 (6,196.0%) |
| 2.0x to 2.9x | 399 (24.0%) | 748 (25.0%) |
| 3.0x to 3.9x | 238 (14.3%) | 1,046 (34.9%) |
| 4.0x or more | 742 (44.7%) | 476 (15.9%) |
| Total | 1,660 (100.0%) | 2,993 (100.0%) |
Real Estate Taxes by Mortgage Status in Bradley Gardens
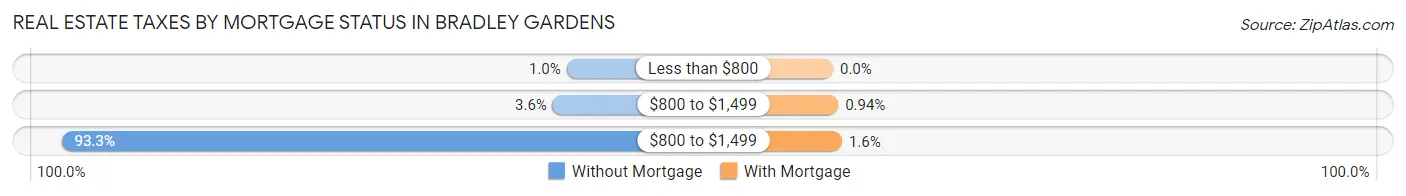
| Property Taxes | Without Mortgage | With Mortgage |
| Less than $800 | 17 (1.0%) | 0 (0.0%) |
| $800 to $1,499 | 59 (3.5%) | 28 (0.9%) |
| $800 to $1,499 | 1,548 (93.2%) | 49 (1.6%) |
| Total | 1,660 (100.0%) | 2,993 (100.0%) |
Health & Disability in Bradley Gardens
Health Insurance Coverage by Age in Bradley Gardens
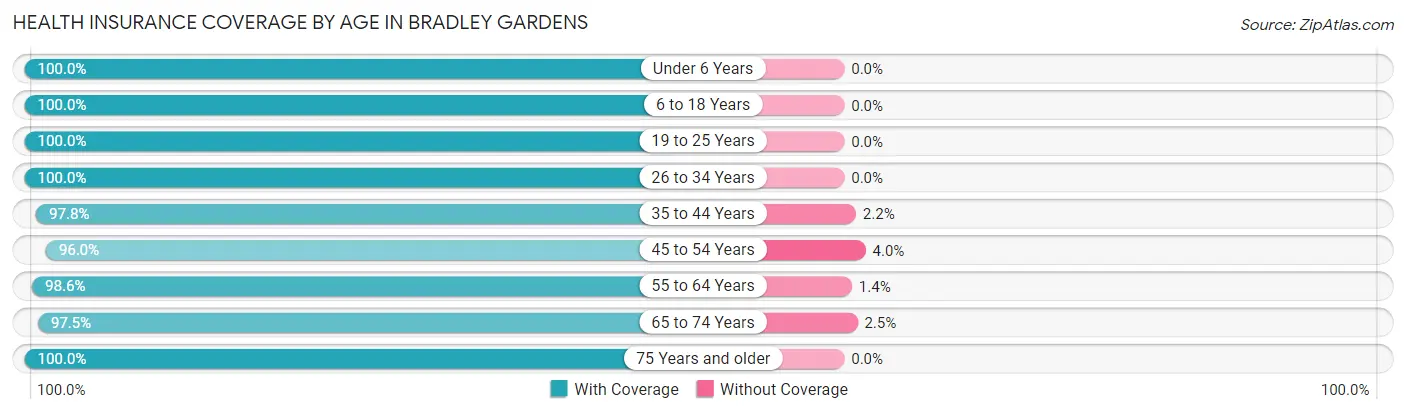
| Age Bracket | With Coverage | Without Coverage |
| Under 6 Years | 696 (100.0%) | 0 (0.0%) |
| 6 to 18 Years | 2,735 (100.0%) | 0 (0.0%) |
| 19 to 25 Years | 1,110 (100.0%) | 0 (0.0%) |
| 26 to 34 Years | 960 (100.0%) | 0 (0.0%) |
| 35 to 44 Years | 2,040 (97.8%) | 45 (2.2%) |
| 45 to 54 Years | 2,543 (96.0%) | 105 (4.0%) |
| 55 to 64 Years | 2,221 (98.6%) | 32 (1.4%) |
| 65 to 74 Years | 993 (97.5%) | 25 (2.5%) |
| 75 Years and older | 700 (100.0%) | 0 (0.0%) |
| Total | 13,998 (98.5%) | 207 (1.5%) |
Health Insurance Coverage by Citizenship Status in Bradley Gardens
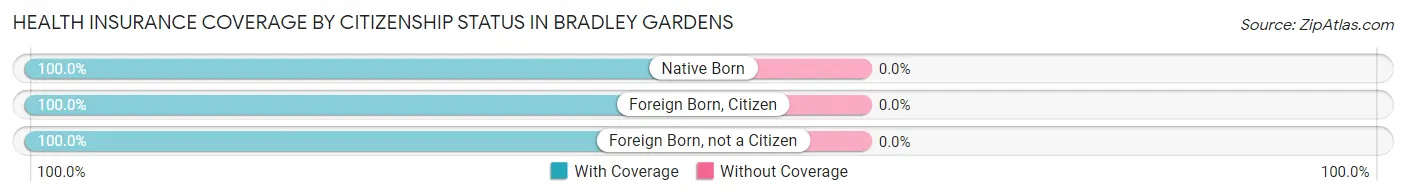
| Citizenship Status | With Coverage | Without Coverage |
| Native Born | 696 (100.0%) | 0 (0.0%) |
| Foreign Born, Citizen | 2,735 (100.0%) | 0 (0.0%) |
| Foreign Born, not a Citizen | 1,110 (100.0%) | 0 (0.0%) |
Health Insurance Coverage by Household Income in Bradley Gardens
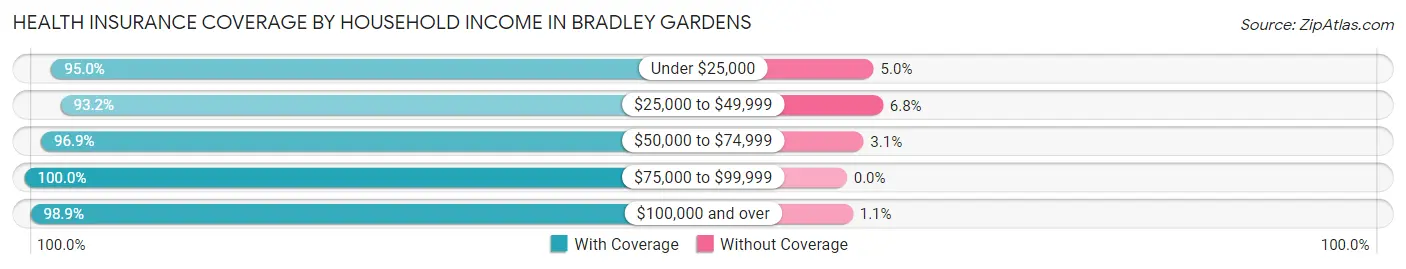
| Household Income | With Coverage | Without Coverage |
| Under $25,000 | 623 (95.0%) | 33 (5.0%) |
| $25,000 to $49,999 | 276 (93.2%) | 20 (6.8%) |
| $50,000 to $74,999 | 779 (96.9%) | 25 (3.1%) |
| $75,000 to $99,999 | 942 (100.0%) | 0 (0.0%) |
| $100,000 and over | 11,372 (98.9%) | 129 (1.1%) |
Public vs Private Health Insurance Coverage by Age in Bradley Gardens
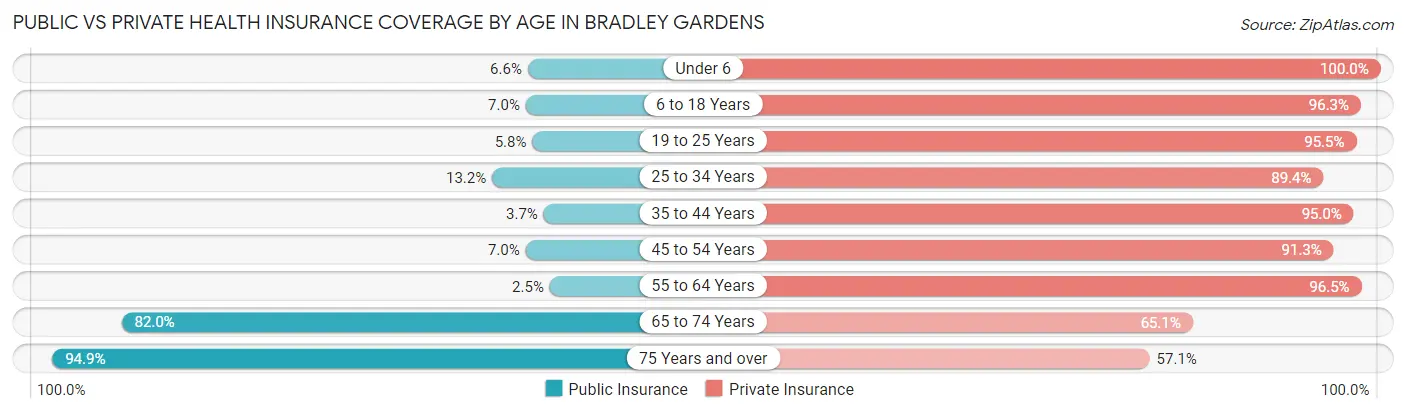
| Age Bracket | Public Insurance | Private Insurance |
| Under 6 | 46 (6.6%) | 696 (100.0%) |
| 6 to 18 Years | 191 (7.0%) | 2,635 (96.3%) |
| 19 to 25 Years | 64 (5.8%) | 1,060 (95.5%) |
| 25 to 34 Years | 127 (13.2%) | 858 (89.4%) |
| 35 to 44 Years | 76 (3.6%) | 1,981 (95.0%) |
| 45 to 54 Years | 186 (7.0%) | 2,417 (91.3%) |
| 55 to 64 Years | 57 (2.5%) | 2,173 (96.5%) |
| 65 to 74 Years | 835 (82.0%) | 663 (65.1%) |
| 75 Years and over | 664 (94.9%) | 400 (57.1%) |
| Total | 2,246 (15.8%) | 12,883 (90.7%) |
Disability Status by Sex by Age in Bradley Gardens
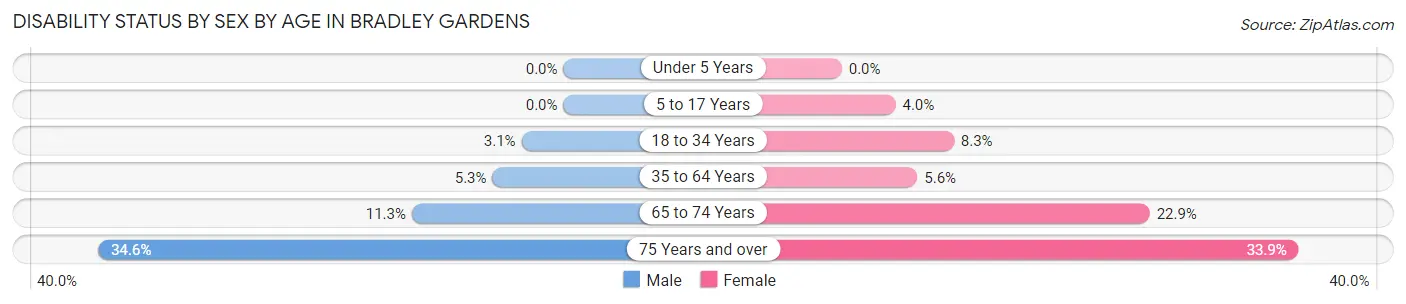
| Age Bracket | Male | Female |
| Under 5 Years | 0 (0.0%) | 0 (0.0%) |
| 5 to 17 Years | 0 (0.0%) | 54 (4.0%) |
| 18 to 34 Years | 33 (3.1%) | 101 (8.3%) |
| 35 to 64 Years | 188 (5.3%) | 192 (5.6%) |
| 65 to 74 Years | 54 (11.3%) | 123 (22.9%) |
| 75 Years and over | 85 (34.5%) | 154 (33.9%) |
Disability Class by Sex by Age in Bradley Gardens
Disability Class: Hearing Difficulty
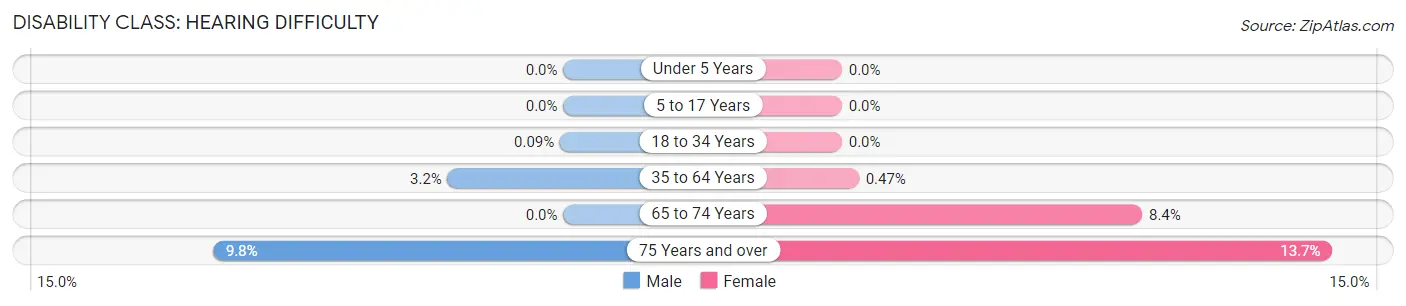
| Age Bracket | Male | Female |
| Under 5 Years | 0 (0.0%) | 0 (0.0%) |
| 5 to 17 Years | 0 (0.0%) | 0 (0.0%) |
| 18 to 34 Years | 1 (0.1%) | 0 (0.0%) |
| 35 to 64 Years | 115 (3.2%) | 16 (0.5%) |
| 65 to 74 Years | 0 (0.0%) | 45 (8.4%) |
| 75 Years and over | 24 (9.8%) | 62 (13.7%) |
Disability Class: Vision Difficulty

| Age Bracket | Male | Female |
| Under 5 Years | 0 (0.0%) | 0 (0.0%) |
| 5 to 17 Years | 0 (0.0%) | 14 (1.0%) |
| 18 to 34 Years | 0 (0.0%) | 0 (0.0%) |
| 35 to 64 Years | 19 (0.5%) | 15 (0.4%) |
| 65 to 74 Years | 11 (2.3%) | 41 (7.6%) |
| 75 Years and over | 24 (9.8%) | 13 (2.9%) |
Disability Class: Cognitive Difficulty
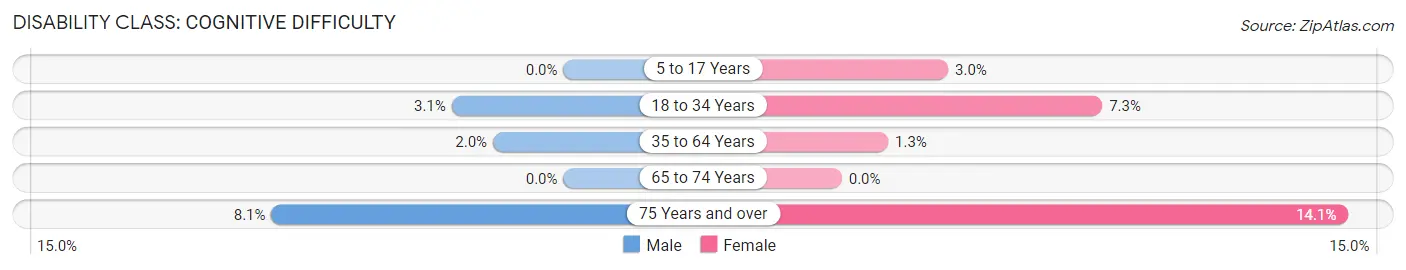
| Age Bracket | Male | Female |
| 5 to 17 Years | 0 (0.0%) | 40 (3.0%) |
| 18 to 34 Years | 33 (3.1%) | 88 (7.2%) |
| 35 to 64 Years | 70 (2.0%) | 44 (1.3%) |
| 65 to 74 Years | 0 (0.0%) | 0 (0.0%) |
| 75 Years and over | 20 (8.1%) | 64 (14.1%) |
Disability Class: Ambulatory Difficulty
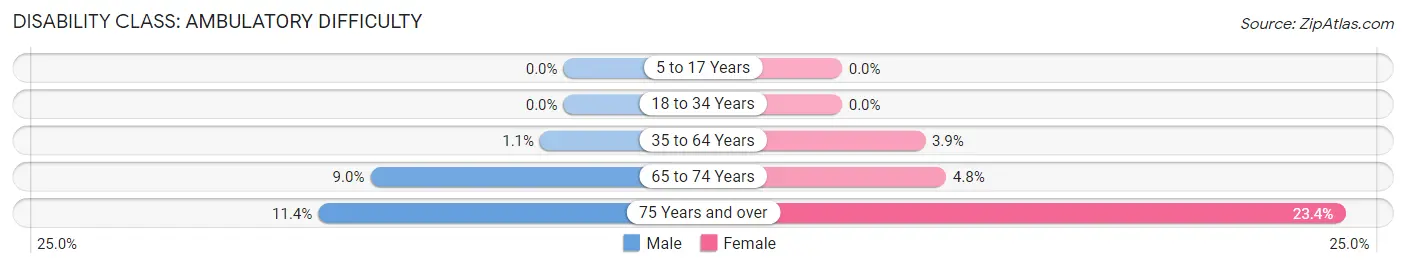
| Age Bracket | Male | Female |
| 5 to 17 Years | 0 (0.0%) | 0 (0.0%) |
| 18 to 34 Years | 0 (0.0%) | 0 (0.0%) |
| 35 to 64 Years | 39 (1.1%) | 132 (3.9%) |
| 65 to 74 Years | 43 (9.0%) | 26 (4.8%) |
| 75 Years and over | 28 (11.4%) | 106 (23.4%) |
Disability Class: Self-Care Difficulty
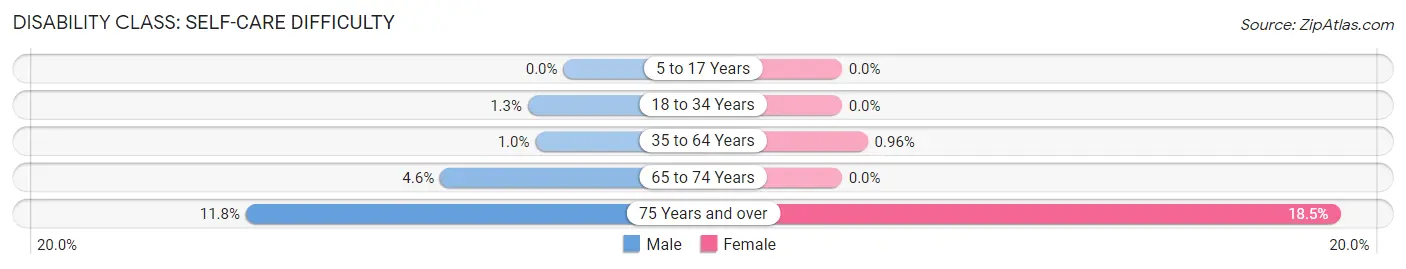
| Age Bracket | Male | Female |
| 5 to 17 Years | 0 (0.0%) | 0 (0.0%) |
| 18 to 34 Years | 14 (1.3%) | 0 (0.0%) |
| 35 to 64 Years | 37 (1.0%) | 33 (1.0%) |
| 65 to 74 Years | 22 (4.6%) | 0 (0.0%) |
| 75 Years and over | 29 (11.8%) | 84 (18.5%) |
Technology Access in Bradley Gardens
Computing Device Access in Bradley Gardens
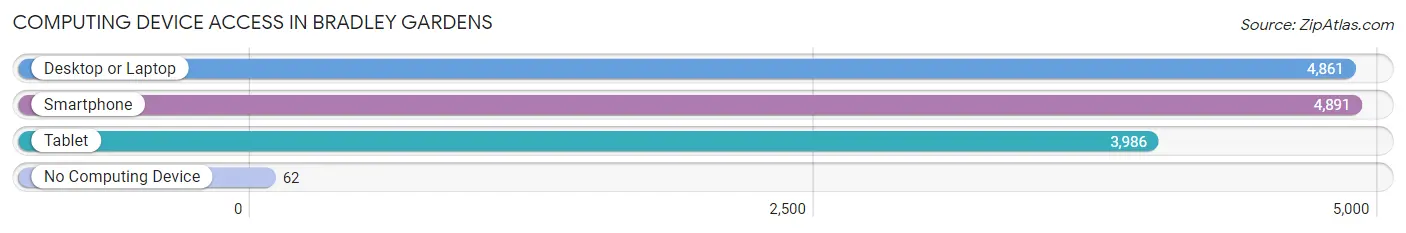
| Device Type | # Households | % Households |
| Desktop or Laptop | 4,861 | 94.5% |
| Smartphone | 4,891 | 95.0% |
| Tablet | 3,986 | 77.5% |
| No Computing Device | 62 | 1.2% |
| Total | 5,146 | 100.0% |
Internet Access in Bradley Gardens
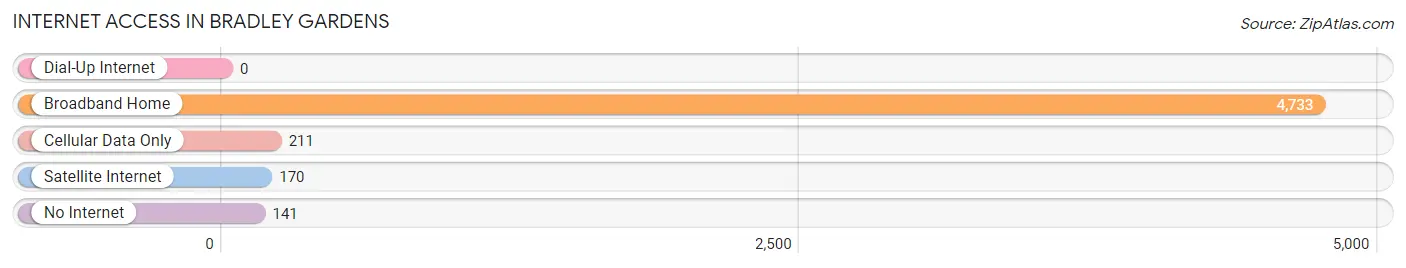
| Internet Type | # Households | % Households |
| Dial-Up Internet | 0 | 0.0% |
| Broadband Home | 4,733 | 92.0% |
| Cellular Data Only | 211 | 4.1% |
| Satellite Internet | 170 | 3.3% |
| No Internet | 141 | 2.7% |
| Total | 5,146 | 100.0% |
Bradley Gardens Summary
Bradley Gardens is a census-designated place (CDP) located in Somerset County, New Jersey, United States. As of the 2010 United States Census, the CDP's population was 5,845.
History
The area now known as Bradley Gardens was originally inhabited by the Lenape Native Americans. The first European settlers arrived in the area in the late 17th century. The area was originally part of Franklin Township, which was established in 1798. In 1845, the area was split off from Franklin Township and became part of Bridgewater Township. In 1891, the area was split off from Bridgewater Township and became part of the newly formed Bernards Township.
In the early 20th century, the area was known as Bradley Park. The name was changed to Bradley Gardens in the 1950s.
Geography
Bradley Gardens is located at 40 35 17 North 74 32 45 West 40 588 74 546
According to the United States Census Bureau, the CDP has a total area of 2.2 square miles (5.7 km2), all of which is land.
Demographics
As of the 2010 United States Census, there were 5,845 people, 2,093 households, and 1,619 families residing in the CDP. The population density was 2,637.5 per square mile (1,017.2/km2). There were 2,183 housing units at an average density of 990.9 per square mile (382.3/km2). The racial makeup of the CDP was 81.2% White, 4.2% African American, 0.2% Native American, 11.2% Asian, 0.0% Pacific Islander, 1.3% from other races, and 2.1% from two or more races. Hispanic or Latino of any race were 6.7% of the population.
There were 2,093 households, out of which 37.2% had children under the age of 18 living with them, 63.2% were married couples living together, 8.7% had a female householder with no husband present, and 24.2% were non-families. 19.7% of all households were made up of individuals, and 8.2% had someone living alone who was 65 years of age or older. The average household size was 2.79 and the average family size was 3.25.
In the CDP, the population was spread out, with 25.7% under the age of 18, 6.2% from 18 to 24, 28.2% from 25 to 44, 28.2% from 45 to 64, and 11.7% who were 65 years of age or older. The median age was 39.2 years. For every 100 females, there were 94.2 males. For every 100 females ages 18 and older there were 91.2 males.
The median income for a household in the CDP was $97,917, and the median income for a family was $106,917. Males had a median income of $76,250 versus $50,000 for females. The per capita income for the CDP was $41,945. About 1.2% of families and 1.7% of the population were below the poverty line, including 0.9% of those under age 18 and 0.0% of those age 65 or over.
Economy
Bradley Gardens is home to a variety of businesses, including retail stores, restaurants, and professional services. The area is also home to several corporate offices, including those of AT&T, Verizon, and Johnson & Johnson.
The area is served by the Bridgewater-Raritan Regional School District, which serves students from kindergarten through twelfth grade. The district has seven elementary schools, two middle schools, and one high school.
The area is also served by the Somerset County Library System, which has a branch located in Bradley Gardens. The library offers a variety of services, including books, magazines, DVDs, and computer access.
Conclusion
Bradley Gardens is a census-designated place located in Somerset County, New Jersey. The area was originally inhabited by the Lenape Native Americans and was later settled by European settlers in the late 17th century. The area was originally part of Franklin Township, which was established in 1798, and later became part of Bridgewater Township and then Bernards Township. The area is now known as Bradley Gardens and has a population of 5,845 as of the 2010 United States Census. The area is home to a variety of businesses, including retail stores, restaurants, and professional services. The area is served by the Bridgewater-Raritan Regional School District and the Somerset County Library System.
Common Questions
What is Per Capita Income in Bradley Gardens?
Per Capita income in Bradley Gardens is $65,287.
What is the Median Family Income in Bradley Gardens?
Median Family Income in Bradley Gardens is $190,000.
What is the Median Household income in Bradley Gardens?
Median Household Income in Bradley Gardens is $170,063.
What is Income or Wage Gap in Bradley Gardens?
Income or Wage Gap in Bradley Gardens is 49.2%.
Women in Bradley Gardens earn 50.8 cents for every dollar earned by a man.
What is Inequality or Gini Index in Bradley Gardens?
Inequality or Gini Index in Bradley Gardens is 0.36.
What is the Total Population of Bradley Gardens?
Total Population of Bradley Gardens is 14,345.
What is the Total Male Population of Bradley Gardens?
Total Male Population of Bradley Gardens is 6,849.
What is the Total Female Population of Bradley Gardens?
Total Female Population of Bradley Gardens is 7,496.
What is the Ratio of Males per 100 Females in Bradley Gardens?
There are 91.37 Males per 100 Females in Bradley Gardens.
What is the Ratio of Females per 100 Males in Bradley Gardens?
There are 109.45 Females per 100 Males in Bradley Gardens.
What is the Median Population Age in Bradley Gardens?
Median Population Age in Bradley Gardens is 42.6 Years.
What is the Average Family Size in Bradley Gardens
Average Family Size in Bradley Gardens is 3.2 People.
What is the Average Household Size in Bradley Gardens
Average Household Size in Bradley Gardens is 2.8 People.
How Large is the Labor Force in Bradley Gardens?
There are 8,348 People in the Labor Forcein in Bradley Gardens.
What is the Percentage of People in the Labor Force in Bradley Gardens?
71.5% of People are in the Labor Force in Bradley Gardens.
What is the Unemployment Rate in Bradley Gardens?
Unemployment Rate in Bradley Gardens is 3.1%.