Cities with the Highest Percentage of Immigrants from Eastern Europe in New Jersey
RELATED REPORTS & OPTIONS
Eastern Europe
New Jersey
Compare Cities
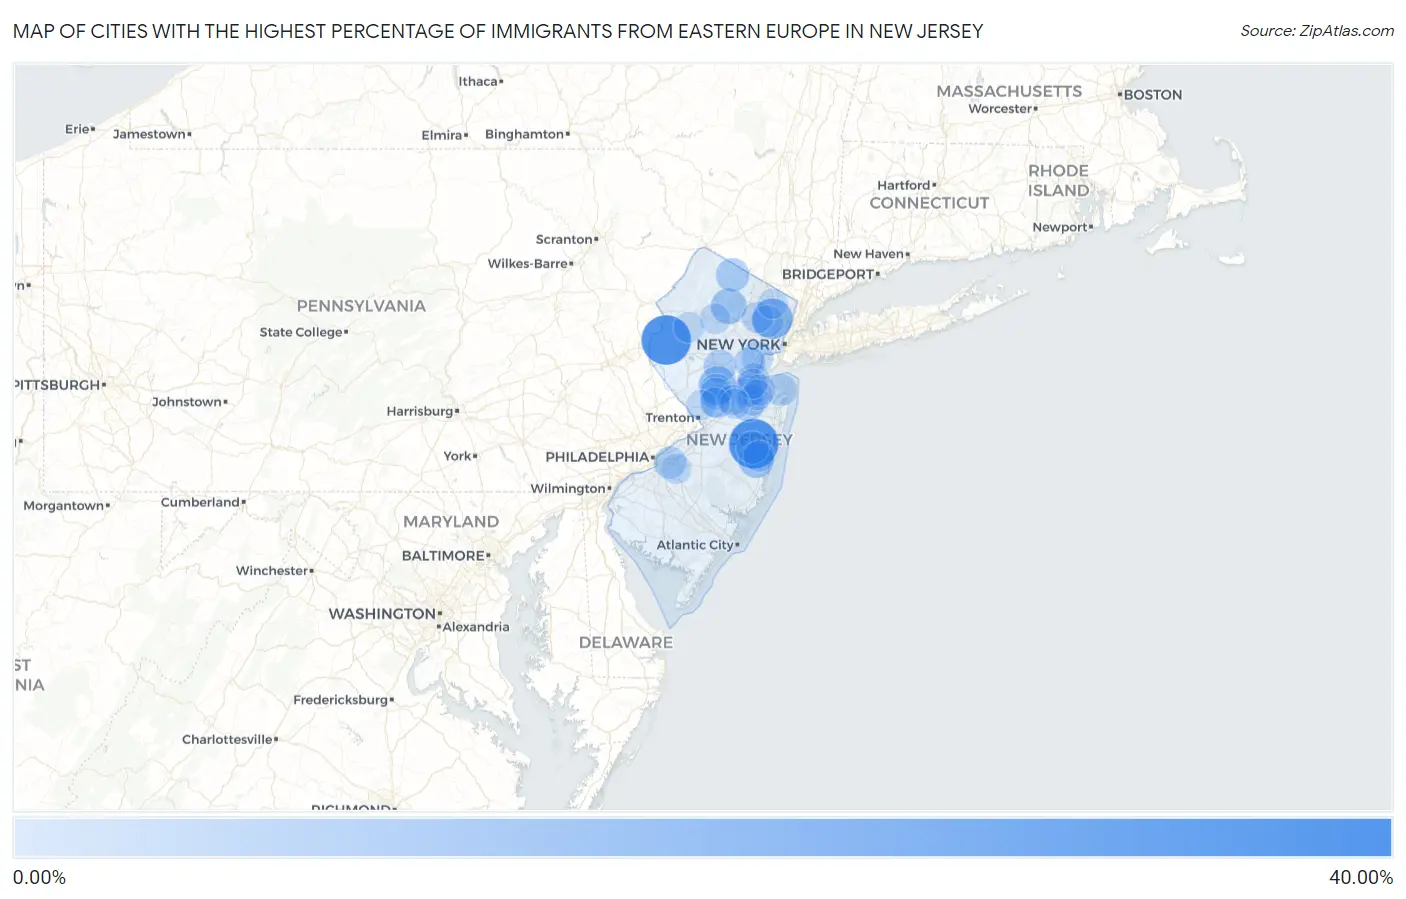
Map of Cities with the Highest Percentage of Immigrants from Eastern Europe in New Jersey
0.00%
40.00%
Cities with the Highest Percentage of Immigrants from Eastern Europe in New Jersey
| City | Eastern Europe | vs State | vs National | |
| 1. | Wallington Borough | 32.78% | 1.57%(+31.2)#1 | 0.67%(+32.1)#5 |
| 2. | Broadway | 32.43% | 1.57%(+30.9)#2 | 0.67%(+31.8)#6 |
| 3. | Cedar Glen West | 32.16% | 1.57%(+30.6)#3 | 0.67%(+31.5)#7 |
| 4. | Lebanon Borough | 20.33% | 1.57%(+18.8)#4 | 0.67%(+19.7)#18 |
| 5. | Garfield | 18.18% | 1.57%(+16.6)#5 | 0.67%(+17.5)#22 |
| 6. | Griggstown | 13.61% | 1.57%(+12.0)#6 | 0.67%(+12.9)#41 |
| 7. | Fair Lawn Borough | 11.73% | 1.57%(+10.2)#7 | 0.67%(+11.1)#57 |
| 8. | Holiday Heights | 11.13% | 1.57%(+9.56)#8 | 0.67%(+10.5)#63 |
| 9. | Lake Telemark | 11.07% | 1.57%(+9.50)#9 | 0.67%(+10.4)#64 |
| 10. | Elmwood Park Borough | 10.06% | 1.57%(+8.49)#10 | 0.67%(+9.39)#73 |
| 11. | Richland | 10.04% | 1.57%(+8.47)#11 | 0.67%(+9.37)#75 |
| 12. | Mizpah | 9.09% | 1.57%(+7.52)#12 | 0.67%(+8.42)#88 |
| 13. | East Vineland | 8.99% | 1.57%(+7.42)#13 | 0.67%(+8.32)#90 |
| 14. | Tavistock Borough | 8.33% | 1.57%(+6.76)#14 | 0.67%(+7.67)#102 |
| 15. | Highland Lakes | 8.02% | 1.57%(+6.45)#15 | 0.67%(+7.35)#109 |
| 16. | Plainsboro Center | 7.74% | 1.57%(+6.17)#16 | 0.67%(+7.07)#116 |
| 17. | Yorketown | 7.30% | 1.57%(+5.73)#17 | 0.67%(+6.63)#124 |
| 18. | Allenhurst Borough | 7.04% | 1.57%(+5.47)#18 | 0.67%(+6.37)#137 |
| 19. | Finderne | 6.90% | 1.57%(+5.33)#19 | 0.67%(+6.24)#140 |
| 20. | Cliffside Park Borough | 6.74% | 1.57%(+5.17)#20 | 0.67%(+6.07)#145 |
| 21. | Connecticut Farms | 6.56% | 1.57%(+4.99)#21 | 0.67%(+5.89)#157 |
| 22. | Leisure Knoll | 6.52% | 1.57%(+4.95)#22 | 0.67%(+5.85)#159 |
| 23. | East Rocky Hill | 6.33% | 1.57%(+4.76)#23 | 0.67%(+5.66)#173 |
| 24. | Ellisburg | 6.17% | 1.57%(+4.60)#24 | 0.67%(+5.51)#178 |
| 25. | Englishtown Borough | 6.06% | 1.57%(+4.49)#25 | 0.67%(+5.39)#187 |
| 26. | Kingston | 5.90% | 1.57%(+4.33)#26 | 0.67%(+5.23)#192 |
| 27. | Linden | 5.86% | 1.57%(+4.29)#27 | 0.67%(+5.20)#194 |
| 28. | Lincoln Park Borough | 5.84% | 1.57%(+4.27)#28 | 0.67%(+5.18)#196 |
| 29. | Cape May Point Borough | 5.81% | 1.57%(+4.24)#29 | 0.67%(+5.14)#200 |
| 30. | Fieldsboro Borough | 5.60% | 1.57%(+4.03)#30 | 0.67%(+4.93)#212 |
| 31. | Helmetta Borough | 5.47% | 1.57%(+3.90)#31 | 0.67%(+4.81)#221 |
| 32. | East Rutherford Borough | 5.41% | 1.57%(+3.84)#32 | 0.67%(+4.74)#229 |
| 33. | Clifton | 5.26% | 1.57%(+3.69)#33 | 0.67%(+4.60)#236 |
| 34. | Navesink | 5.21% | 1.57%(+3.64)#34 | 0.67%(+4.54)#242 |
| 35. | Brownville | 5.18% | 1.57%(+3.61)#35 | 0.67%(+4.51)#245 |
| 36. | Pines Lake | 5.17% | 1.57%(+3.61)#36 | 0.67%(+4.51)#246 |
| 37. | Towaco | 5.06% | 1.57%(+3.49)#37 | 0.67%(+4.39)#262 |
| 38. | Carlstadt Borough | 4.98% | 1.57%(+3.41)#38 | 0.67%(+4.32)#270 |
| 39. | Oakland Borough | 4.96% | 1.57%(+3.39)#39 | 0.67%(+4.30)#271 |
| 40. | Edgewater Borough | 4.96% | 1.57%(+3.39)#40 | 0.67%(+4.29)#272 |
| 41. | South Amboy | 4.88% | 1.57%(+3.32)#41 | 0.67%(+4.22)#279 |
| 42. | Haledon Borough | 4.84% | 1.57%(+3.27)#42 | 0.67%(+4.17)#285 |
| 43. | Old Bridge | 4.83% | 1.57%(+3.26)#43 | 0.67%(+4.16)#287 |
| 44. | Singac | 4.82% | 1.57%(+3.25)#44 | 0.67%(+4.15)#288 |
| 45. | Lodi Borough | 4.71% | 1.57%(+3.14)#45 | 0.67%(+4.04)#293 |
| 46. | Silver Ridge | 4.61% | 1.57%(+3.04)#46 | 0.67%(+3.94)#307 |
| 47. | Fort Lee Borough | 4.57% | 1.57%(+3.00)#47 | 0.67%(+3.90)#314 |
| 48. | Upper Greenwood Lake | 4.56% | 1.57%(+3.00)#48 | 0.67%(+3.90)#315 |
| 49. | Robertsville | 4.50% | 1.57%(+2.93)#49 | 0.67%(+3.83)#322 |
| 50. | Englewood Cliffs Borough | 4.43% | 1.57%(+2.86)#50 | 0.67%(+3.77)#327 |
| 51. | Colonia | 4.36% | 1.57%(+2.79)#51 | 0.67%(+3.69)#334 |
| 52. | Manville Borough | 4.34% | 1.57%(+2.77)#52 | 0.67%(+3.68)#337 |
| 53. | West Berlin | 4.24% | 1.57%(+2.68)#53 | 0.67%(+3.58)#350 |
| 54. | Strathmore | 4.21% | 1.57%(+2.65)#54 | 0.67%(+3.55)#356 |
| 55. | Renaissance At Monroe | 4.20% | 1.57%(+2.63)#55 | 0.67%(+3.53)#358 |
| 56. | Millington | 4.15% | 1.57%(+2.58)#56 | 0.67%(+3.48)#367 |
| 57. | Tenafly Borough | 4.13% | 1.57%(+2.56)#57 | 0.67%(+3.46)#372 |
| 58. | Regency At Monroe | 4.11% | 1.57%(+2.54)#58 | 0.67%(+3.45)#376 |
| 59. | High Bridge Borough | 3.98% | 1.57%(+2.42)#59 | 0.67%(+3.32)#394 |
| 60. | Milltown Borough | 3.95% | 1.57%(+2.38)#60 | 0.67%(+3.28)#401 |
| 61. | Emerson Borough | 3.87% | 1.57%(+2.30)#61 | 0.67%(+3.21)#414 |
| 62. | Robbinsville Center | 3.74% | 1.57%(+2.17)#62 | 0.67%(+3.07)#432 |
| 63. | Woodland Park Borough | 3.72% | 1.57%(+2.15)#63 | 0.67%(+3.05)#437 |
| 64. | Riverdale Borough | 3.70% | 1.57%(+2.13)#64 | 0.67%(+3.03)#441 |
| 65. | Macopin | 3.68% | 1.57%(+2.11)#65 | 0.67%(+3.01)#444 |
| 66. | Pompton Lakes Borough | 3.66% | 1.57%(+2.09)#66 | 0.67%(+2.99)#449 |
| 67. | Hillsdale Borough | 3.63% | 1.57%(+2.07)#67 | 0.67%(+2.97)#454 |
| 68. | Kenvil | 3.61% | 1.57%(+2.04)#68 | 0.67%(+2.94)#463 |
| 69. | The Ponds | 3.60% | 1.57%(+2.03)#69 | 0.67%(+2.93)#464 |
| 70. | Saddle River Borough | 3.60% | 1.57%(+2.03)#70 | 0.67%(+2.93)#465 |
| 71. | Clearbrook | 3.57% | 1.57%(+2.00)#71 | 0.67%(+2.90)#474 |
| 72. | Morganville | 3.55% | 1.57%(+1.98)#72 | 0.67%(+2.88)#478 |
| 73. | Beattystown | 3.53% | 1.57%(+1.96)#73 | 0.67%(+2.86)#483 |
| 74. | Demarest Borough | 3.53% | 1.57%(+1.96)#74 | 0.67%(+2.86)#484 |
| 75. | Cranford | 3.47% | 1.57%(+1.90)#75 | 0.67%(+2.81)#493 |
| 76. | Bedminster | 3.46% | 1.57%(+1.89)#76 | 0.67%(+2.80)#495 |
| 77. | North Haledon Borough | 3.42% | 1.57%(+1.85)#77 | 0.67%(+2.75)#501 |
| 78. | Cresskill Borough | 3.37% | 1.57%(+1.80)#78 | 0.67%(+2.70)#510 |
| 79. | Franklin Lakes Borough | 3.35% | 1.57%(+1.78)#79 | 0.67%(+2.69)#514 |
| 80. | Sayreville Borough | 3.34% | 1.57%(+1.77)#80 | 0.67%(+2.68)#515 |
| 81. | Springdale | 3.34% | 1.57%(+1.77)#81 | 0.67%(+2.67)#516 |
| 82. | Lake Como Borough | 3.33% | 1.57%(+1.76)#82 | 0.67%(+2.67)#517 |
| 83. | Ridgewood | 3.31% | 1.57%(+1.74)#83 | 0.67%(+2.64)#521 |
| 84. | Little Ferry Borough | 3.29% | 1.57%(+1.72)#84 | 0.67%(+2.62)#524 |
| 85. | Lake Hopatcong | 3.28% | 1.57%(+1.71)#85 | 0.67%(+2.62)#527 |
| 86. | Madison Park | 3.21% | 1.57%(+1.64)#86 | 0.67%(+2.54)#544 |
| 87. | Point Pleasant Beach Borough | 3.18% | 1.57%(+1.61)#87 | 0.67%(+2.51)#552 |
| 88. | Rossmoor | 3.17% | 1.57%(+1.61)#88 | 0.67%(+2.51)#553 |
| 89. | Concordia | 3.06% | 1.57%(+1.49)#89 | 0.67%(+2.40)#585 |
| 90. | South River Borough | 3.06% | 1.57%(+1.49)#90 | 0.67%(+2.39)#586 |
| 91. | Fairview Borough | 3.05% | 1.57%(+1.48)#91 | 0.67%(+2.38)#589 |
| 92. | Wanaque Borough | 2.99% | 1.57%(+1.42)#92 | 0.67%(+2.32)#601 |
| 93. | Gillette | 2.98% | 1.57%(+1.41)#93 | 0.67%(+2.31)#605 |
| 94. | Lawrenceville | 2.95% | 1.57%(+1.38)#94 | 0.67%(+2.29)#611 |
| 95. | Butler Borough | 2.95% | 1.57%(+1.38)#95 | 0.67%(+2.28)#614 |
| 96. | Springfield | 2.94% | 1.57%(+1.37)#96 | 0.67%(+2.28)#616 |
| 97. | Whippany | 2.94% | 1.57%(+1.37)#97 | 0.67%(+2.27)#621 |
| 98. | Princeton Junction | 2.92% | 1.57%(+1.35)#98 | 0.67%(+2.25)#626 |
| 99. | Millstone Borough | 2.91% | 1.57%(+1.34)#99 | 0.67%(+2.24)#630 |
| 100. | Hillsborough | 2.90% | 1.57%(+1.33)#100 | 0.67%(+2.23)#636 |
Common Questions
What are the Top 10 Cities with the Highest Percentage of Immigrants from Eastern Europe in New Jersey?
Top 10 Cities with the Highest Percentage of Immigrants from Eastern Europe in New Jersey are:
#1
32.43%
#2
32.16%
#3
18.18%
#4
13.61%
#5
11.13%
#6
11.07%
#7
8.02%
#8
7.74%
#9
7.30%
#10
6.90%
What city has the Highest Percentage of Immigrants from Eastern Europe in New Jersey?
Broadway has the Highest Percentage of Immigrants from Eastern Europe in New Jersey with 32.43%.
What is the Percentage of Immigrants from Eastern Europe in the State of New Jersey?
Percentage of Immigrants from Eastern Europe in New Jersey is 1.57%.
What is the Percentage of Immigrants from Eastern Europe in the United States?
Percentage of Immigrants from Eastern Europe in the United States is 0.67%.