Cities with the Highest Percentage of Population with a Degree in Arts and Humanities in New Jersey
RELATED REPORTS & OPTIONS
Arts and Humanities
New Jersey
Compare Cities
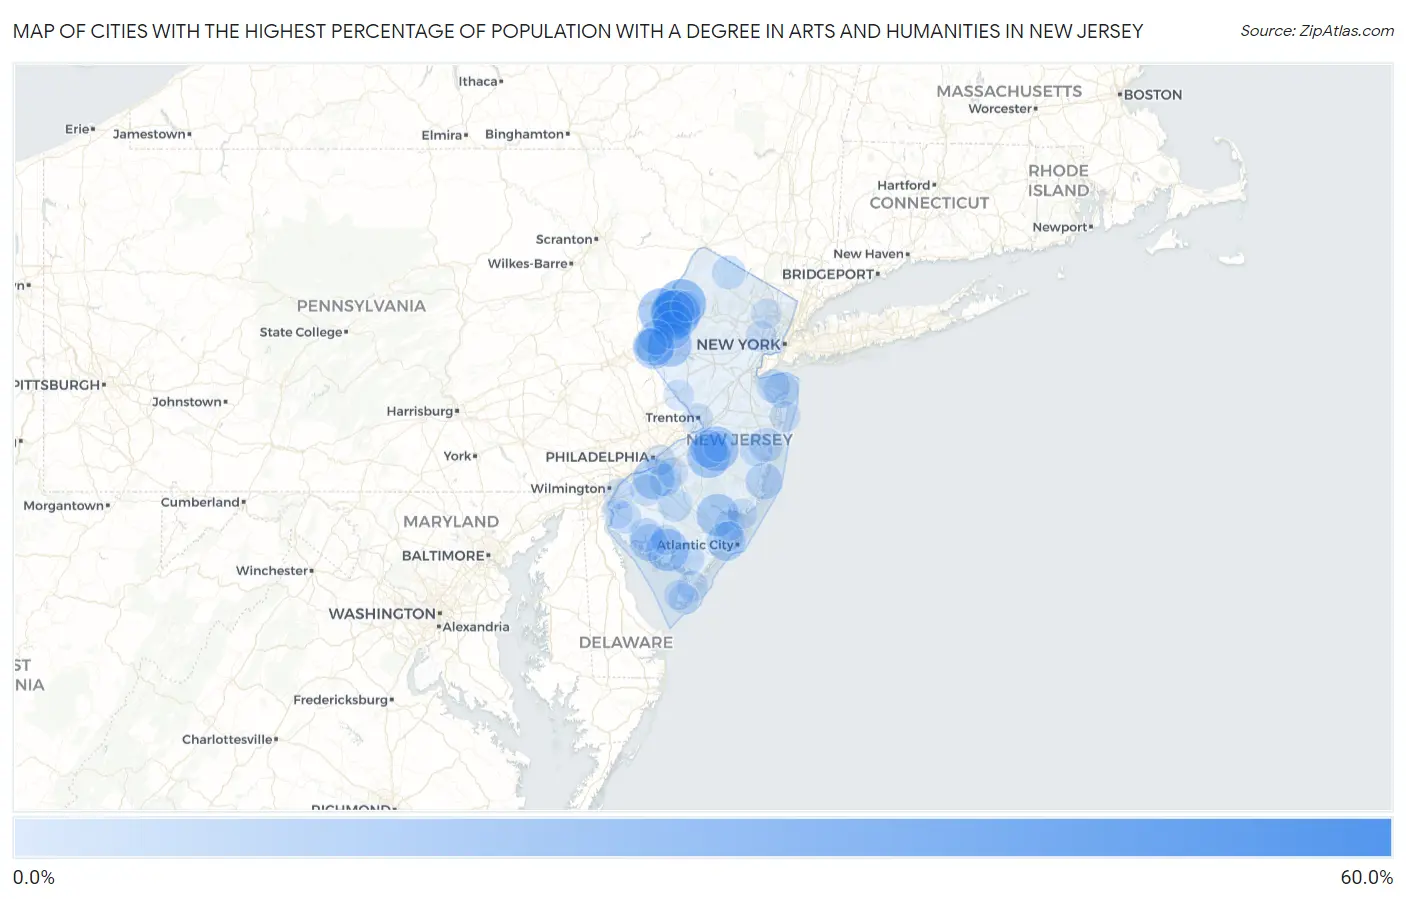
Map of Cities with the Highest Percentage of Population with a Degree in Arts and Humanities in New Jersey
0.0%
60.0%
Cities with the Highest Percentage of Population with a Degree in Arts and Humanities in New Jersey
| City | % Graduates | vs State | vs National | |
| 1. | Arrowhead Lake | 58.3% | 4.7%(+53.6)#1 | 6.0%(+52.3)#276 |
| 2. | Lakeside-Beebe Run | 53.3% | 4.7%(+48.6)#2 | 6.0%(+47.3)#326 |
| 3. | Centre Grove | 32.9% | 4.7%(+28.2)#3 | 6.0%(+26.9)#883 |
| 4. | Marksboro | 28.1% | 4.7%(+23.4)#4 | 6.0%(+22.1)#1,183 |
| 5. | Beesleys Point | 28.1% | 4.7%(+23.4)#5 | 6.0%(+22.1)#1,185 |
| 6. | West Park | 27.4% | 4.7%(+22.7)#6 | 6.0%(+21.4)#1,240 |
| 7. | Hope | 26.9% | 4.7%(+22.2)#7 | 6.0%(+20.9)#1,296 |
| 8. | Columbia | 24.6% | 4.7%(+19.9)#8 | 6.0%(+18.6)#1,528 |
| 9. | Mount Ephraim Borough | 24.0% | 4.7%(+19.3)#9 | 6.0%(+18.0)#1,602 |
| 10. | Pottersville | 23.7% | 4.7%(+19.0)#10 | 6.0%(+17.7)#1,631 |
| 11. | Fort Dix | 23.5% | 4.7%(+18.8)#11 | 6.0%(+17.5)#1,654 |
| 12. | Mount Hermon | 23.3% | 4.7%(+18.6)#12 | 6.0%(+17.3)#1,673 |
| 13. | Asbury | 22.4% | 4.7%(+17.7)#13 | 6.0%(+16.4)#1,786 |
| 14. | Pemberton Heights | 22.3% | 4.7%(+17.6)#14 | 6.0%(+16.3)#1,794 |
| 15. | Dennisville | 22.3% | 4.7%(+17.6)#15 | 6.0%(+16.3)#1,795 |
| 16. | Laurel Lake | 21.3% | 4.7%(+16.5)#16 | 6.0%(+15.3)#1,958 |
| 17. | Egg Harbor City | 21.1% | 4.7%(+16.3)#17 | 6.0%(+15.1)#1,986 |
| 18. | Oak Valley | 20.0% | 4.7%(+15.3)#18 | 6.0%(+14.0)#2,138 |
| 19. | Upper Pohatcong | 19.5% | 4.7%(+14.7)#19 | 6.0%(+13.5)#2,296 |
| 20. | Mountain Lake | 19.0% | 4.7%(+14.3)#20 | 6.0%(+13.1)#2,392 |
| 21. | Newfield Borough | 18.5% | 4.7%(+13.8)#21 | 6.0%(+12.5)#2,505 |
| 22. | Pleasantville | 17.9% | 4.7%(+13.2)#22 | 6.0%(+11.9)#2,645 |
| 23. | Lopatcong Overlook | 17.7% | 4.7%(+13.0)#23 | 6.0%(+11.7)#2,688 |
| 24. | Three Bridges | 17.6% | 4.7%(+12.8)#24 | 6.0%(+11.6)#2,736 |
| 25. | Tuckahoe | 17.4% | 4.7%(+12.7)#25 | 6.0%(+11.4)#2,769 |
| 26. | Buena Borough | 17.3% | 4.7%(+12.6)#26 | 6.0%(+11.3)#2,814 |
| 27. | Oxford | 16.7% | 4.7%(+11.9)#27 | 6.0%(+10.7)#2,957 |
| 28. | Juliustown | 16.7% | 4.7%(+11.9)#28 | 6.0%(+10.7)#3,044 |
| 29. | Atco | 16.0% | 4.7%(+11.3)#29 | 6.0%(+10.0)#3,202 |
| 30. | Fairton | 16.0% | 4.7%(+11.3)#30 | 6.0%(+10.0)#3,207 |
| 31. | Swedesboro Borough | 15.8% | 4.7%(+11.0)#31 | 6.0%(+9.76)#3,304 |
| 32. | Waretown | 15.6% | 4.7%(+10.8)#32 | 6.0%(+9.57)#3,363 |
| 33. | Prospect Park Borough | 15.5% | 4.7%(+10.8)#33 | 6.0%(+9.53)#3,378 |
| 34. | Goshen | 15.4% | 4.7%(+10.7)#34 | 6.0%(+9.39)#3,440 |
| 35. | Branchville Borough | 15.3% | 4.7%(+10.6)#35 | 6.0%(+9.29)#3,482 |
| 36. | Washington Borough | 15.2% | 4.7%(+10.5)#36 | 6.0%(+9.22)#3,517 |
| 37. | Sussex Borough | 14.7% | 4.7%(+9.93)#37 | 6.0%(+8.66)#3,739 |
| 38. | Dividing Creek | 14.3% | 4.7%(+9.56)#38 | 6.0%(+8.29)#3,889 |
| 39. | Harmony | 14.3% | 4.7%(+9.56)#39 | 6.0%(+8.29)#3,903 |
| 40. | Somerdale Borough | 14.3% | 4.7%(+9.55)#40 | 6.0%(+8.28)#3,952 |
| 41. | Navesink | 14.2% | 4.7%(+9.44)#41 | 6.0%(+8.17)#3,986 |
| 42. | Rainbow Lakes | 13.9% | 4.7%(+9.19)#42 | 6.0%(+7.91)#4,074 |
| 43. | Dorothy | 13.7% | 4.7%(+8.98)#43 | 6.0%(+7.71)#4,184 |
| 44. | Leisure Village East | 13.4% | 4.7%(+8.72)#44 | 6.0%(+7.44)#4,291 |
| 45. | Sweetwater | 13.1% | 4.7%(+8.38)#45 | 6.0%(+7.10)#4,503 |
| 46. | Rockaway Borough | 13.0% | 4.7%(+8.26)#46 | 6.0%(+6.99)#4,569 |
| 47. | Victory Lakes | 12.9% | 4.7%(+8.20)#47 | 6.0%(+6.93)#4,602 |
| 48. | Clementon Borough | 12.9% | 4.7%(+8.17)#48 | 6.0%(+6.90)#4,634 |
| 49. | Bridgeton | 12.7% | 4.7%(+8.02)#49 | 6.0%(+6.75)#4,704 |
| 50. | Vernon Center | 12.7% | 4.7%(+8.01)#50 | 6.0%(+6.74)#4,710 |
| 51. | Port Monmouth | 12.7% | 4.7%(+8.00)#51 | 6.0%(+6.72)#4,724 |
| 52. | Lakehurst Borough | 12.7% | 4.7%(+7.93)#52 | 6.0%(+6.66)#4,752 |
| 53. | Lawnside Borough | 12.6% | 4.7%(+7.90)#53 | 6.0%(+6.62)#4,772 |
| 54. | Delaware Park | 12.6% | 4.7%(+7.86)#54 | 6.0%(+6.59)#4,787 |
| 55. | Belleplain | 12.5% | 4.7%(+7.78)#55 | 6.0%(+6.50)#4,846 |
| 56. | East Vineland | 12.3% | 4.7%(+7.54)#56 | 6.0%(+6.27)#5,010 |
| 57. | Westville Borough | 11.8% | 4.7%(+7.12)#57 | 6.0%(+5.84)#5,310 |
| 58. | Pine Lake Park | 11.8% | 4.7%(+7.11)#58 | 6.0%(+5.84)#5,316 |
| 59. | National Park Borough | 11.7% | 4.7%(+6.94)#59 | 6.0%(+5.67)#5,450 |
| 60. | Hi Nella Borough | 11.5% | 4.7%(+6.79)#60 | 6.0%(+5.52)#5,552 |
| 61. | Mckee | 11.4% | 4.7%(+6.71)#61 | 6.0%(+5.43)#5,597 |
| 62. | Blackwood | 11.4% | 4.7%(+6.64)#62 | 6.0%(+5.37)#5,645 |
| 63. | Teterboro Borough | 11.1% | 4.7%(+6.39)#63 | 6.0%(+5.12)#5,880 |
| 64. | Quinton | 11.0% | 4.7%(+6.27)#64 | 6.0%(+5.00)#5,950 |
| 65. | Seaside Heights Borough | 11.0% | 4.7%(+6.23)#65 | 6.0%(+4.96)#5,973 |
| 66. | Mullica Hill | 10.8% | 4.7%(+6.10)#66 | 6.0%(+4.83)#6,074 |
| 67. | Elmer Borough | 10.7% | 4.7%(+5.96)#67 | 6.0%(+4.69)#6,187 |
| 68. | Point Pleasant Beach Borough | 10.6% | 4.7%(+5.92)#68 | 6.0%(+4.65)#6,219 |
| 69. | Upper Greenwood Lake | 10.6% | 4.7%(+5.92)#69 | 6.0%(+4.65)#6,227 |
| 70. | Palermo | 10.5% | 4.7%(+5.78)#70 | 6.0%(+4.51)#6,390 |
| 71. | Trenton | 10.4% | 4.7%(+5.70)#71 | 6.0%(+4.42)#6,450 |
| 72. | East Orange | 10.4% | 4.7%(+5.63)#72 | 6.0%(+4.36)#6,496 |
| 73. | Smithville | 10.3% | 4.7%(+5.54)#73 | 6.0%(+4.26)#6,577 |
| 74. | Cape May Court House | 10.2% | 4.7%(+5.52)#74 | 6.0%(+4.25)#6,601 |
| 75. | Chesilhurst Borough | 10.2% | 4.7%(+5.50)#75 | 6.0%(+4.23)#6,620 |
| 76. | Ocean Gate Borough | 10.2% | 4.7%(+5.45)#76 | 6.0%(+4.18)#6,676 |
| 77. | Loch Arbour | 10.2% | 4.7%(+5.45)#77 | 6.0%(+4.17)#6,688 |
| 78. | Mcguire Afb | 10.1% | 4.7%(+5.42)#78 | 6.0%(+4.15)#6,704 |
| 79. | Camden | 10.1% | 4.7%(+5.33)#79 | 6.0%(+4.05)#6,789 |
| 80. | Pemberton Borough | 10.0% | 4.7%(+5.32)#80 | 6.0%(+4.05)#6,792 |
| 81. | Andover Borough | 10.0% | 4.7%(+5.32)#81 | 6.0%(+4.05)#6,793 |
| 82. | Carneys Point | 9.9% | 4.7%(+5.22)#82 | 6.0%(+3.94)#6,956 |
| 83. | Millville | 9.8% | 4.7%(+5.10)#83 | 6.0%(+3.83)#7,068 |
| 84. | Ramapo College Of New Jersey | 9.8% | 4.7%(+5.08)#84 | 6.0%(+3.81)#7,086 |
| 85. | Echelon | 9.8% | 4.7%(+5.07)#85 | 6.0%(+3.79)#7,107 |
| 86. | Johnsonburg | 9.8% | 4.7%(+5.07)#86 | 6.0%(+3.79)#7,108 |
| 87. | West Long Branch Borough | 9.8% | 4.7%(+5.06)#87 | 6.0%(+3.79)#7,109 |
| 88. | Erma | 9.8% | 4.7%(+5.05)#88 | 6.0%(+3.78)#7,121 |
| 89. | Lambertville | 9.7% | 4.7%(+5.02)#89 | 6.0%(+3.75)#7,154 |
| 90. | Lindenwold Borough | 9.7% | 4.7%(+5.00)#90 | 6.0%(+3.73)#7,181 |
| 91. | Brooklawn Borough | 9.7% | 4.7%(+4.97)#91 | 6.0%(+3.70)#7,216 |
| 92. | Kenilworth Borough | 9.7% | 4.7%(+4.96)#92 | 6.0%(+3.69)#7,221 |
| 93. | Keansburg Borough | 9.7% | 4.7%(+4.95)#93 | 6.0%(+3.68)#7,226 |
| 94. | Paterson | 9.7% | 4.7%(+4.94)#94 | 6.0%(+3.67)#7,253 |
| 95. | Villas | 9.5% | 4.7%(+4.79)#95 | 6.0%(+3.52)#7,420 |
| 96. | Salem | 9.5% | 4.7%(+4.78)#96 | 6.0%(+3.51)#7,430 |
| 97. | Mystic Island | 9.5% | 4.7%(+4.76)#97 | 6.0%(+3.49)#7,447 |
| 98. | Mount Royal | 9.5% | 4.7%(+4.74)#98 | 6.0%(+3.47)#7,469 |
| 99. | Wrightstown Borough | 9.3% | 4.7%(+4.54)#99 | 6.0%(+3.26)#7,717 |
| 100. | Absecon | 9.3% | 4.7%(+4.53)#100 | 6.0%(+3.26)#7,724 |
Common Questions
What are the Top 10 Cities with the Highest Percentage of Population with a Degree in Arts and Humanities in New Jersey?
Top 10 Cities with the Highest Percentage of Population with a Degree in Arts and Humanities in New Jersey are:
#1
28.1%
#2
26.9%
#3
24.6%
#4
23.5%
#5
23.3%
#6
22.4%
#7
22.3%
#8
21.3%
#9
21.1%
#10
20.0%
What city has the Highest Percentage of Population with a Degree in Arts and Humanities in New Jersey?
Marksboro has the Highest Percentage of Population with a Degree in Arts and Humanities in New Jersey with 28.1%.
What is the Percentage of Population with a Degree in Arts and Humanities in the State of New Jersey?
Percentage of Population with a Degree in Arts and Humanities in New Jersey is 4.7%.
What is the Percentage of Population with a Degree in Arts and Humanities in the United States?
Percentage of Population with a Degree in Arts and Humanities in the United States is 6.0%.