Cities with the Highest Percentage of Cuban Population in New Jersey
RELATED REPORTS & OPTIONS
Cuban
New Jersey
Compare Cities
Map of Cities with the Highest Percentage of Cuban Population in New Jersey
0.00%
15.00%
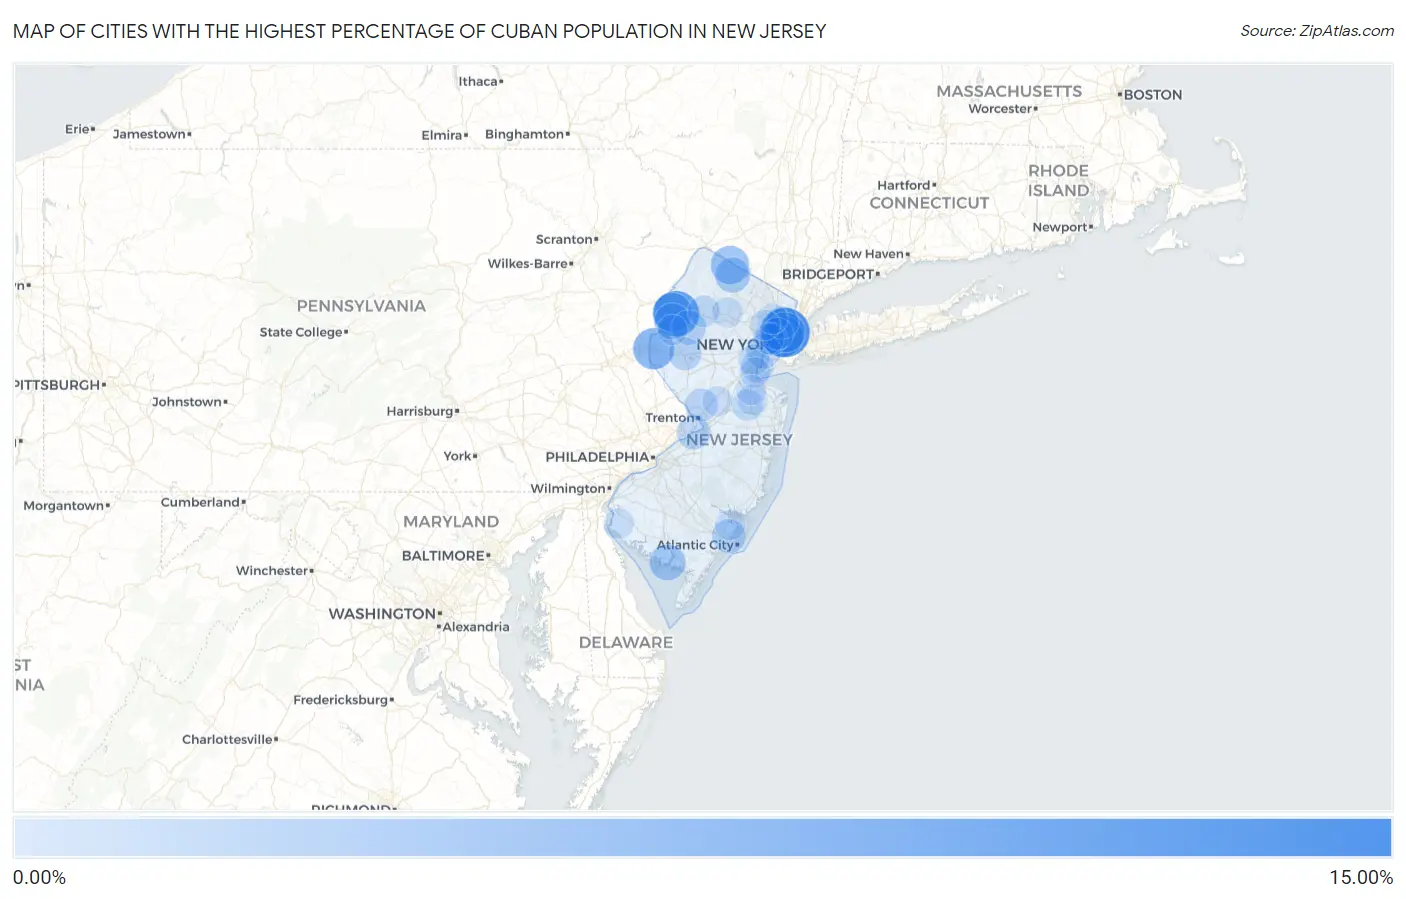
Cities with the Highest Percentage of Cuban Population in New Jersey
| City | Cuban | vs State | vs National | |
| 1. | West New York | 13.32% | 1.03% (+12.3)#1 | 0.73% (+12.6)#102 |
| 2. | Hope | 10.96% | 1.03% (+9.93)#2 | 0.73% (+10.2)#120 |
| 3. | Union City | 8.47% | 1.03% (+7.44)#3 | 0.73% (+7.74)#156 |
| 4. | Beesleys Point | 8.28% | 1.03% (+7.25)#4 | 0.73% (+7.55)#160 |
| 5. | Upper Pohatcong | 8.18% | 1.03% (+7.15)#5 | 0.73% (+7.45)#163 |
| 6. | Guttenberg | 7.51% | 1.03% (+6.48)#6 | 0.73% (+6.79)#177 |
| 7. | Mount Hermon | 6.96% | 1.03% (+5.93)#7 | 0.73% (+6.23)#192 |
| 8. | Ridgefield Borough | 6.95% | 1.03% (+5.92)#8 | 0.73% (+6.23)#193 |
| 9. | Llewellyn Park | 6.90% | 1.03% (+5.87)#9 | 0.73% (+6.18)#194 |
| 10. | Vernon Valley | 6.46% | 1.03% (+5.43)#10 | 0.73% (+5.73)#205 |
| 11. | Kenilworth Borough | 5.51% | 1.03% (+4.48)#11 | 0.73% (+4.79)#234 |
| 12. | Flagtown | 5.41% | 1.03% (+4.37)#12 | 0.73% (+4.68)#244 |
| 13. | Fairview Borough | 5.36% | 1.03% (+4.33)#13 | 0.73% (+4.64)#248 |
| 14. | Mountain Lake | 5.16% | 1.03% (+4.13)#14 | 0.73% (+4.43)#257 |
| 15. | Heislerville | 5.14% | 1.03% (+4.11)#15 | 0.73% (+4.41)#259 |
| 16. | Little Ferry Borough | 5.04% | 1.03% (+4.01)#16 | 0.73% (+4.31)#265 |
| 17. | Port Norris | 5.03% | 1.03% (+4.00)#17 | 0.73% (+4.30)#267 |
| 18. | Mount Tabor | 4.66% | 1.03% (+3.63)#18 | 0.73% (+3.93)#281 |
| 19. | Highland Lakes | 4.57% | 1.03% (+3.54)#19 | 0.73% (+3.85)#288 |
| 20. | Keasbey | 4.48% | 1.03% (+3.45)#20 | 0.73% (+3.75)#294 |
| 21. | East Newark Borough | 4.42% | 1.03% (+3.38)#21 | 0.73% (+3.69)#298 |
| 22. | Elizabeth | 4.09% | 1.03% (+3.06)#22 | 0.73% (+3.36)#322 |
| 23. | Beattystown | 4.07% | 1.03% (+3.04)#23 | 0.73% (+3.34)#325 |
| 24. | Mountainside Borough | 3.89% | 1.03% (+2.86)#24 | 0.73% (+3.16)#342 |
| 25. | Butler Borough | 3.89% | 1.03% (+2.86)#25 | 0.73% (+3.16)#343 |
| 26. | Magnolia Borough | 3.87% | 1.03% (+2.84)#26 | 0.73% (+3.14)#351 |
| 27. | Absecon | 3.78% | 1.03% (+2.74)#27 | 0.73% (+3.05)#359 |
| 28. | Florence | 3.70% | 1.03% (+2.67)#28 | 0.73% (+2.97)#364 |
| 29. | Ho Ho Kus Borough | 3.33% | 1.03% (+2.30)#29 | 0.73% (+2.60)#409 |
| 30. | Annandale | 3.29% | 1.03% (+2.26)#30 | 0.73% (+2.57)#413 |
| 31. | Pine Beach Borough | 3.29% | 1.03% (+2.26)#31 | 0.73% (+2.56)#416 |
| 32. | Lawrenceville | 3.22% | 1.03% (+2.19)#32 | 0.73% (+2.49)#422 |
| 33. | Cliffside Park Borough | 3.20% | 1.03% (+2.17)#33 | 0.73% (+2.47)#424 |
| 34. | Hawthorne Borough | 2.93% | 1.03% (+1.90)#34 | 0.73% (+2.20)#458 |
| 35. | Moonachie Borough | 2.91% | 1.03% (+1.88)#35 | 0.73% (+2.18)#463 |
| 36. | Ridgefield Park | 2.89% | 1.03% (+1.86)#36 | 0.73% (+2.17)#467 |
| 37. | Mantoloking Borough | 2.88% | 1.03% (+1.85)#37 | 0.73% (+2.15)#470 |
| 38. | Port Reading | 2.82% | 1.03% (+1.79)#38 | 0.73% (+2.10)#486 |
| 39. | Garwood Borough | 2.82% | 1.03% (+1.79)#39 | 0.73% (+2.09)#487 |
| 40. | Bloomingdale Borough | 2.74% | 1.03% (+1.71)#40 | 0.73% (+2.02)#498 |
| 41. | Woodlynne Borough | 2.72% | 1.03% (+1.69)#41 | 0.73% (+1.99)#501 |
| 42. | Hasbrouck Heights Borough | 2.70% | 1.03% (+1.67)#42 | 0.73% (+1.97)#508 |
| 43. | Oradell Borough | 2.69% | 1.03% (+1.66)#43 | 0.73% (+1.97)#510 |
| 44. | Kearny | 2.64% | 1.03% (+1.61)#44 | 0.73% (+1.92)#523 |
| 45. | Carlstadt Borough | 2.57% | 1.03% (+1.54)#45 | 0.73% (+1.84)#540 |
| 46. | West Park | 2.56% | 1.03% (+1.53)#46 | 0.73% (+1.84)#542 |
| 47. | Secaucus | 2.56% | 1.03% (+1.53)#47 | 0.73% (+1.84)#543 |
| 48. | Dumont Borough | 2.56% | 1.03% (+1.53)#48 | 0.73% (+1.83)#544 |
| 49. | Cresskill Borough | 2.54% | 1.03% (+1.51)#49 | 0.73% (+1.81)#550 |
| 50. | Byram Center | 2.49% | 1.03% (+1.46)#50 | 0.73% (+1.76)#564 |
| 51. | Wanaque Borough | 2.46% | 1.03% (+1.43)#51 | 0.73% (+1.73)#573 |
| 52. | Westwood Borough | 2.46% | 1.03% (+1.42)#52 | 0.73% (+1.73)#575 |
| 53. | Leonia Borough | 2.44% | 1.03% (+1.41)#53 | 0.73% (+1.71)#583 |
| 54. | Haworth Borough | 2.42% | 1.03% (+1.39)#54 | 0.73% (+1.70)#585 |
| 55. | Rutherford Borough | 2.40% | 1.03% (+1.37)#55 | 0.73% (+1.67)#596 |
| 56. | Maywood Borough | 2.39% | 1.03% (+1.36)#56 | 0.73% (+1.66)#600 |
| 57. | Yorketown | 2.30% | 1.03% (+1.27)#57 | 0.73% (+1.58)#628 |
| 58. | East Rutherford Borough | 2.29% | 1.03% (+1.25)#58 | 0.73% (+1.56)#637 |
| 59. | Rahway | 2.25% | 1.03% (+1.22)#59 | 0.73% (+1.52)#654 |
| 60. | Haledon Borough | 2.24% | 1.03% (+1.21)#60 | 0.73% (+1.51)#662 |
| 61. | Closter Borough | 2.22% | 1.03% (+1.19)#61 | 0.73% (+1.49)#667 |
| 62. | Madison Borough | 2.21% | 1.03% (+1.18)#62 | 0.73% (+1.48)#669 |
| 63. | Teterboro Borough | 2.20% | 1.03% (+1.17)#63 | 0.73% (+1.47)#676 |
| 64. | Cologne | 2.19% | 1.03% (+1.16)#64 | 0.73% (+1.46)#681 |
| 65. | Landing | 2.19% | 1.03% (+1.16)#65 | 0.73% (+1.46)#683 |
| 66. | Andover Borough | 2.14% | 1.03% (+1.11)#66 | 0.73% (+1.42)#697 |
| 67. | Florham Park Borough | 2.12% | 1.03% (+1.09)#67 | 0.73% (+1.39)#703 |
| 68. | Upper Saddle River Borough | 2.11% | 1.03% (+1.07)#68 | 0.73% (+1.38)#710 |
| 69. | Montclair State University | 2.10% | 1.03% (+1.07)#69 | 0.73% (+1.37)#715 |
| 70. | Roselle Borough | 2.09% | 1.03% (+1.06)#70 | 0.73% (+1.37)#718 |
| 71. | Somerdale Borough | 2.05% | 1.03% (+1.01)#71 | 0.73% (+1.32)#730 |
| 72. | White Meadow Lake | 1.96% | 1.03% (+0.932)#72 | 0.73% (+1.24)#760 |
| 73. | Harrison | 1.96% | 1.03% (+0.926)#73 | 0.73% (+1.23)#762 |
| 74. | Hillsdale Borough | 1.96% | 1.03% (+0.925)#74 | 0.73% (+1.23)#763 |
| 75. | Milford Borough | 1.93% | 1.03% (+0.898)#75 | 0.73% (+1.20)#779 |
| 76. | Robertsville | 1.89% | 1.03% (+0.859)#76 | 0.73% (+1.16)#796 |
| 77. | Oakland Borough | 1.88% | 1.03% (+0.854)#77 | 0.73% (+1.16)#797 |
| 78. | Lyons | 1.88% | 1.03% (+0.850)#78 | 0.73% (+1.15)#801 |
| 79. | Hopatcong Borough | 1.85% | 1.03% (+0.822)#79 | 0.73% (+1.13)#815 |
| 80. | New Milford Borough | 1.81% | 1.03% (+0.781)#80 | 0.73% (+1.09)#834 |
| 81. | Fanwood Borough | 1.80% | 1.03% (+0.769)#81 | 0.73% (+1.07)#840 |
| 82. | Hampton Borough | 1.79% | 1.03% (+0.755)#82 | 0.73% (+1.06)#849 |
| 83. | Union | 1.78% | 1.03% (+0.751)#83 | 0.73% (+1.06)#855 |
| 84. | Plainsboro Center | 1.77% | 1.03% (+0.741)#84 | 0.73% (+1.05)#858 |
| 85. | North Arlington Borough | 1.77% | 1.03% (+0.737)#85 | 0.73% (+1.04)#860 |
| 86. | Rocky Hill Borough | 1.76% | 1.03% (+0.732)#86 | 0.73% (+1.04)#862 |
| 87. | Oxford | 1.76% | 1.03% (+0.731)#87 | 0.73% (+1.04)#867 |
| 88. | Perth Amboy | 1.74% | 1.03% (+0.709)#88 | 0.73% (+1.01)#881 |
| 89. | Garfield | 1.73% | 1.03% (+0.697)#89 | 0.73% (+1.00)#888 |
| 90. | Hancocks Bridge | 1.72% | 1.03% (+0.693)#90 | 0.73% (+0.998)#889 |
| 91. | Northvale Borough | 1.72% | 1.03% (+0.689)#91 | 0.73% (+0.993)#892 |
| 92. | Smithville | 1.72% | 1.03% (+0.688)#92 | 0.73% (+0.992)#893 |
| 93. | Brookdale | 1.71% | 1.03% (+0.676)#93 | 0.73% (+0.980)#899 |
| 94. | Waldwick Borough | 1.70% | 1.03% (+0.668)#94 | 0.73% (+0.972)#906 |
| 95. | Rutgers University-Livingston Campus | 1.67% | 1.03% (+0.642)#95 | 0.73% (+0.946)#924 |
| 96. | Woodcliff Lake Borough | 1.66% | 1.03% (+0.626)#96 | 0.73% (+0.930)#935 |
| 97. | South Bound Brook Borough | 1.65% | 1.03% (+0.623)#97 | 0.73% (+0.927)#937 |
| 98. | Milltown Borough | 1.64% | 1.03% (+0.608)#98 | 0.73% (+0.912)#944 |
| 99. | Packanack Lake | 1.62% | 1.03% (+0.591)#99 | 0.73% (+0.895)#953 |
| 100. | Brownville | 1.60% | 1.03% (+0.572)#100 | 0.73% (+0.877)#970 |
Common Questions
What are the Top 10 Cities with the Highest Percentage of Cuban Population in New Jersey?
Top 10 Cities with the Highest Percentage of Cuban Population in New Jersey are:
#1
13.32%
#2
10.96%
#3
8.47%
#4
8.18%
#5
7.51%
#6
6.96%
#7
6.46%
#8
5.16%
#9
5.03%
#10
4.57%
What city has the Highest Percentage of Cuban Population in New Jersey?
West New York has the Highest Percentage of Cuban Population in New Jersey with 13.32%.
What is the Percentage of Cuban Population in the State of New Jersey?
Percentage of Cuban Population in New Jersey is 1.03%.
What is the Percentage of Cuban Population in the United States?
Percentage of Cuban Population in the United States is 0.73%.