Cities with the Highest Percentage of Immigrants from Nicaragua in New Jersey
RELATED REPORTS & OPTIONS
Nicaragua
New Jersey
Compare Cities
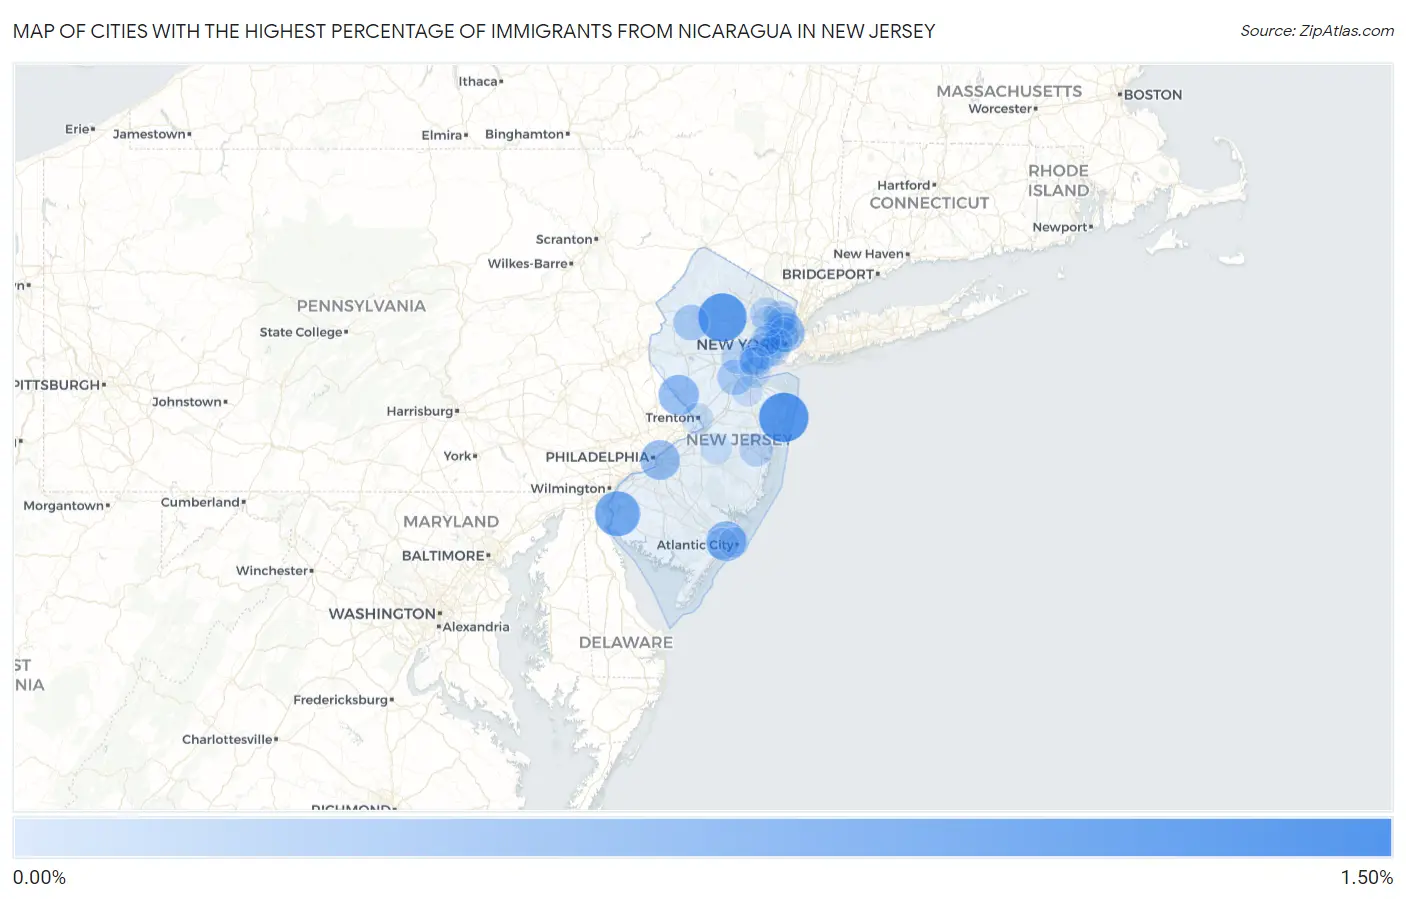
Map of Cities with the Highest Percentage of Immigrants from Nicaragua in New Jersey
0.00%
1.50%
Cities with the Highest Percentage of Immigrants from Nicaragua in New Jersey
| City | Nicaragua | vs State | vs National | |
| 1. | Woodlynne Borough | 1.38% | 0.059%(+1.32)#74 | 0.077%(+1.30)#587 |
| 2. | Asbury Park | 1.26% | 0.059%(+1.20)#75 | 0.077%(+1.18)#588 |
| 3. | Dover | 1.18% | 0.059%(+1.12)#100 | 0.077%(+1.11)#847 |
| 4. | Westwood Borough | 1.14% | 0.059%(+1.08)#101 | 0.077%(+1.06)#848 |
| 5. | Salem | 0.96% | 0.059%(+0.906)#102 | 0.077%(+0.888)#849 |
| 6. | Roselle Park Borough | 0.91% | 0.059%(+0.850)#103 | 0.077%(+0.832)#850 |
| 7. | South Bound Brook Borough | 0.87% | 0.059%(+0.809)#104 | 0.077%(+0.791)#851 |
| 8. | Bradley Beach Borough | 0.80% | 0.059%(+0.737)#105 | 0.077%(+0.720)#852 |
| 9. | Franklin Borough | 0.73% | 0.059%(+0.670)#106 | 0.077%(+0.653)#853 |
| 10. | Lambertville | 0.65% | 0.059%(+0.595)#107 | 0.077%(+0.577)#854 |
| 11. | Pleasantville | 0.63% | 0.059%(+0.573)#111 | 0.077%(+0.555)#904 |
| 12. | Dunellen Borough | 0.62% | 0.059%(+0.559)#112 | 0.077%(+0.542)#905 |
| 13. | Camden | 0.61% | 0.059%(+0.546)#113 | 0.077%(+0.529)#906 |
| 14. | Guttenberg | 0.59% | 0.059%(+0.536)#114 | 0.077%(+0.518)#907 |
| 15. | Far Hills Borough | 0.57% | 0.059%(+0.514)#115 | 0.077%(+0.496)#908 |
| 16. | Ridgefield Borough | 0.48% | 0.059%(+0.420)#116 | 0.077%(+0.403)#909 |
| 17. | Mckee | 0.42% | 0.059%(+0.359)#117 | 0.077%(+0.341)#910 |
| 18. | Elizabeth | 0.39% | 0.059%(+0.326)#118 | 0.077%(+0.308)#911 |
| 19. | Hackettstown | 0.36% | 0.059%(+0.297)#119 | 0.077%(+0.279)#912 |
| 20. | Hi Nella Borough | 0.34% | 0.059%(+0.280)#120 | 0.077%(+0.263)#913 |
| 21. | New Brunswick | 0.34% | 0.059%(+0.278)#121 | 0.077%(+0.260)#948 |
| 22. | Gibbsboro Borough | 0.31% | 0.059%(+0.248)#122 | 0.077%(+0.230)#949 |
| 23. | Linden | 0.28% | 0.059%(+0.217)#123 | 0.077%(+0.199)#950 |
| 24. | Bound Brook Borough | 0.27% | 0.059%(+0.209)#124 | 0.077%(+0.192)#1,090 |
| 25. | Watsessing | 0.22% | 0.059%(+0.161)#125 | 0.077%(+0.143)#1,091 |
| 26. | Highlands Borough | 0.22% | 0.059%(+0.156)#126 | 0.077%(+0.138)#1,092 |
| 27. | Cliffside Park Borough | 0.21% | 0.059%(+0.152)#127 | 0.077%(+0.134)#1,093 |
| 28. | Brooklawn Borough | 0.21% | 0.059%(+0.152)#128 | 0.077%(+0.134)#1,094 |
| 29. | Hackensack | 0.20% | 0.059%(+0.137)#129 | 0.077%(+0.120)#1,095 |
| 30. | Pine Lake Park | 0.20% | 0.059%(+0.136)#130 | 0.077%(+0.119)#1,096 |
| 31. | Middlesex Borough | 0.19% | 0.059%(+0.133)#131 | 0.077%(+0.116)#1,097 |
| 32. | Runnemede Borough | 0.18% | 0.059%(+0.121)#132 | 0.077%(+0.104)#1,098 |
| 33. | Plainfield | 0.18% | 0.059%(+0.117)#133 | 0.077%(+0.100)#1,099 |
| 34. | Collingswood Borough | 0.17% | 0.059%(+0.110)#134 | 0.077%(+0.093)#1,100 |
| 35. | Paterson | 0.15% | 0.059%(+0.095)#135 | 0.077%(+0.078)#1,101 |
| 36. | Pompton Plains | 0.15% | 0.059%(+0.087)#136 | 0.077%(+0.069)#1,102 |
| 37. | Union City | 0.13% | 0.059%(+0.073)#137 | 0.077%(+0.055)#1,103 |
| 38. | Bayonne | 0.13% | 0.059%(+0.072)#138 | 0.077%(+0.055)#1,104 |
| 39. | Ridgefield Park | 0.13% | 0.059%(+0.070)#139 | 0.077%(+0.052)#1,105 |
| 40. | Northfield | 0.12% | 0.059%(+0.059)#140 | 0.077%(+0.042)#1,106 |
| 41. | Tenafly Borough | 0.12% | 0.059%(+0.058)#141 | 0.077%(+0.041)#1,107 |
| 42. | Lindenwold Borough | 0.12% | 0.059%(+0.058)#142 | 0.077%(+0.040)#1,175 |
| 43. | Bergenfield Borough | 0.11% | 0.059%(+0.050)#143 | 0.077%(+0.033)#1,176 |
| 44. | River Edge Borough | 0.11% | 0.059%(+0.049)#144 | 0.077%(+0.031)#1,177 |
| 45. | Sicklerville | 0.10% | 0.059%(+0.045)#145 | 0.077%(+0.028)#1,178 |
| 46. | Trenton | 0.087% | 0.059%(+0.027)#146 | 0.077%(+0.010)#1,179 |
| 47. | Fort Lee Borough | 0.085% | 0.059%(+0.026)#147 | 0.077%(+0.008)#1,180 |
| 48. | Lodi Borough | 0.081% | 0.059%(+0.021)#148 | 0.077%(+0.004)#1,181 |
| 49. | Sayreville Borough | 0.080% | 0.059%(+0.020)#149 | 0.077%(+0.003)#1,182 |
| 50. | Fort Dix | 0.077% | 0.059%(+0.018)#150 | 0.077%(+0.000)#1,183 |
| 51. | Palmyra Borough | 0.067% | 0.059%(+0.008)#151 | 0.077%(-0.010)#1,184 |
| 52. | Roselle Borough | 0.067% | 0.059%(+0.007)#152 | 0.077%(-0.010)#1,185 |
| 53. | Harrison | 0.057% | 0.059%(-0.002)#153 | 0.077%(-0.020)#1,186 |
| 54. | Perth Amboy | 0.054% | 0.059%(-0.005)#154 | 0.077%(-0.023)#1,187 |
| 55. | Rahway | 0.054% | 0.059%(-0.006)#155 | 0.077%(-0.023)#1,188 |
| 56. | Palisades Park Borough | 0.049% | 0.059%(-0.010)#156 | 0.077%(-0.028)#1,189 |
| 57. | Tinton Falls Borough | 0.047% | 0.059%(-0.013)#157 | 0.077%(-0.030)#1,190 |
| 58. | Avenel | 0.046% | 0.059%(-0.013)#158 | 0.077%(-0.031)#1,191 |
| 59. | West New York | 0.038% | 0.059%(-0.021)#159 | 0.077%(-0.039)#1,192 |
| 60. | Jersey City | 0.036% | 0.059%(-0.023)#160 | 0.077%(-0.041)#1,193 |
| 61. | Old Bridge | 0.032% | 0.059%(-0.027)#161 | 0.077%(-0.045)#1,194 |
| 62. | Atlantic City | 0.026% | 0.059%(-0.033)#162 | 0.077%(-0.051)#1,195 |
| 63. | Newark | 0.023% | 0.059%(-0.036)#163 | 0.077%(-0.054)#1,196 |
| 64. | Clifton | 0.019% | 0.059%(-0.040)#164 | 0.077%(-0.058)#1,197 |
Common Questions
What are the Top 10 Cities with the Highest Percentage of Immigrants from Nicaragua in New Jersey?
Top 10 Cities with the Highest Percentage of Immigrants from Nicaragua in New Jersey are:
#1
1.26%
#2
1.18%
#3
0.96%
#4
0.65%
#5
0.63%
#6
0.61%
#7
0.59%
#8
0.39%
#9
0.36%
#10
0.34%
What city has the Highest Percentage of Immigrants from Nicaragua in New Jersey?
Asbury Park has the Highest Percentage of Immigrants from Nicaragua in New Jersey with 1.26%.
What is the Percentage of Immigrants from Nicaragua in the State of New Jersey?
Percentage of Immigrants from Nicaragua in New Jersey is 0.059%.
What is the Percentage of Immigrants from Nicaragua in the United States?
Percentage of Immigrants from Nicaragua in the United States is 0.077%.