Cities with the Most Immigrants from Ghana in New Jersey
RELATED REPORTS & OPTIONS
Ghana
New Jersey
Compare Cities
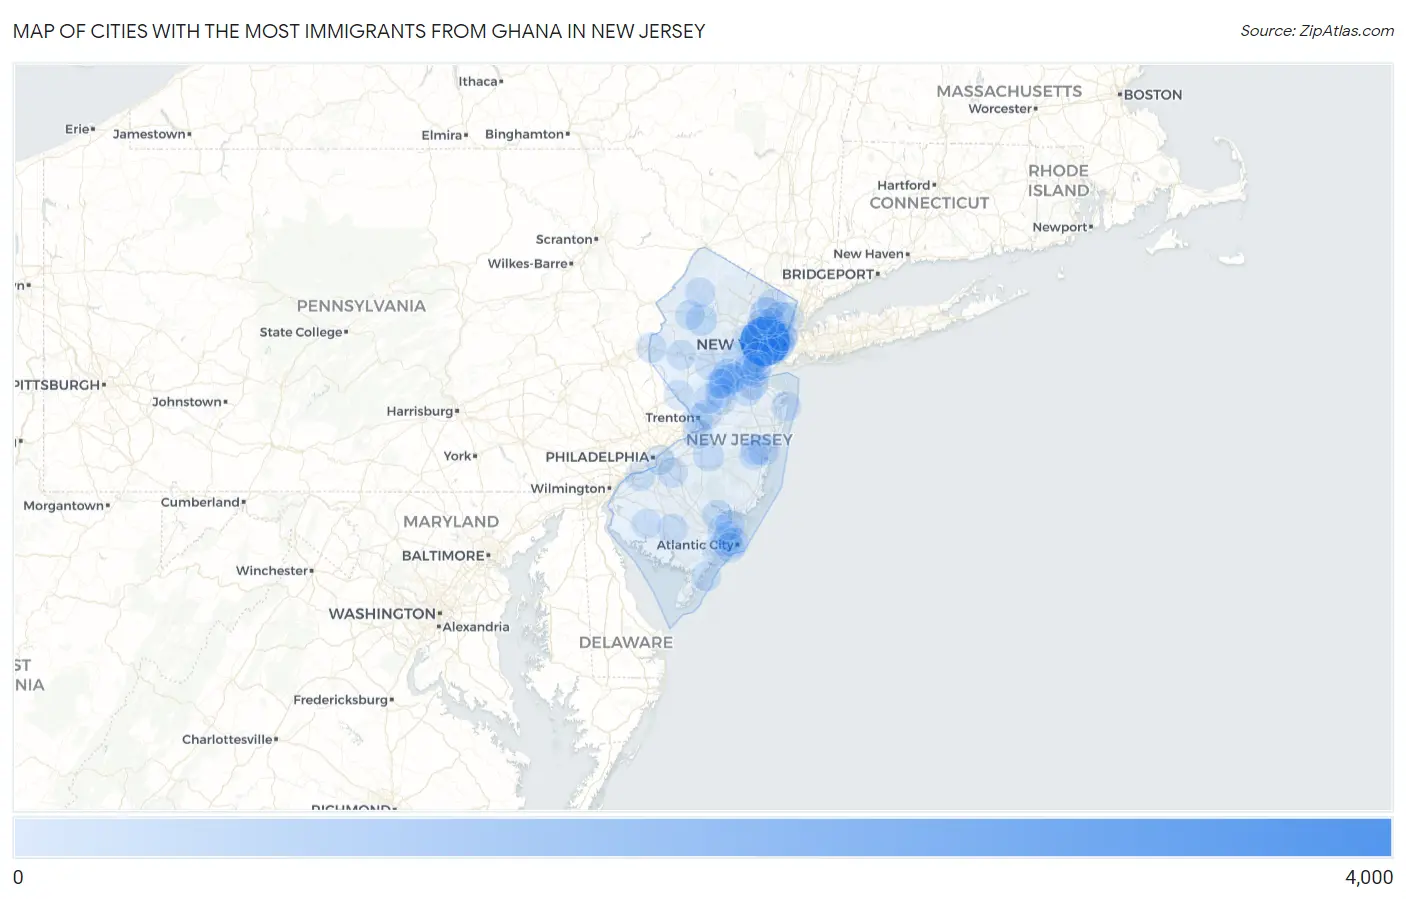
Map of Cities with the Most Immigrants from Ghana in New Jersey
0
4,000
Cities with the Most Immigrants from Ghana in New Jersey
| City | Ghana | vs State | vs National | |
| 1. | Newark | 3,798 | 17,949(21.16%)#1 | 201,796(1.88%)#4 |
| 2. | Jersey City | 790 | 17,949(4.40%)#2 | 201,796(0.39%)#24 |
| 3. | East Orange | 678 | 17,949(3.78%)#3 | 201,796(0.34%)#30 |
| 4. | Paterson | 536 | 17,949(2.99%)#4 | 201,796(0.27%)#44 |
| 5. | Elizabeth | 438 | 17,949(2.44%)#5 | 201,796(0.22%)#60 |
| 6. | Sayreville Borough | 412 | 17,949(2.30%)#6 | 201,796(0.20%)#64 |
| 7. | Madison Park | 315 | 17,949(1.75%)#7 | 201,796(0.16%)#78 |
| 8. | Hackensack | 278 | 17,949(1.55%)#8 | 201,796(0.14%)#93 |
| 9. | Budd Lake | 244 | 17,949(1.36%)#9 | 201,796(0.12%)#109 |
| 10. | Carteret Borough | 233 | 17,949(1.30%)#10 | 201,796(0.12%)#119 |
| 11. | Parsippany | 229 | 17,949(1.28%)#11 | 201,796(0.11%)#124 |
| 12. | Fords | 219 | 17,949(1.22%)#12 | 201,796(0.11%)#136 |
| 13. | Plainfield | 176 | 17,949(0.98%)#13 | 201,796(0.09%)#175 |
| 14. | Toms River | 158 | 17,949(0.88%)#14 | 201,796(0.08%)#193 |
| 15. | Pompton Plains | 149 | 17,949(0.83%)#15 | 201,796(0.07%)#209 |
| 16. | Six Mile Run | 143 | 17,949(0.80%)#16 | 201,796(0.07%)#219 |
| 17. | Hillsborough | 137 | 17,949(0.76%)#17 | 201,796(0.07%)#230 |
| 18. | Trenton | 135 | 17,949(0.75%)#18 | 201,796(0.07%)#234 |
| 19. | Mercerville | 129 | 17,949(0.72%)#19 | 201,796(0.06%)#250 |
| 20. | Somerset | 125 | 17,949(0.70%)#20 | 201,796(0.06%)#260 |
| 21. | New Brunswick | 113 | 17,949(0.63%)#21 | 201,796(0.06%)#281 |
| 22. | Englewood | 113 | 17,949(0.63%)#22 | 201,796(0.06%)#284 |
| 23. | Egg Harbor City | 103 | 17,949(0.57%)#23 | 201,796(0.05%)#309 |
| 24. | Pemberton Heights | 102 | 17,949(0.57%)#24 | 201,796(0.05%)#313 |
| 25. | Franklin Park | 99 | 17,949(0.55%)#25 | 201,796(0.05%)#326 |
| 26. | Roselle Borough | 93 | 17,949(0.52%)#26 | 201,796(0.05%)#340 |
| 27. | Phillipsburg | 90 | 17,949(0.50%)#27 | 201,796(0.04%)#350 |
| 28. | Voorhees | 89 | 17,949(0.50%)#28 | 201,796(0.04%)#353 |
| 29. | Lodi Borough | 88 | 17,949(0.49%)#29 | 201,796(0.04%)#358 |
| 30. | Pleasantville | 84 | 17,949(0.47%)#30 | 201,796(0.04%)#372 |
| 31. | Tenafly Borough | 83 | 17,949(0.46%)#31 | 201,796(0.04%)#378 |
| 32. | Echelon | 80 | 17,949(0.45%)#32 | 201,796(0.04%)#393 |
| 33. | Somers Point | 76 | 17,949(0.42%)#33 | 201,796(0.04%)#408 |
| 34. | Heathcote | 75 | 17,949(0.42%)#34 | 201,796(0.04%)#411 |
| 35. | Hoboken | 72 | 17,949(0.40%)#35 | 201,796(0.04%)#418 |
| 36. | Bergenfield Borough | 72 | 17,949(0.40%)#36 | 201,796(0.04%)#419 |
| 37. | Highland Park Borough | 68 | 17,949(0.38%)#37 | 201,796(0.03%)#452 |
| 38. | Perth Amboy | 66 | 17,949(0.37%)#38 | 201,796(0.03%)#464 |
| 39. | Ridgewood | 66 | 17,949(0.37%)#39 | 201,796(0.03%)#465 |
| 40. | Pine Lake Park | 66 | 17,949(0.37%)#40 | 201,796(0.03%)#470 |
| 41. | Bayonne | 62 | 17,949(0.35%)#41 | 201,796(0.03%)#489 |
| 42. | Collingswood Borough | 59 | 17,949(0.33%)#42 | 201,796(0.03%)#510 |
| 43. | Raritan Borough | 57 | 17,949(0.32%)#43 | 201,796(0.03%)#522 |
| 44. | Vauxhall | 57 | 17,949(0.32%)#44 | 201,796(0.03%)#524 |
| 45. | Vineland | 56 | 17,949(0.31%)#45 | 201,796(0.03%)#528 |
| 46. | Princeton Meadows | 56 | 17,949(0.31%)#46 | 201,796(0.03%)#531 |
| 47. | Sicklerville | 54 | 17,949(0.30%)#47 | 201,796(0.03%)#547 |
| 48. | Newton | 46 | 17,949(0.26%)#48 | 201,796(0.02%)#600 |
| 49. | South River Borough | 44 | 17,949(0.25%)#49 | 201,796(0.02%)#615 |
| 50. | Cliffside Park Borough | 41 | 17,949(0.23%)#50 | 201,796(0.02%)#649 |
| 51. | Dumont Borough | 41 | 17,949(0.23%)#51 | 201,796(0.02%)#650 |
| 52. | Short Hills | 40 | 17,949(0.22%)#52 | 201,796(0.02%)#660 |
| 53. | Great Notch | 40 | 17,949(0.22%)#53 | 201,796(0.02%)#666 |
| 54. | Fair Lawn Borough | 39 | 17,949(0.22%)#54 | 201,796(0.02%)#670 |
| 55. | Pomona | 38 | 17,949(0.21%)#55 | 201,796(0.02%)#690 |
| 56. | Iselin | 37 | 17,949(0.21%)#56 | 201,796(0.02%)#694 |
| 57. | Old Bridge | 33 | 17,949(0.18%)#57 | 201,796(0.02%)#746 |
| 58. | Preakness | 33 | 17,949(0.18%)#58 | 201,796(0.02%)#748 |
| 59. | Roebling | 33 | 17,949(0.18%)#59 | 201,796(0.02%)#753 |
| 60. | Elmwood Park Borough | 32 | 17,949(0.18%)#60 | 201,796(0.02%)#767 |
| 61. | Glassboro Borough | 30 | 17,949(0.17%)#61 | 201,796(0.01%)#794 |
| 62. | Spotswood Borough | 25 | 17,949(0.14%)#62 | 201,796(0.01%)#862 |
| 63. | Keasbey | 25 | 17,949(0.14%)#63 | 201,796(0.01%)#866 |
| 64. | Penns Grove Borough | 24 | 17,949(0.13%)#64 | 201,796(0.01%)#886 |
| 65. | Absecon | 22 | 17,949(0.12%)#65 | 201,796(0.01%)#910 |
| 66. | Hopatcong Borough | 21 | 17,949(0.12%)#66 | 201,796(0.01%)#929 |
| 67. | Atlantic City | 18 | 17,949(0.10%)#67 | 201,796(0.01%)#975 |
| 68. | Lambertville | 18 | 17,949(0.10%)#68 | 201,796(0.01%)#993 |
| 69. | Linden | 17 | 17,949(0.09%)#69 | 201,796(0.01%)#1,004 |
| 70. | Holiday City Berkeley | 17 | 17,949(0.09%)#70 | 201,796(0.01%)#1,013 |
| 71. | Union City | 16 | 17,949(0.09%)#71 | 201,796(0.01%)#1,026 |
| 72. | Smithville | 16 | 17,949(0.09%)#72 | 201,796(0.01%)#1,045 |
| 73. | Stockton University | 16 | 17,949(0.09%)#73 | 201,796(0.01%)#1,048 |
| 74. | Totowa Borough | 15 | 17,949(0.08%)#74 | 201,796(0.01%)#1,065 |
| 75. | Watsessing | 14 | 17,949(0.08%)#75 | 201,796(0.01%)#1,089 |
| 76. | Seabrook Farms | 14 | 17,949(0.08%)#76 | 201,796(0.01%)#1,094 |
| 77. | Roselle Park Borough | 13 | 17,949(0.07%)#77 | 201,796(0.01%)#1,108 |
| 78. | Gibbstown | 13 | 17,949(0.07%)#78 | 201,796(0.01%)#1,116 |
| 79. | Port Morris | 13 | 17,949(0.07%)#79 | 201,796(0.01%)#1,118 |
| 80. | Panther Valley | 12 | 17,949(0.07%)#80 | 201,796(0.01%)#1,137 |
| 81. | Princeton | 11 | 17,949(0.06%)#81 | 201,796(0.01%)#1,153 |
| 82. | Upper Montclair | 11 | 17,949(0.06%)#82 | 201,796(0.01%)#1,158 |
| 83. | Port Reading | 11 | 17,949(0.06%)#83 | 201,796(0.01%)#1,164 |
| 84. | Pleasant Plains | 11 | 17,949(0.06%)#84 | 201,796(0.01%)#1,168 |
| 85. | Passaic | 10 | 17,949(0.06%)#85 | 201,796(0.00%)#1,175 |
| 86. | Maywood Borough | 10 | 17,949(0.06%)#86 | 201,796(0.00%)#1,183 |
| 87. | Belmar Borough | 10 | 17,949(0.06%)#87 | 201,796(0.00%)#1,185 |
| 88. | Long Branch | 9 | 17,949(0.05%)#88 | 201,796(0.00%)#1,203 |
| 89. | Clinton | 9 | 17,949(0.05%)#89 | 201,796(0.00%)#1,219 |
| 90. | Camden | 8 | 17,949(0.04%)#90 | 201,796(0.00%)#1,223 |
| 91. | Bradley Gardens | 7 | 17,949(0.04%)#91 | 201,796(0.00%)#1,261 |
| 92. | The College Of New Jersey | 7 | 17,949(0.04%)#92 | 201,796(0.00%)#1,266 |
| 93. | Allentown Borough | 7 | 17,949(0.04%)#93 | 201,796(0.00%)#1,270 |
| 94. | Metuchen Borough | 6 | 17,949(0.03%)#94 | 201,796(0.00%)#1,284 |
| 95. | Ventnor City | 6 | 17,949(0.03%)#95 | 201,796(0.00%)#1,288 |
| 96. | Union | 6 | 17,949(0.03%)#96 | 201,796(0.00%)#1,297 |
| 97. | Rutgers University-Busch Campus | 5 | 17,949(0.03%)#97 | 201,796(0.00%)#1,328 |
| 98. | Pine Beach Borough | 5 | 17,949(0.03%)#98 | 201,796(0.00%)#1,340 |
| 99. | Sea Isle City | 4 | 17,949(0.02%)#99 | 201,796(0.00%)#1,357 |
| 100. | Farmingdale Borough | 4 | 17,949(0.02%)#100 | 201,796(0.00%)#1,359 |
Common Questions
What are the Top 10 Cities with the Most Immigrants from Ghana in New Jersey?
Top 10 Cities with the Most Immigrants from Ghana in New Jersey are:
#1
3,798
#2
790
#3
678
#4
536
#5
438
#6
315
#7
278
#8
244
#9
219
#10
176
What city has the Most Immigrants from Ghana in New Jersey?
Newark has the Most Immigrants from Ghana in New Jersey with 3,798.
What is the Total Immigrants from Ghana in the State of New Jersey?
Total Immigrants from Ghana in New Jersey is 17,949.
What is the Total Immigrants from Ghana in the United States?
Total Immigrants from Ghana in the United States is 201,796.