Cities with the Highest Percentage of Population Employed in Material Moving in New Jersey
RELATED REPORTS & OPTIONS
Material Moving
New Jersey
Compare Cities
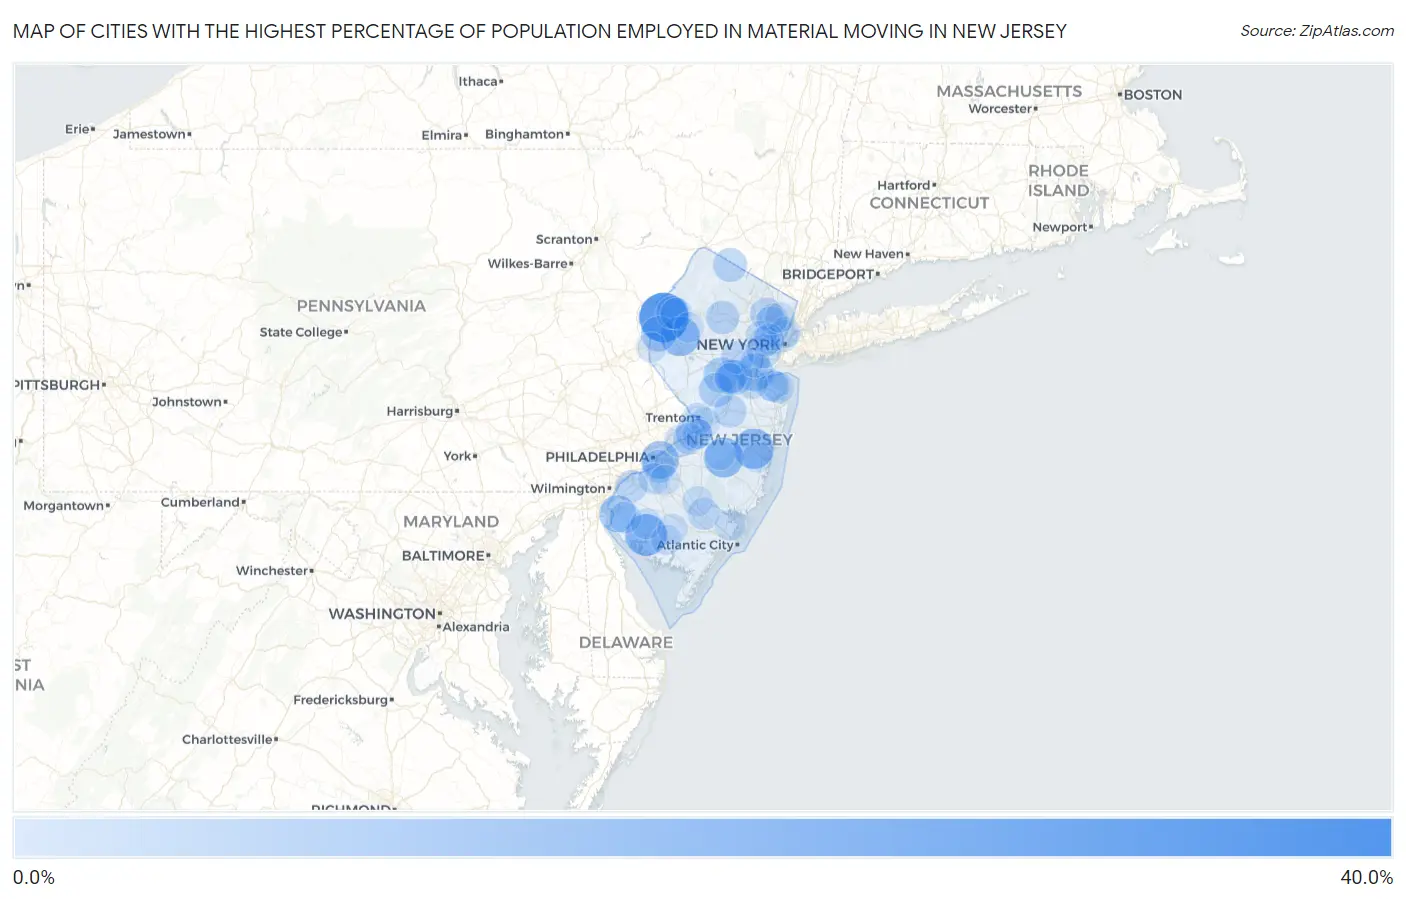
Map of Cities with the Highest Percentage of Population Employed in Material Moving in New Jersey
0.0%
40.0%
Cities with the Highest Percentage of Population Employed in Material Moving in New Jersey
| City | % Employed | vs State | vs National | |
| 1. | Gandys Beach | 33.3% | 3.6%(+29.7)#1 | 3.8%(+29.5)#248 |
| 2. | Delaware | 30.4% | 3.6%(+26.8)#2 | 3.8%(+26.5)#303 |
| 3. | East Vineland | 20.8% | 3.6%(+17.3)#3 | 3.8%(+17.0)#665 |
| 4. | Bridgeton | 20.4% | 3.6%(+16.8)#4 | 3.8%(+16.5)#703 |
| 5. | Delmont | 19.4% | 3.6%(+15.9)#5 | 3.8%(+15.6)#763 |
| 6. | Leisure Village West | 18.3% | 3.6%(+14.7)#6 | 3.8%(+14.5)#874 |
| 7. | Country Lake Estates | 17.8% | 3.6%(+14.2)#7 | 3.8%(+14.0)#927 |
| 8. | Anderson | 17.4% | 3.6%(+13.8)#8 | 3.8%(+13.5)#995 |
| 9. | Woodlynne Borough | 15.6% | 3.6%(+12.0)#9 | 3.8%(+11.7)#1,262 |
| 10. | Camden | 15.1% | 3.6%(+11.5)#10 | 3.8%(+11.2)#1,362 |
| 11. | Perth Amboy | 14.8% | 3.6%(+11.2)#11 | 3.8%(+11.0)#1,408 |
| 12. | Sea Girt Borough | 14.6% | 3.6%(+11.0)#12 | 3.8%(+10.8)#1,470 |
| 13. | Salem | 14.2% | 3.6%(+10.6)#13 | 3.8%(+10.3)#1,569 |
| 14. | Gouldtown | 13.8% | 3.6%(+10.2)#14 | 3.8%(+10.0)#1,661 |
| 15. | Port Morris | 13.0% | 3.6%(+9.36)#15 | 3.8%(+9.12)#1,943 |
| 16. | Fortescue | 12.9% | 3.6%(+9.31)#16 | 3.8%(+9.07)#1,963 |
| 17. | Swedesboro Borough | 12.8% | 3.6%(+9.17)#17 | 3.8%(+8.93)#2,013 |
| 18. | Paulsboro Borough | 12.4% | 3.6%(+8.81)#18 | 3.8%(+8.57)#2,146 |
| 19. | Hutchinson | 12.3% | 3.6%(+8.74)#19 | 3.8%(+8.50)#2,166 |
| 20. | Fieldsboro Borough | 12.2% | 3.6%(+8.57)#20 | 3.8%(+8.33)#2,234 |
| 21. | East Millstone | 12.0% | 3.6%(+8.42)#21 | 3.8%(+8.18)#2,285 |
| 22. | Kean University | 11.9% | 3.6%(+8.31)#22 | 3.8%(+8.07)#2,328 |
| 23. | Florence | 11.9% | 3.6%(+8.31)#23 | 3.8%(+8.07)#2,329 |
| 24. | New Brunswick | 11.7% | 3.6%(+8.10)#24 | 3.8%(+7.86)#2,422 |
| 25. | Monroe Manor | 11.3% | 3.6%(+7.71)#25 | 3.8%(+7.47)#2,584 |
| 26. | Branchville Borough | 10.9% | 3.6%(+7.27)#26 | 3.8%(+7.03)#2,796 |
| 27. | East Rocky Hill | 10.8% | 3.6%(+7.24)#27 | 3.8%(+7.00)#2,813 |
| 28. | Vernon Valley | 10.2% | 3.6%(+6.58)#28 | 3.8%(+6.34)#3,169 |
| 29. | Elizabeth | 10.0% | 3.6%(+6.41)#29 | 3.8%(+6.17)#3,318 |
| 30. | Sunset Lake | 9.9% | 3.6%(+6.27)#30 | 3.8%(+6.03)#3,383 |
| 31. | Merchantville Borough | 9.9% | 3.6%(+6.27)#31 | 3.8%(+6.03)#3,387 |
| 32. | Lavallette Borough | 9.8% | 3.6%(+6.21)#32 | 3.8%(+5.97)#3,435 |
| 33. | Washington Borough | 9.6% | 3.6%(+5.99)#33 | 3.8%(+5.75)#3,592 |
| 34. | East Franklin | 9.5% | 3.6%(+5.92)#34 | 3.8%(+5.68)#3,647 |
| 35. | Dover | 9.5% | 3.6%(+5.88)#35 | 3.8%(+5.64)#3,676 |
| 36. | Dividing Creek | 9.4% | 3.6%(+5.84)#36 | 3.8%(+5.60)#3,720 |
| 37. | Gloucester City | 9.1% | 3.6%(+5.48)#37 | 3.8%(+5.24)#4,022 |
| 38. | Mount Hermon | 9.0% | 3.6%(+5.43)#38 | 3.8%(+5.19)#4,070 |
| 39. | Carlstadt Borough | 9.0% | 3.6%(+5.40)#39 | 3.8%(+5.16)#4,091 |
| 40. | Twin Rivers | 8.8% | 3.6%(+5.21)#40 | 3.8%(+4.97)#4,234 |
| 41. | Dennisville | 8.8% | 3.6%(+5.19)#41 | 3.8%(+4.95)#4,245 |
| 42. | Plainfield | 8.6% | 3.6%(+5.06)#42 | 3.8%(+4.82)#4,360 |
| 43. | National Park Borough | 8.6% | 3.6%(+5.03)#43 | 3.8%(+4.79)#4,390 |
| 44. | Landing | 8.4% | 3.6%(+4.79)#44 | 3.8%(+4.55)#4,625 |
| 45. | Paterson | 8.3% | 3.6%(+4.70)#45 | 3.8%(+4.46)#4,713 |
| 46. | Beckett | 8.2% | 3.6%(+4.64)#46 | 3.8%(+4.41)#4,782 |
| 47. | Penns Grove Borough | 8.2% | 3.6%(+4.61)#47 | 3.8%(+4.37)#4,822 |
| 48. | Passaic | 8.0% | 3.6%(+4.45)#48 | 3.8%(+4.21)#4,991 |
| 49. | Elwood | 8.0% | 3.6%(+4.40)#49 | 3.8%(+4.16)#5,051 |
| 50. | Westville Borough | 7.9% | 3.6%(+4.33)#50 | 3.8%(+4.09)#5,134 |
| 51. | Beverly | 7.9% | 3.6%(+4.32)#51 | 3.8%(+4.08)#5,163 |
| 52. | South Bound Brook Borough | 7.9% | 3.6%(+4.27)#52 | 3.8%(+4.03)#5,217 |
| 53. | Quinton | 7.6% | 3.6%(+4.01)#53 | 3.8%(+3.77)#5,550 |
| 54. | Trenton | 7.5% | 3.6%(+3.95)#54 | 3.8%(+3.71)#5,629 |
| 55. | Carteret Borough | 7.5% | 3.6%(+3.95)#55 | 3.8%(+3.71)#5,634 |
| 56. | Fairview Borough | 7.5% | 3.6%(+3.87)#56 | 3.8%(+3.63)#5,730 |
| 57. | Andover Borough | 7.4% | 3.6%(+3.86)#57 | 3.8%(+3.62)#5,743 |
| 58. | North Middletown | 7.4% | 3.6%(+3.85)#58 | 3.8%(+3.61)#5,754 |
| 59. | Allenhurst Borough | 7.4% | 3.6%(+3.83)#59 | 3.8%(+3.59)#5,777 |
| 60. | Port Monmouth | 7.4% | 3.6%(+3.83)#60 | 3.8%(+3.59)#5,785 |
| 61. | Hope | 7.4% | 3.6%(+3.77)#61 | 3.8%(+3.53)#5,861 |
| 62. | Clementon Borough | 7.3% | 3.6%(+3.74)#62 | 3.8%(+3.50)#5,896 |
| 63. | Union City | 7.2% | 3.6%(+3.58)#63 | 3.8%(+3.34)#6,133 |
| 64. | East Newark Borough | 7.2% | 3.6%(+3.58)#64 | 3.8%(+3.34)#6,134 |
| 65. | Voorhees | 7.1% | 3.6%(+3.53)#65 | 3.8%(+3.29)#6,206 |
| 66. | Hi Nella Borough | 7.1% | 3.6%(+3.49)#66 | 3.8%(+3.25)#6,252 |
| 67. | Menlo Park Terrace | 7.1% | 3.6%(+3.46)#67 | 3.8%(+3.22)#6,291 |
| 68. | Oak Valley | 7.0% | 3.6%(+3.37)#68 | 3.8%(+3.13)#6,447 |
| 69. | Burlington | 6.9% | 3.6%(+3.29)#69 | 3.8%(+3.05)#6,569 |
| 70. | West New York | 6.8% | 3.6%(+3.22)#70 | 3.8%(+2.98)#6,677 |
| 71. | Seabrook Farms | 6.7% | 3.6%(+3.15)#71 | 3.8%(+2.91)#6,774 |
| 72. | East Orange | 6.7% | 3.6%(+3.13)#72 | 3.8%(+2.89)#6,830 |
| 73. | Lawnside Borough | 6.7% | 3.6%(+3.08)#73 | 3.8%(+2.84)#6,889 |
| 74. | Leonardo | 6.6% | 3.6%(+3.04)#74 | 3.8%(+2.80)#6,976 |
| 75. | Smithville | 6.6% | 3.6%(+3.01)#75 | 3.8%(+2.77)#7,033 |
| 76. | Ocean Gate Borough | 6.4% | 3.6%(+2.78)#76 | 3.8%(+2.54)#7,384 |
| 77. | Lindenwold Borough | 6.3% | 3.6%(+2.72)#77 | 3.8%(+2.48)#7,487 |
| 78. | Newark | 6.3% | 3.6%(+2.66)#78 | 3.8%(+2.42)#7,565 |
| 79. | Madison Park | 6.2% | 3.6%(+2.61)#79 | 3.8%(+2.37)#7,657 |
| 80. | Holiday City South | 6.1% | 3.6%(+2.53)#80 | 3.8%(+2.29)#7,799 |
| 81. | White Horse | 6.1% | 3.6%(+2.49)#81 | 3.8%(+2.25)#7,894 |
| 82. | Butler Borough | 6.0% | 3.6%(+2.45)#82 | 3.8%(+2.21)#7,972 |
| 83. | Garfield | 6.0% | 3.6%(+2.43)#83 | 3.8%(+2.19)#8,010 |
| 84. | Haledon Borough | 6.0% | 3.6%(+2.42)#84 | 3.8%(+2.18)#8,028 |
| 85. | Buena Borough | 6.0% | 3.6%(+2.42)#85 | 3.8%(+2.18)#8,040 |
| 86. | Bound Brook Borough | 6.0% | 3.6%(+2.40)#86 | 3.8%(+2.16)#8,062 |
| 87. | Millville | 5.9% | 3.6%(+2.34)#87 | 3.8%(+2.10)#8,183 |
| 88. | Vineland | 5.9% | 3.6%(+2.32)#88 | 3.8%(+2.08)#8,209 |
| 89. | Avenel | 5.8% | 3.6%(+2.22)#89 | 3.8%(+1.98)#8,417 |
| 90. | Phillipsburg | 5.8% | 3.6%(+2.17)#90 | 3.8%(+1.93)#8,511 |
| 91. | Dunellen Borough | 5.7% | 3.6%(+2.15)#91 | 3.8%(+1.91)#8,569 |
| 92. | Hammonton | 5.7% | 3.6%(+2.15)#92 | 3.8%(+1.91)#8,571 |
| 93. | Blackwood | 5.7% | 3.6%(+2.12)#93 | 3.8%(+1.88)#8,625 |
| 94. | Beattystown | 5.7% | 3.6%(+2.12)#94 | 3.8%(+1.88)#8,627 |
| 95. | Brooklawn Borough | 5.7% | 3.6%(+2.10)#95 | 3.8%(+1.86)#8,655 |
| 96. | Hopelawn | 5.7% | 3.6%(+2.09)#96 | 3.8%(+1.85)#8,689 |
| 97. | Harrison | 5.7% | 3.6%(+2.09)#97 | 3.8%(+1.85)#8,699 |
| 98. | Hackensack | 5.6% | 3.6%(+1.96)#98 | 3.8%(+1.72)#8,966 |
| 99. | Browns Mills | 5.5% | 3.6%(+1.90)#99 | 3.8%(+1.66)#9,064 |
| 100. | Roebling | 5.5% | 3.6%(+1.90)#100 | 3.8%(+1.66)#9,073 |
Common Questions
What are the Top 10 Cities with the Highest Percentage of Population Employed in Material Moving in New Jersey?
Top 10 Cities with the Highest Percentage of Population Employed in Material Moving in New Jersey are:
#1
30.4%
#2
20.4%
#3
18.3%
#4
17.8%
#5
17.4%
#6
15.1%
#7
14.8%
#8
14.2%
#9
12.3%
#10
12.0%
What city has the Highest Percentage of Population Employed in Material Moving in New Jersey?
Delaware has the Highest Percentage of Population Employed in Material Moving in New Jersey with 30.4%.
What is the Percentage of Population Employed in Material Moving in the State of New Jersey?
Percentage of Population Employed in Material Moving in New Jersey is 3.6%.
What is the Percentage of Population Employed in Material Moving in the United States?
Percentage of Population Employed in Material Moving in the United States is 3.8%.