Cities with the Highest Percentage of Immigrants from Vietnam in New Jersey
RELATED REPORTS & OPTIONS
Vietnam
New Jersey
Compare Cities
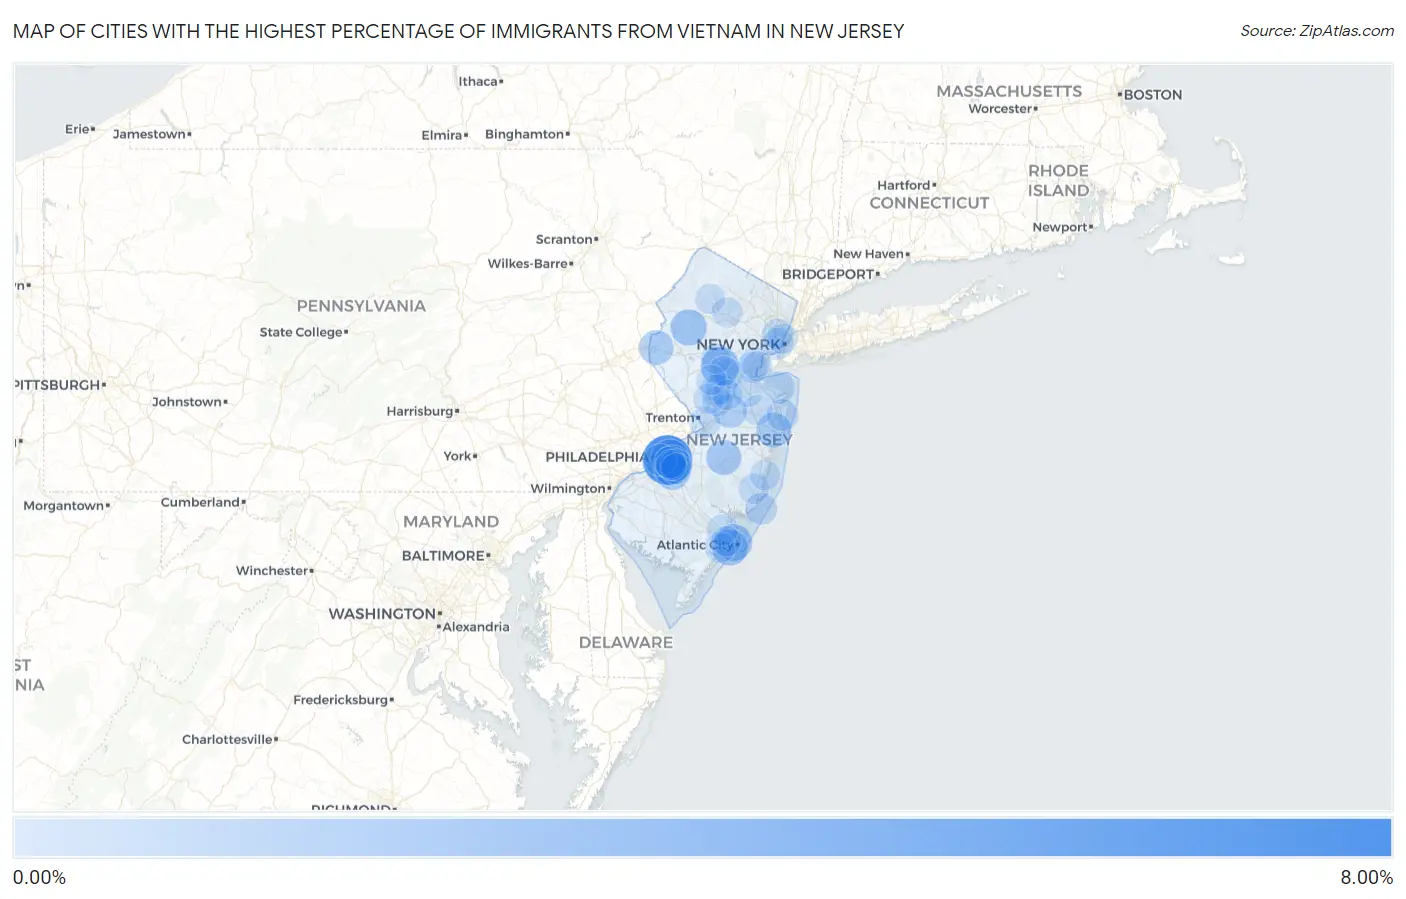
Map of Cities with the Highest Percentage of Immigrants from Vietnam in New Jersey
0.00%
8.00%
Cities with the Highest Percentage of Immigrants from Vietnam in New Jersey
| City | Vietnam | vs State | vs National | |
| 1. | Golden Triangle | 6.90% | 0.17%(+6.73)#-1 | 0.41%(+6.49)#0 |
| 2. | Cherry Hill Mall | 2.97% | 0.17%(+2.80)#46 | 0.41%(+2.56)#1,723 |
| 3. | Finderne | 2.96% | 0.17%(+2.79)#47 | 0.41%(+2.55)#1,724 |
| 4. | Eatontown Borough | 2.84% | 0.17%(+2.67)#48 | 0.41%(+2.43)#1,759 |
| 5. | Union | 2.66% | 0.17%(+2.49)#49 | 0.41%(+2.25)#1,760 |
| 6. | Woodlynne Borough | 2.44% | 0.17%(+2.28)#50 | 0.41%(+2.04)#1,761 |
| 7. | Atlantic City | 2.40% | 0.17%(+2.23)#51 | 0.41%(+1.99)#1,762 |
| 8. | Beattystown | 2.18% | 0.17%(+2.01)#52 | 0.41%(+1.77)#1,763 |
| 9. | Ventnor City | 2.13% | 0.17%(+1.96)#53 | 0.41%(+1.72)#1,764 |
| 10. | Magnolia Borough | 1.93% | 0.17%(+1.77)#54 | 0.41%(+1.53)#1,765 |
| 11. | Neshanic Station | 1.90% | 0.17%(+1.73)#55 | 0.41%(+1.49)#1,766 |
| 12. | Country Lake Estates | 1.79% | 0.17%(+1.63)#56 | 0.41%(+1.39)#1,767 |
| 13. | Allenwood | 1.77% | 0.17%(+1.60)#57 | 0.41%(+1.36)#1,768 |
| 14. | Echelon | 1.73% | 0.17%(+1.56)#58 | 0.41%(+1.33)#1,769 |
| 15. | Kingston Estates | 1.64% | 0.17%(+1.47)#59 | 0.41%(+1.24)#1,770 |
| 16. | Greenwich | 1.64% | 0.17%(+1.47)#60 | 0.41%(+1.23)#1,771 |
| 17. | Twin Rivers | 1.33% | 0.17%(+1.16)#61 | 0.41%(+0.918)#1,772 |
| 18. | Ashland | 1.32% | 0.17%(+1.15)#62 | 0.41%(+0.914)#1,773 |
| 19. | Hopelawn | 1.27% | 0.17%(+1.10)#63 | 0.41%(+0.864)#1,774 |
| 20. | Wharton Borough | 1.23% | 0.17%(+1.06)#64 | 0.41%(+0.826)#1,775 |
| 21. | Dunellen Borough | 1.21% | 0.17%(+1.04)#65 | 0.41%(+0.803)#1,776 |
| 22. | Morris Plains Borough | 1.10% | 0.17%(+0.928)#66 | 0.41%(+0.690)#1,777 |
| 23. | Raritan Borough | 1.10% | 0.17%(+0.927)#67 | 0.41%(+0.689)#1,778 |
| 24. | Ramapo College Of New Jersey | 1.03% | 0.17%(+0.856)#68 | 0.41%(+0.618)#1,779 |
| 25. | Lake Hiawatha | 1.01% | 0.17%(+0.844)#69 | 0.41%(+0.606)#1,780 |
| 26. | Moonachie Borough | 0.91% | 0.17%(+0.736)#70 | 0.41%(+0.498)#1,781 |
| 27. | Roseland Borough | 0.87% | 0.17%(+0.699)#71 | 0.41%(+0.460)#1,782 |
| 28. | Leonardo | 0.86% | 0.17%(+0.687)#72 | 0.41%(+0.449)#1,783 |
| 29. | Laurel Springs Borough | 0.75% | 0.17%(+0.579)#73 | 0.41%(+0.341)#1,784 |
| 30. | Camden | 0.71% | 0.17%(+0.544)#74 | 0.41%(+0.305)#1,785 |
| 31. | North Beach Haven | 0.71% | 0.17%(+0.542)#75 | 0.41%(+0.303)#1,786 |
| 32. | Highlands Borough | 0.69% | 0.17%(+0.520)#76 | 0.41%(+0.281)#1,787 |
| 33. | Greentree | 0.68% | 0.17%(+0.512)#77 | 0.41%(+0.273)#1,788 |
| 34. | Ellisburg | 0.68% | 0.17%(+0.507)#78 | 0.41%(+0.268)#1,789 |
| 35. | Wanamassa | 0.67% | 0.17%(+0.498)#79 | 0.41%(+0.260)#1,790 |
| 36. | Leonia Borough | 0.64% | 0.17%(+0.467)#80 | 0.41%(+0.229)#1,791 |
| 37. | Lindenwold Borough | 0.62% | 0.17%(+0.450)#81 | 0.41%(+0.211)#1,792 |
| 38. | Rutgers University-Busch Campus | 0.62% | 0.17%(+0.446)#82 | 0.41%(+0.208)#1,793 |
| 39. | Middlesex Borough | 0.60% | 0.17%(+0.430)#83 | 0.41%(+0.191)#1,794 |
| 40. | River Edge Borough | 0.58% | 0.17%(+0.413)#84 | 0.41%(+0.175)#1,795 |
| 41. | Merchantville Borough | 0.58% | 0.17%(+0.410)#85 | 0.41%(+0.171)#1,796 |
| 42. | Robbinsville Center | 0.56% | 0.17%(+0.387)#86 | 0.41%(+0.149)#1,797 |
| 43. | Jersey City | 0.55% | 0.17%(+0.378)#87 | 0.41%(+0.139)#2,491 |
| 44. | Kendall Park | 0.51% | 0.17%(+0.339)#88 | 0.41%(+0.101)#2,492 |
| 45. | Old Bridge | 0.50% | 0.17%(+0.329)#89 | 0.41%(+0.091)#2,493 |
| 46. | Hasbrouck Heights Borough | 0.50% | 0.17%(+0.328)#90 | 0.41%(+0.089)#2,494 |
| 47. | East Rocky Hill | 0.49% | 0.17%(+0.317)#91 | 0.41%(+0.079)#2,495 |
| 48. | Manville Borough | 0.48% | 0.17%(+0.308)#92 | 0.41%(+0.070)#2,496 |
| 49. | White Horse | 0.47% | 0.17%(+0.305)#93 | 0.41%(+0.067)#2,497 |
| 50. | Rutgers University-Livingston Campus | 0.47% | 0.17%(+0.298)#94 | 0.41%(+0.059)#2,498 |
| 51. | Pomona | 0.46% | 0.17%(+0.293)#95 | 0.41%(+0.054)#2,499 |
| 52. | Little Ferry Borough | 0.46% | 0.17%(+0.287)#96 | 0.41%(+0.049)#2,500 |
| 53. | South Plainfield Borough | 0.45% | 0.17%(+0.284)#97 | 0.41%(+0.046)#2,501 |
| 54. | Peapack And Gladstone Borough | 0.43% | 0.17%(+0.260)#98 | 0.41%(+0.022)#2,502 |
| 55. | Woodbridge | 0.41% | 0.17%(+0.237)#99 | 0.41%(-0.001)#2,503 |
| 56. | Roosevelt Borough | 0.39% | 0.17%(+0.217)#100 | 0.41%(-0.022)#2,504 |
| 57. | Englewood Cliffs Borough | 0.37% | 0.17%(+0.205)#101 | 0.41%(-0.034)#2,505 |
| 58. | Palmyra Borough | 0.36% | 0.17%(+0.194)#102 | 0.41%(-0.045)#2,506 |
| 59. | Parsippany | 0.36% | 0.17%(+0.189)#103 | 0.41%(-0.050)#2,554 |
| 60. | Ocean Acres | 0.32% | 0.17%(+0.155)#104 | 0.41%(-0.084)#2,555 |
| 61. | Springdale | 0.31% | 0.17%(+0.146)#105 | 0.41%(-0.093)#2,556 |
| 62. | South Bound Brook Borough | 0.31% | 0.17%(+0.141)#106 | 0.41%(-0.098)#2,557 |
| 63. | Secaucus | 0.30% | 0.17%(+0.134)#107 | 0.41%(-0.105)#2,558 |
| 64. | Fair Lawn Borough | 0.30% | 0.17%(+0.131)#108 | 0.41%(-0.107)#2,559 |
| 65. | Victory Gardens Borough | 0.28% | 0.17%(+0.115)#109 | 0.41%(-0.124)#2,560 |
| 66. | Tenafly Borough | 0.27% | 0.17%(+0.105)#110 | 0.41%(-0.133)#2,561 |
| 67. | Ringwood Borough | 0.27% | 0.17%(+0.105)#111 | 0.41%(-0.134)#2,562 |
| 68. | Linwood | 0.27% | 0.17%(+0.104)#112 | 0.41%(-0.134)#2,563 |
| 69. | Wood Ridge Borough | 0.27% | 0.17%(+0.101)#113 | 0.41%(-0.137)#2,564 |
| 70. | Somerset | 0.27% | 0.17%(+0.099)#114 | 0.41%(-0.140)#2,792 |
| 71. | White Meadow Lake | 0.26% | 0.17%(+0.091)#115 | 0.41%(-0.147)#2,793 |
| 72. | Woodbury Heights Borough | 0.26% | 0.17%(+0.090)#116 | 0.41%(-0.149)#2,794 |
| 73. | Rockaway Borough | 0.26% | 0.17%(+0.089)#117 | 0.41%(-0.150)#2,795 |
| 74. | Plainsboro Center | 0.25% | 0.17%(+0.084)#118 | 0.41%(-0.155)#2,796 |
| 75. | Princeton | 0.25% | 0.17%(+0.077)#119 | 0.41%(-0.161)#2,797 |
| 76. | Midland Park Borough | 0.24% | 0.17%(+0.073)#120 | 0.41%(-0.166)#2,798 |
| 77. | Forked River | 0.24% | 0.17%(+0.071)#121 | 0.41%(-0.168)#2,799 |
| 78. | East Freehold | 0.23% | 0.17%(+0.064)#122 | 0.41%(-0.175)#2,800 |
| 79. | Avenel | 0.23% | 0.17%(+0.063)#123 | 0.41%(-0.175)#2,801 |
| 80. | Park Ridge Borough | 0.23% | 0.17%(+0.062)#124 | 0.41%(-0.177)#2,802 |
| 81. | Mckee | 0.23% | 0.17%(+0.061)#125 | 0.41%(-0.178)#2,803 |
| 82. | Somerville Borough | 0.22% | 0.17%(+0.055)#126 | 0.41%(-0.183)#2,804 |
| 83. | Fort Lee Borough | 0.22% | 0.17%(+0.049)#127 | 0.41%(-0.189)#2,805 |
| 84. | Hoboken | 0.22% | 0.17%(+0.049)#128 | 0.41%(-0.190)#2,806 |
| 85. | Lincoln Park Borough | 0.21% | 0.17%(+0.042)#129 | 0.41%(-0.196)#2,807 |
| 86. | Green Knoll | 0.21% | 0.17%(+0.042)#130 | 0.41%(-0.197)#2,808 |
| 87. | Matawan Borough | 0.21% | 0.17%(+0.040)#131 | 0.41%(-0.198)#2,809 |
| 88. | Alpine Borough | 0.21% | 0.17%(+0.038)#132 | 0.41%(-0.201)#2,810 |
| 89. | Dayton | 0.20% | 0.17%(+0.034)#133 | 0.41%(-0.204)#2,811 |
| 90. | Collingswood Borough | 0.19% | 0.17%(+0.022)#134 | 0.41%(-0.217)#2,812 |
| 91. | Franklin Center | 0.18% | 0.17%(+0.010)#135 | 0.41%(-0.229)#2,813 |
| 92. | Red Bank Borough | 0.18% | 0.17%(+0.010)#136 | 0.41%(-0.229)#2,814 |
| 93. | Port Reading | 0.17% | 0.17%(+0.004)#137 | 0.41%(-0.234)#2,815 |
| 94. | Pleasantville | 0.17% | 0.17%(+0.001)#138 | 0.41%(-0.237)#2,816 |
| 95. | National Park Borough | 0.17% | 0.17%(-0.004)#139 | 0.41%(-0.243)#2,817 |
| 96. | Glassboro Borough | 0.17% | 0.17%(-0.004)#140 | 0.41%(-0.243)#2,818 |
| 97. | Barclay | 0.16% | 0.17%(-0.014)#141 | 0.41%(-0.252)#2,819 |
| 98. | Lake Mohawk | 0.15% | 0.17%(-0.015)#142 | 0.41%(-0.253)#2,820 |
| 99. | Belle Mead | 0.15% | 0.17%(-0.016)#143 | 0.41%(-0.254)#2,821 |
| 100. | Westville Borough | 0.14% | 0.17%(-0.029)#144 | 0.41%(-0.267)#2,822 |
Common Questions
What are the Top 10 Cities with the Highest Percentage of Immigrants from Vietnam in New Jersey?
Top 10 Cities with the Highest Percentage of Immigrants from Vietnam in New Jersey are:
#1
6.90%
#2
2.97%
#3
2.96%
#4
2.40%
#5
2.18%
#6
2.13%
#7
1.79%
#8
1.77%
#9
1.73%
#10
1.64%
What city has the Highest Percentage of Immigrants from Vietnam in New Jersey?
Golden Triangle has the Highest Percentage of Immigrants from Vietnam in New Jersey with 6.90%.
What is the Percentage of Immigrants from Vietnam in the State of New Jersey?
Percentage of Immigrants from Vietnam in New Jersey is 0.17%.
What is the Percentage of Immigrants from Vietnam in the United States?
Percentage of Immigrants from Vietnam in the United States is 0.41%.