Cities with the Highest Percentage of Population Employed in Business & Financial in New Jersey
RELATED REPORTS & OPTIONS
Business & Financial
New Jersey
Compare Cities
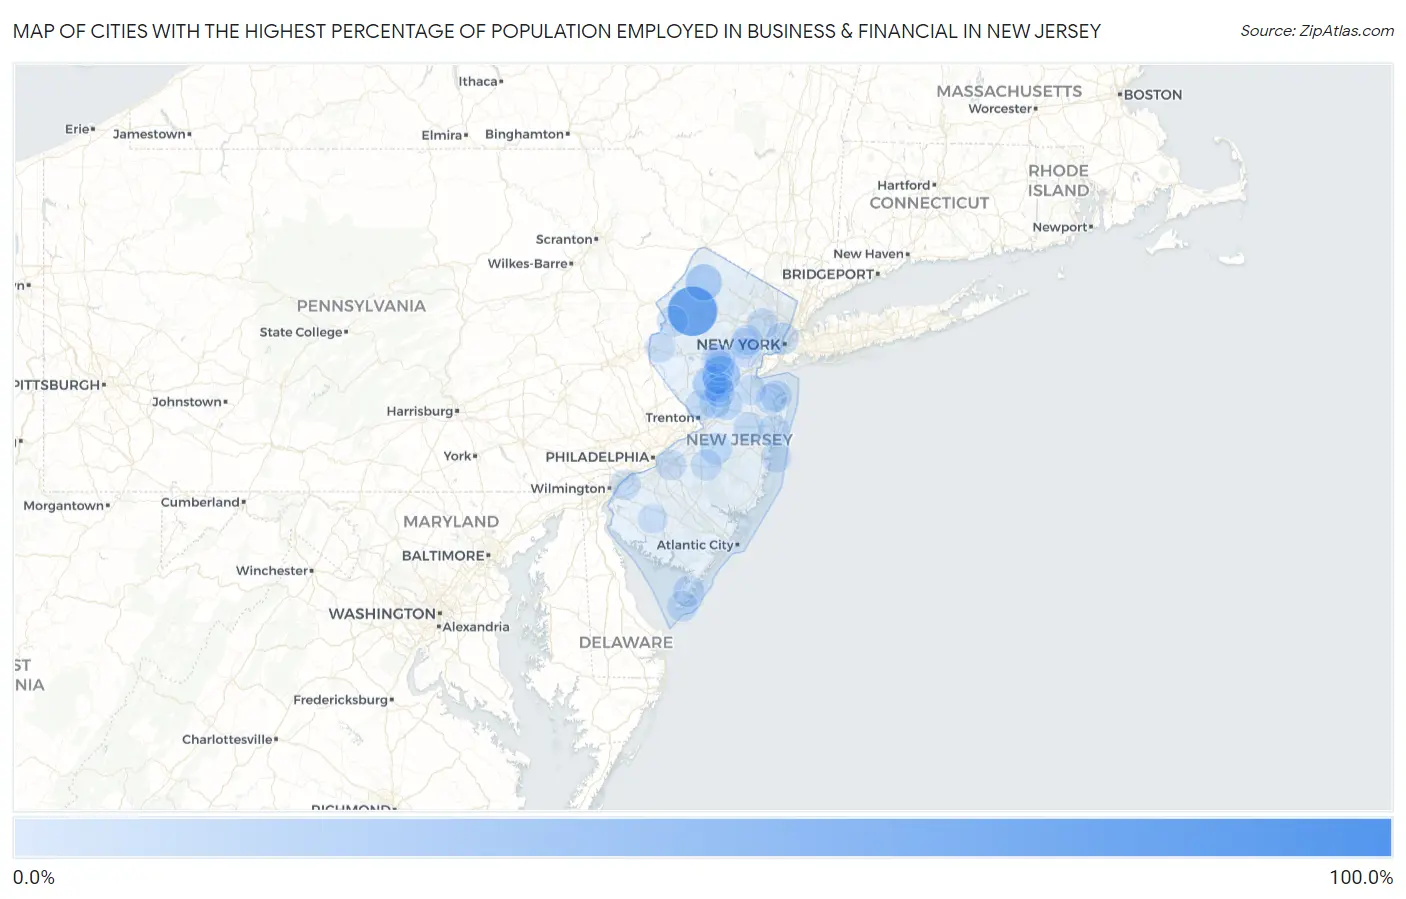
Map of Cities with the Highest Percentage of Population Employed in Business & Financial in New Jersey
0.0%
100.0%
Cities with the Highest Percentage of Population Employed in Business & Financial in New Jersey
| City | % Employed | vs State | vs National | |
| 1. | Money Island | 100.0% | 7.1%(+92.9)#1 | 5.8%(+94.2)#17 |
| 2. | Allamuchy | 76.2% | 7.1%(+69.1)#2 | 5.8%(+70.4)#23 |
| 3. | East Millstone | 37.2% | 7.1%(+30.1)#3 | 5.8%(+31.4)#103 |
| 4. | Encore At Monroe | 32.6% | 7.1%(+25.5)#4 | 5.8%(+26.8)#143 |
| 5. | Ross Corner | 31.6% | 7.1%(+24.5)#5 | 5.8%(+25.8)#153 |
| 6. | Llewellyn Park | 29.5% | 7.1%(+22.4)#6 | 5.8%(+23.7)#179 |
| 7. | Mantoloking Borough | 26.4% | 7.1%(+19.3)#7 | 5.8%(+20.6)#218 |
| 8. | Goshen | 26.1% | 7.1%(+19.0)#8 | 5.8%(+20.4)#222 |
| 9. | Harlingen | 25.6% | 7.1%(+18.5)#9 | 5.8%(+19.9)#234 |
| 10. | Hewitt | 24.6% | 7.1%(+17.5)#10 | 5.8%(+18.8)#252 |
| 11. | Beesleys Point | 20.7% | 7.1%(+13.6)#11 | 5.8%(+14.9)#360 |
| 12. | Spring Lake Borough | 20.7% | 7.1%(+13.6)#12 | 5.8%(+14.9)#361 |
| 13. | Hibernia | 20.0% | 7.1%(+12.9)#13 | 5.8%(+14.2)#397 |
| 14. | Crosswicks | 19.4% | 7.1%(+12.3)#14 | 5.8%(+13.6)#421 |
| 15. | Hoboken | 19.0% | 7.1%(+12.0)#15 | 5.8%(+13.3)#442 |
| 16. | Cranbury | 18.2% | 7.1%(+11.2)#16 | 5.8%(+12.5)#483 |
| 17. | Chatham Borough | 18.1% | 7.1%(+11.0)#17 | 5.8%(+12.3)#492 |
| 18. | Upper Saddle River Borough | 17.9% | 7.1%(+10.8)#18 | 5.8%(+12.2)#499 |
| 19. | Edgewater Borough | 17.3% | 7.1%(+10.2)#19 | 5.8%(+11.5)#538 |
| 20. | Robbinsville Center | 17.3% | 7.1%(+10.2)#20 | 5.8%(+11.5)#539 |
| 21. | Brookside | 17.2% | 7.1%(+10.1)#21 | 5.8%(+11.4)#547 |
| 22. | Titusville | 17.1% | 7.1%(+10.1)#22 | 5.8%(+11.4)#548 |
| 23. | Fort Dix | 16.4% | 7.1%(+9.30)#23 | 5.8%(+10.6)#618 |
| 24. | Stone Harbor Borough | 16.4% | 7.1%(+9.30)#24 | 5.8%(+10.6)#619 |
| 25. | Saddle River Borough | 16.2% | 7.1%(+9.16)#25 | 5.8%(+10.5)#640 |
| 26. | Burleigh | 15.9% | 7.1%(+8.78)#26 | 5.8%(+10.1)#676 |
| 27. | River Edge Borough | 15.9% | 7.1%(+8.77)#27 | 5.8%(+10.1)#677 |
| 28. | Sea Girt Borough | 15.8% | 7.1%(+8.71)#28 | 5.8%(+10.0)#684 |
| 29. | Princeton Junction | 15.6% | 7.1%(+8.51)#29 | 5.8%(+9.83)#715 |
| 30. | Tenafly Borough | 15.6% | 7.1%(+8.49)#30 | 5.8%(+9.81)#719 |
| 31. | Mountain Lakes Borough | 15.4% | 7.1%(+8.30)#31 | 5.8%(+9.62)#745 |
| 32. | Fairview | 15.3% | 7.1%(+8.18)#32 | 5.8%(+9.49)#774 |
| 33. | New Vernon | 15.0% | 7.1%(+7.96)#33 | 5.8%(+9.27)#796 |
| 34. | Lyons | 14.9% | 7.1%(+7.81)#34 | 5.8%(+9.13)#818 |
| 35. | Sweetwater | 14.9% | 7.1%(+7.81)#35 | 5.8%(+9.12)#819 |
| 36. | Bradley Beach Borough | 14.8% | 7.1%(+7.75)#36 | 5.8%(+9.07)#824 |
| 37. | Essex Fells Borough | 14.8% | 7.1%(+7.72)#37 | 5.8%(+9.04)#830 |
| 38. | Allenwood | 14.8% | 7.1%(+7.69)#38 | 5.8%(+9.00)#837 |
| 39. | Ho Ho Kus Borough | 14.6% | 7.1%(+7.57)#39 | 5.8%(+8.88)#853 |
| 40. | Lawrenceville | 14.6% | 7.1%(+7.51)#40 | 5.8%(+8.83)#859 |
| 41. | Leisuretowne | 14.5% | 7.1%(+7.46)#41 | 5.8%(+8.78)#868 |
| 42. | Ramsey Borough | 14.4% | 7.1%(+7.33)#42 | 5.8%(+8.64)#884 |
| 43. | Basking Ridge | 14.4% | 7.1%(+7.30)#43 | 5.8%(+8.62)#888 |
| 44. | Mount Hope | 14.2% | 7.1%(+7.16)#44 | 5.8%(+8.48)#922 |
| 45. | Netcong Borough | 14.2% | 7.1%(+7.08)#45 | 5.8%(+8.40)#934 |
| 46. | Watsessing | 14.1% | 7.1%(+7.01)#46 | 5.8%(+8.33)#944 |
| 47. | Cream Ridge | 14.1% | 7.1%(+6.99)#47 | 5.8%(+8.31)#947 |
| 48. | Roseland Borough | 14.0% | 7.1%(+6.93)#48 | 5.8%(+8.25)#952 |
| 49. | Mountain Lake | 14.0% | 7.1%(+6.88)#49 | 5.8%(+8.20)#958 |
| 50. | Fanwood Borough | 13.9% | 7.1%(+6.81)#50 | 5.8%(+8.13)#974 |
| 51. | Englewood Cliffs Borough | 13.9% | 7.1%(+6.81)#51 | 5.8%(+8.13)#975 |
| 52. | Cape May | 13.9% | 7.1%(+6.79)#52 | 5.8%(+8.10)#980 |
| 53. | Lincroft | 13.9% | 7.1%(+6.78)#53 | 5.8%(+8.10)#981 |
| 54. | Rutherford Borough | 13.8% | 7.1%(+6.69)#54 | 5.8%(+8.01)#995 |
| 55. | Pedricktown | 13.6% | 7.1%(+6.56)#55 | 5.8%(+7.87)#1,021 |
| 56. | Rumson Borough | 13.6% | 7.1%(+6.54)#56 | 5.8%(+7.86)#1,026 |
| 57. | Gillette | 13.6% | 7.1%(+6.54)#57 | 5.8%(+7.86)#1,027 |
| 58. | Rocky Hill Borough | 13.5% | 7.1%(+6.42)#58 | 5.8%(+7.74)#1,062 |
| 59. | Upper Montclair | 13.5% | 7.1%(+6.39)#59 | 5.8%(+7.71)#1,069 |
| 60. | Vista Center | 13.5% | 7.1%(+6.38)#60 | 5.8%(+7.70)#1,071 |
| 61. | Layton | 13.2% | 7.1%(+6.15)#61 | 5.8%(+7.47)#1,130 |
| 62. | Packanack Lake | 12.9% | 7.1%(+5.81)#62 | 5.8%(+7.13)#1,229 |
| 63. | Martinsville | 12.9% | 7.1%(+5.79)#63 | 5.8%(+7.11)#1,230 |
| 64. | Summit | 12.9% | 7.1%(+5.77)#64 | 5.8%(+7.09)#1,237 |
| 65. | Mickleton | 12.8% | 7.1%(+5.73)#65 | 5.8%(+7.05)#1,250 |
| 66. | Mendham Borough | 12.8% | 7.1%(+5.69)#66 | 5.8%(+7.01)#1,265 |
| 67. | Barclay | 12.6% | 7.1%(+5.50)#67 | 5.8%(+6.82)#1,306 |
| 68. | Blackwells Mills | 12.4% | 7.1%(+5.31)#68 | 5.8%(+6.63)#1,363 |
| 69. | Little Silver Borough | 12.4% | 7.1%(+5.28)#69 | 5.8%(+6.59)#1,371 |
| 70. | Finderne | 12.3% | 7.1%(+5.26)#70 | 5.8%(+6.58)#1,374 |
| 71. | Troy Hills | 12.3% | 7.1%(+5.22)#71 | 5.8%(+6.54)#1,385 |
| 72. | Towaco | 12.2% | 7.1%(+5.14)#72 | 5.8%(+6.46)#1,404 |
| 73. | The Hills | 12.2% | 7.1%(+5.12)#73 | 5.8%(+6.43)#1,415 |
| 74. | Pompton Plains | 12.2% | 7.1%(+5.11)#74 | 5.8%(+6.43)#1,420 |
| 75. | Lower Berkshire Valley | 12.1% | 7.1%(+5.00)#75 | 5.8%(+6.32)#1,463 |
| 76. | Leesburg | 12.1% | 7.1%(+4.99)#76 | 5.8%(+6.31)#1,470 |
| 77. | Heathcote | 12.0% | 7.1%(+4.97)#77 | 5.8%(+6.28)#1,479 |
| 78. | Short Hills | 12.0% | 7.1%(+4.96)#78 | 5.8%(+6.28)#1,481 |
| 79. | Leonia Borough | 11.9% | 7.1%(+4.81)#79 | 5.8%(+6.13)#1,524 |
| 80. | Monmouth Beach Borough | 11.9% | 7.1%(+4.80)#80 | 5.8%(+6.12)#1,529 |
| 81. | Rainbow Lakes | 11.8% | 7.1%(+4.76)#81 | 5.8%(+6.07)#1,546 |
| 82. | Bridgewater Center | 11.8% | 7.1%(+4.72)#82 | 5.8%(+6.03)#1,555 |
| 83. | Dover Beaches South | 11.8% | 7.1%(+4.69)#83 | 5.8%(+6.01)#1,566 |
| 84. | Peapack And Gladstone Borough | 11.6% | 7.1%(+4.52)#84 | 5.8%(+5.84)#1,643 |
| 85. | Harvey Cedars Borough | 11.6% | 7.1%(+4.50)#85 | 5.8%(+5.82)#1,652 |
| 86. | Oradell Borough | 11.6% | 7.1%(+4.48)#86 | 5.8%(+5.80)#1,663 |
| 87. | Brownville | 11.5% | 7.1%(+4.43)#87 | 5.8%(+5.75)#1,680 |
| 88. | Stewartsville | 11.5% | 7.1%(+4.41)#88 | 5.8%(+5.73)#1,687 |
| 89. | Ten Mile Run | 11.5% | 7.1%(+4.39)#89 | 5.8%(+5.71)#1,697 |
| 90. | Madison Borough | 11.5% | 7.1%(+4.38)#90 | 5.8%(+5.70)#1,701 |
| 91. | Richland | 11.4% | 7.1%(+4.28)#91 | 5.8%(+5.60)#1,743 |
| 92. | Emerson Borough | 11.3% | 7.1%(+4.27)#92 | 5.8%(+5.58)#1,752 |
| 93. | Westfield | 11.3% | 7.1%(+4.21)#93 | 5.8%(+5.52)#1,778 |
| 94. | Longport Borough | 11.3% | 7.1%(+4.19)#94 | 5.8%(+5.51)#1,779 |
| 95. | Hillsborough | 11.3% | 7.1%(+4.18)#95 | 5.8%(+5.49)#1,786 |
| 96. | Forsgate | 11.1% | 7.1%(+4.02)#96 | 5.8%(+5.34)#1,861 |
| 97. | Franklin Lakes Borough | 11.1% | 7.1%(+3.99)#97 | 5.8%(+5.31)#1,874 |
| 98. | Olivet | 11.0% | 7.1%(+3.96)#98 | 5.8%(+5.28)#1,890 |
| 99. | Pine Brook | 11.0% | 7.1%(+3.92)#99 | 5.8%(+5.24)#1,906 |
| 100. | Green Knoll | 11.0% | 7.1%(+3.87)#100 | 5.8%(+5.19)#1,930 |
Common Questions
What are the Top 10 Cities with the Highest Percentage of Population Employed in Business & Financial in New Jersey?
Top 10 Cities with the Highest Percentage of Population Employed in Business & Financial in New Jersey are:
#1
76.2%
#2
37.2%
#3
31.6%
#4
25.6%
#5
19.0%
#6
18.2%
#7
16.4%
#8
15.9%
#9
15.6%
#10
15.3%
What city has the Highest Percentage of Population Employed in Business & Financial in New Jersey?
Allamuchy has the Highest Percentage of Population Employed in Business & Financial in New Jersey with 76.2%.
What is the Percentage of Population Employed in Business & Financial in the State of New Jersey?
Percentage of Population Employed in Business & Financial in New Jersey is 7.1%.
What is the Percentage of Population Employed in Business & Financial in the United States?
Percentage of Population Employed in Business & Financial in the United States is 5.8%.