Cities with the Highest Percentage of State Government Employees in New Jersey
RELATED REPORTS & OPTIONS
State Government Employees
New Jersey
Compare Cities
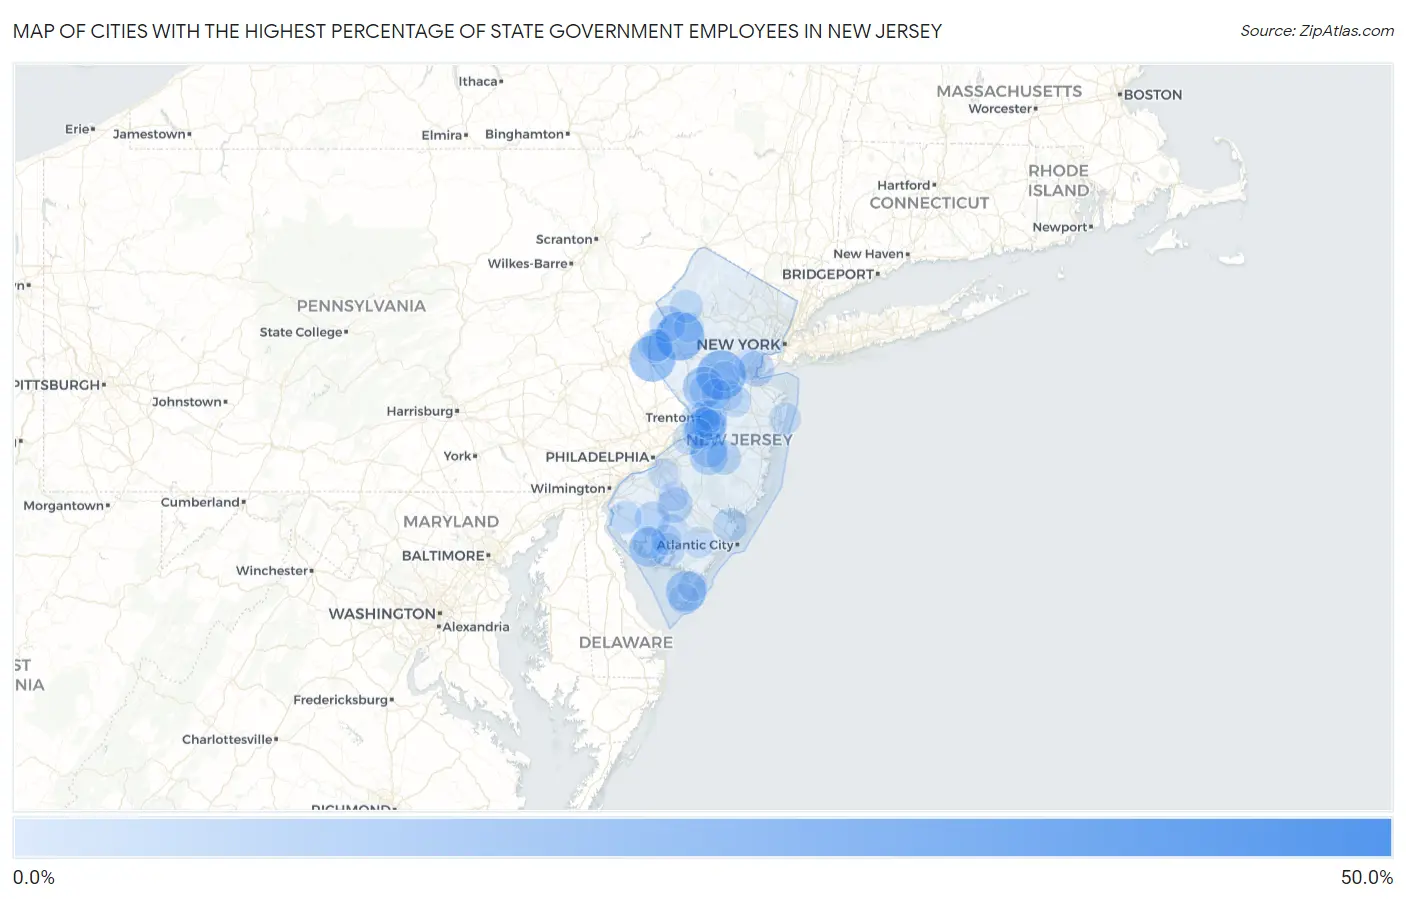
Map of Cities with the Highest Percentage of State Government Employees in New Jersey
0.0%
50.0%
Cities with the Highest Percentage of State Government Employees in New Jersey
| City | % State Government Employees | vs State | vs National | |
| 1. | Port Elizabeth | 42.6% | 4.0%(+38.7)#1 | 4.2%(+38.4)#188 |
| 2. | Leeds Point | 39.0% | 4.0%(+35.0)#2 | 4.2%(+34.7)#228 |
| 3. | Windsor | 38.5% | 4.0%(+34.5)#3 | 4.2%(+34.2)#233 |
| 4. | Dutch Neck | 37.7% | 4.0%(+33.8)#4 | 4.2%(+33.5)#242 |
| 5. | Leesburg | 35.7% | 4.0%(+31.8)#5 | 4.2%(+31.5)#278 |
| 6. | Marlboro | 29.0% | 4.0%(+25.1)#6 | 4.2%(+24.8)#469 |
| 7. | Delmont | 29.0% | 4.0%(+25.0)#7 | 4.2%(+24.7)#471 |
| 8. | Oceanville | 23.1% | 4.0%(+19.2)#8 | 4.2%(+18.9)#788 |
| 9. | East Millstone | 22.9% | 4.0%(+19.0)#9 | 4.2%(+18.7)#795 |
| 10. | Anderson | 22.1% | 4.0%(+18.2)#10 | 4.2%(+17.9)#866 |
| 11. | Stonebridge | 20.8% | 4.0%(+16.8)#11 | 4.2%(+16.5)#990 |
| 12. | Finesville | 20.1% | 4.0%(+16.2)#12 | 4.2%(+15.9)#1,056 |
| 13. | Milmay | 19.7% | 4.0%(+15.8)#13 | 4.2%(+15.5)#1,103 |
| 14. | Ramapo College Of New Jersey | 18.3% | 4.0%(+14.4)#14 | 4.2%(+14.1)#1,270 |
| 15. | Woodbine Borough | 18.3% | 4.0%(+14.3)#15 | 4.2%(+14.1)#1,273 |
| 16. | Cumberland-Hesstown | 18.2% | 4.0%(+14.2)#16 | 4.2%(+13.9)#1,291 |
| 17. | Centre Grove | 17.9% | 4.0%(+13.9)#17 | 4.2%(+13.6)#1,344 |
| 18. | The College Of New Jersey | 17.6% | 4.0%(+13.7)#18 | 4.2%(+13.4)#1,376 |
| 19. | Highland Park Borough | 17.4% | 4.0%(+13.5)#19 | 4.2%(+13.2)#1,405 |
| 20. | Vauxhall | 16.7% | 4.0%(+12.7)#20 | 4.2%(+12.4)#1,537 |
| 21. | Skillman | 16.6% | 4.0%(+12.6)#21 | 4.2%(+12.3)#1,573 |
| 22. | Silver Lake | 16.4% | 4.0%(+12.4)#22 | 4.2%(+12.1)#1,607 |
| 23. | Nesco | 16.0% | 4.0%(+12.0)#23 | 4.2%(+11.8)#1,677 |
| 24. | Stockton University | 15.9% | 4.0%(+11.9)#24 | 4.2%(+11.7)#1,699 |
| 25. | Neshanic | 15.8% | 4.0%(+11.8)#25 | 4.2%(+11.5)#1,730 |
| 26. | Whitesboro | 15.6% | 4.0%(+11.7)#26 | 4.2%(+11.4)#1,768 |
| 27. | Lower Berkshire Valley | 15.5% | 4.0%(+11.5)#27 | 4.2%(+11.2)#1,812 |
| 28. | Bordentown | 15.2% | 4.0%(+11.2)#28 | 4.2%(+10.9)#1,871 |
| 29. | William Paterson University Of New Jersey | 14.8% | 4.0%(+10.8)#29 | 4.2%(+10.5)#1,983 |
| 30. | Cedarville | 14.2% | 4.0%(+10.2)#30 | 4.2%(+9.96)#2,175 |
| 31. | Cream Ridge | 13.6% | 4.0%(+9.61)#31 | 4.2%(+9.33)#2,364 |
| 32. | Kean University | 13.5% | 4.0%(+9.55)#32 | 4.2%(+9.26)#2,386 |
| 33. | Pemberton Heights | 13.5% | 4.0%(+9.54)#33 | 4.2%(+9.26)#2,387 |
| 34. | Juliustown | 12.9% | 4.0%(+8.95)#34 | 4.2%(+8.66)#2,603 |
| 35. | Glen Gardner Borough | 12.3% | 4.0%(+8.35)#35 | 4.2%(+8.07)#2,842 |
| 36. | Arrowhead Lake | 12.3% | 4.0%(+8.33)#36 | 4.2%(+8.04)#2,857 |
| 37. | Bridgeville | 12.0% | 4.0%(+8.07)#37 | 4.2%(+7.78)#2,964 |
| 38. | Sewaren | 11.7% | 4.0%(+7.78)#38 | 4.2%(+7.49)#3,110 |
| 39. | Heislerville | 11.6% | 4.0%(+7.64)#39 | 4.2%(+7.35)#3,174 |
| 40. | Connecticut Farms | 11.4% | 4.0%(+7.40)#40 | 4.2%(+7.11)#3,293 |
| 41. | Victory Lakes | 11.3% | 4.0%(+7.39)#41 | 4.2%(+7.10)#3,298 |
| 42. | Wenonah Borough | 11.1% | 4.0%(+7.14)#42 | 4.2%(+6.85)#3,465 |
| 43. | Dividing Creek | 11.0% | 4.0%(+7.01)#43 | 4.2%(+6.73)#3,522 |
| 44. | Olivet | 10.8% | 4.0%(+6.88)#44 | 4.2%(+6.60)#3,603 |
| 45. | Folsom Borough | 10.8% | 4.0%(+6.80)#45 | 4.2%(+6.51)#3,648 |
| 46. | Country Lake Estates | 10.7% | 4.0%(+6.75)#46 | 4.2%(+6.46)#3,677 |
| 47. | Yardville | 10.4% | 4.0%(+6.49)#47 | 4.2%(+6.20)#3,822 |
| 48. | Smithville | 10.1% | 4.0%(+6.16)#48 | 4.2%(+5.87)#4,031 |
| 49. | Blawenburg | 10.1% | 4.0%(+6.15)#49 | 4.2%(+5.86)#4,040 |
| 50. | Lopatcong Overlook | 10.0% | 4.0%(+6.02)#50 | 4.2%(+5.73)#4,117 |
| 51. | Laurel Lake | 9.9% | 4.0%(+5.98)#51 | 4.2%(+5.70)#4,145 |
| 52. | Quinton | 9.5% | 4.0%(+5.55)#52 | 4.2%(+5.26)#4,449 |
| 53. | Johnsonburg | 9.5% | 4.0%(+5.55)#53 | 4.2%(+5.26)#4,456 |
| 54. | Fairton | 9.4% | 4.0%(+5.45)#54 | 4.2%(+5.16)#4,506 |
| 55. | Palermo | 9.3% | 4.0%(+5.38)#55 | 4.2%(+5.09)#4,576 |
| 56. | Upper Stewartsville | 9.2% | 4.0%(+5.20)#56 | 4.2%(+4.91)#4,699 |
| 57. | Trenton | 9.1% | 4.0%(+5.11)#57 | 4.2%(+4.83)#4,770 |
| 58. | Roselle Borough | 9.1% | 4.0%(+5.10)#58 | 4.2%(+4.81)#4,774 |
| 59. | Gouldtown | 9.0% | 4.0%(+5.01)#59 | 4.2%(+4.73)#4,830 |
| 60. | Burlington | 8.7% | 4.0%(+4.76)#60 | 4.2%(+4.48)#5,028 |
| 61. | Newfield Borough | 8.6% | 4.0%(+4.66)#61 | 4.2%(+4.37)#5,127 |
| 62. | Ampere North | 8.6% | 4.0%(+4.63)#62 | 4.2%(+4.34)#5,151 |
| 63. | Whittingham | 8.6% | 4.0%(+4.62)#63 | 4.2%(+4.34)#5,153 |
| 64. | Ocean Grove | 8.5% | 4.0%(+4.55)#64 | 4.2%(+4.26)#5,227 |
| 65. | Crosswicks | 8.5% | 4.0%(+4.51)#65 | 4.2%(+4.23)#5,267 |
| 66. | Mount Royal | 8.4% | 4.0%(+4.41)#66 | 4.2%(+4.12)#5,356 |
| 67. | Hamilton Square | 8.3% | 4.0%(+4.38)#67 | 4.2%(+4.10)#5,376 |
| 68. | Allentown Borough | 8.1% | 4.0%(+4.15)#68 | 4.2%(+3.86)#5,619 |
| 69. | Cookstown | 8.1% | 4.0%(+4.14)#69 | 4.2%(+3.85)#5,625 |
| 70. | Sweetwater | 8.1% | 4.0%(+4.14)#70 | 4.2%(+3.85)#5,627 |
| 71. | Estell Manor | 8.1% | 4.0%(+4.12)#71 | 4.2%(+3.83)#5,635 |
| 72. | Mercerville | 8.0% | 4.0%(+4.01)#72 | 4.2%(+3.72)#5,740 |
| 73. | Carlls Corner | 7.9% | 4.0%(+3.99)#73 | 4.2%(+3.70)#5,771 |
| 74. | Groveville | 7.9% | 4.0%(+3.99)#74 | 4.2%(+3.70)#5,777 |
| 75. | Dayton | 7.8% | 4.0%(+3.89)#75 | 4.2%(+3.61)#5,873 |
| 76. | Milltown Borough | 7.8% | 4.0%(+3.81)#76 | 4.2%(+3.52)#5,966 |
| 77. | Glendora | 7.7% | 4.0%(+3.77)#77 | 4.2%(+3.48)#6,008 |
| 78. | Three Bridges | 7.7% | 4.0%(+3.71)#78 | 4.2%(+3.42)#6,076 |
| 79. | Pennington Borough | 7.6% | 4.0%(+3.67)#79 | 4.2%(+3.38)#6,117 |
| 80. | Glassboro Borough | 7.6% | 4.0%(+3.63)#80 | 4.2%(+3.34)#6,161 |
| 81. | White Horse | 7.5% | 4.0%(+3.59)#81 | 4.2%(+3.30)#6,198 |
| 82. | Iselin | 7.5% | 4.0%(+3.59)#82 | 4.2%(+3.30)#6,206 |
| 83. | Marshallville | 7.5% | 4.0%(+3.56)#83 | 4.2%(+3.28)#6,240 |
| 84. | Erma | 7.5% | 4.0%(+3.53)#84 | 4.2%(+3.25)#6,272 |
| 85. | Millville | 7.5% | 4.0%(+3.50)#85 | 4.2%(+3.21)#6,308 |
| 86. | Keasbey | 7.4% | 4.0%(+3.47)#86 | 4.2%(+3.18)#6,340 |
| 87. | Bargaintown | 7.4% | 4.0%(+3.45)#87 | 4.2%(+3.16)#6,368 |
| 88. | Mickleton | 7.3% | 4.0%(+3.36)#88 | 4.2%(+3.08)#6,448 |
| 89. | Carteret Borough | 7.3% | 4.0%(+3.31)#89 | 4.2%(+3.03)#6,515 |
| 90. | Middlebush | 7.2% | 4.0%(+3.26)#90 | 4.2%(+2.97)#6,583 |
| 91. | Kingston | 7.1% | 4.0%(+3.18)#91 | 4.2%(+2.89)#6,673 |
| 92. | Williamstown | 7.1% | 4.0%(+3.16)#92 | 4.2%(+2.88)#6,685 |
| 93. | Roebling | 7.1% | 4.0%(+3.13)#93 | 4.2%(+2.84)#6,733 |
| 94. | Dorothy | 7.0% | 4.0%(+3.09)#94 | 4.2%(+2.81)#6,764 |
| 95. | Beattystown | 7.0% | 4.0%(+3.09)#95 | 4.2%(+2.81)#6,765 |
| 96. | Cape May Court House | 7.0% | 4.0%(+3.05)#96 | 4.2%(+2.76)#6,818 |
| 97. | Metuchen Borough | 7.0% | 4.0%(+3.03)#97 | 4.2%(+2.75)#6,835 |
| 98. | Vineland | 7.0% | 4.0%(+3.03)#98 | 4.2%(+2.74)#6,841 |
| 99. | Woodstown Borough | 6.9% | 4.0%(+2.96)#99 | 4.2%(+2.67)#6,922 |
| 100. | Harvey Cedars Borough | 6.8% | 4.0%(+2.89)#100 | 4.2%(+2.60)#7,013 |
Common Questions
What are the Top 10 Cities with the Highest Percentage of State Government Employees in New Jersey?
Top 10 Cities with the Highest Percentage of State Government Employees in New Jersey are:
#1
22.9%
#2
22.1%
#3
20.1%
#4
16.6%
#5
15.6%
#6
15.2%
#7
14.2%
#8
13.5%
#9
12.9%
#10
12.0%
What city has the Highest Percentage of State Government Employees in New Jersey?
East Millstone has the Highest Percentage of State Government Employees in New Jersey with 22.9%.
What is the Percentage of State Government Employees in the State of New Jersey?
Percentage of State Government Employees in New Jersey is 4.0%.
What is the Percentage of State Government Employees in the United States?
Percentage of State Government Employees in the United States is 4.2%.