Cities with the Most Immigrants from Moldova in New Jersey
RELATED REPORTS & OPTIONS
Moldova
New Jersey
Compare Cities
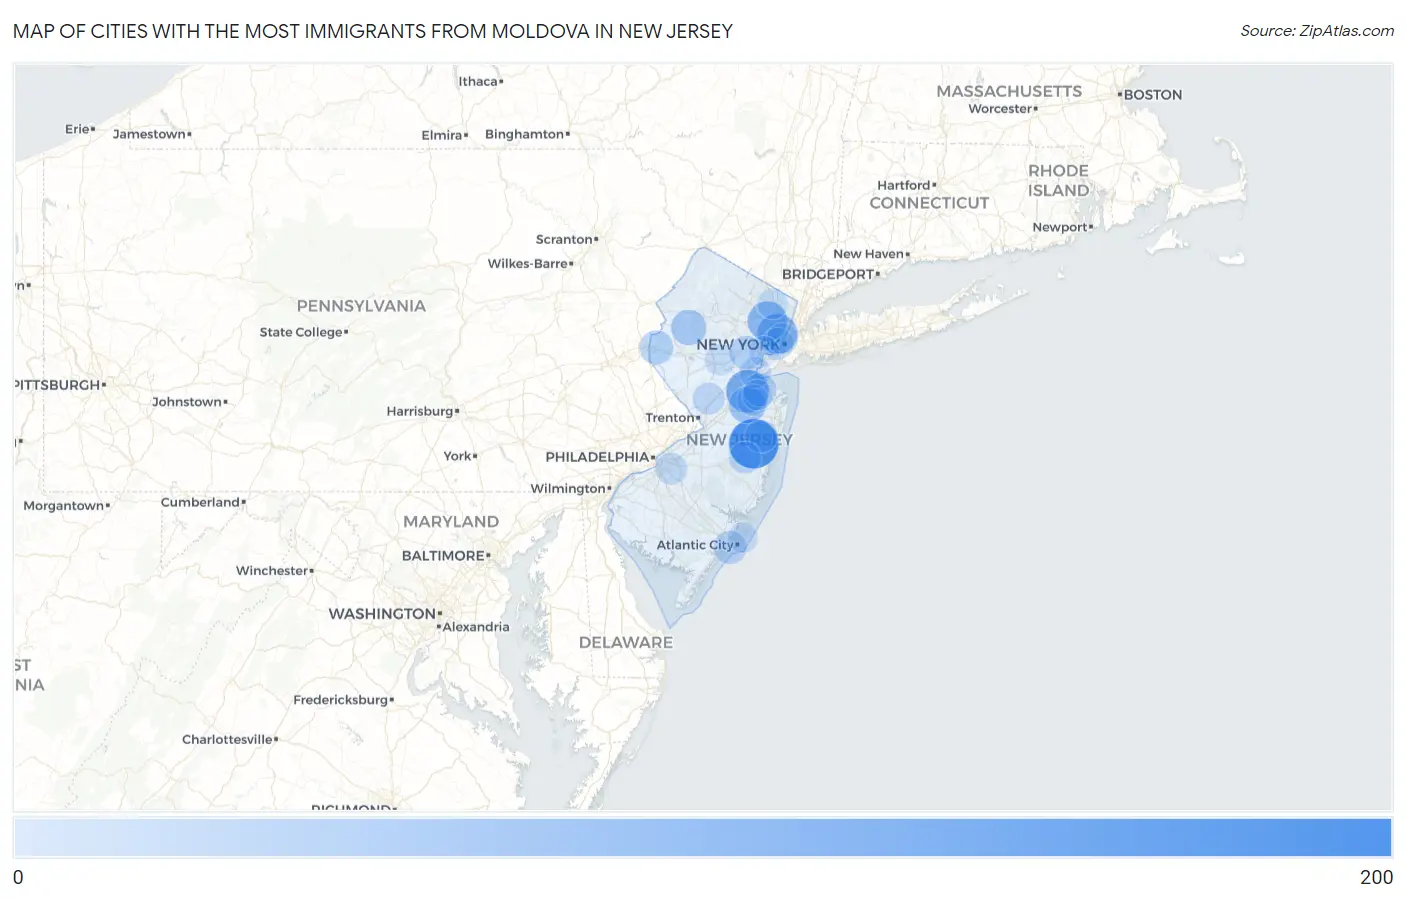
Map of Cities with the Most Immigrants from Moldova in New Jersey
0
200
Cities with the Most Immigrants from Moldova in New Jersey
| City | Moldova | vs State | vs National | |
| 1. | Cedar Glen West | 185 | 2,316(7.99%)#1 | 53,673(0.34%)#52 |
| 2. | Edgewater Borough | 144 | 2,316(6.22%)#2 | 53,673(0.27%)#65 |
| 3. | Old Bridge | 119 | 2,316(5.14%)#3 | 53,673(0.22%)#82 |
| 4. | Secaucus | 93 | 2,316(4.02%)#4 | 53,673(0.17%)#104 |
| 5. | Clifton | 90 | 2,316(3.89%)#5 | 53,673(0.17%)#109 |
| 6. | Paramus Borough | 90 | 2,316(3.89%)#6 | 53,673(0.17%)#110 |
| 7. | Yorketown | 62 | 2,316(2.68%)#7 | 53,673(0.12%)#165 |
| 8. | West Berlin | 58 | 2,316(2.50%)#8 | 53,673(0.11%)#179 |
| 9. | Cliffside Park Borough | 53 | 2,316(2.29%)#9 | 53,673(0.10%)#191 |
| 10. | Beattystown | 49 | 2,316(2.12%)#10 | 53,673(0.09%)#202 |
| 11. | Fair Lawn Borough | 44 | 2,316(1.90%)#11 | 53,673(0.08%)#225 |
| 12. | Fort Lee Borough | 38 | 2,316(1.64%)#12 | 53,673(0.07%)#254 |
| 13. | Greenwich | 35 | 2,316(1.51%)#13 | 53,673(0.07%)#268 |
| 14. | Franklinville | 34 | 2,316(1.47%)#14 | 53,673(0.06%)#274 |
| 15. | Westfield | 31 | 2,316(1.34%)#15 | 53,673(0.06%)#293 |
| 16. | Ventnor City | 28 | 2,316(1.21%)#16 | 53,673(0.05%)#321 |
| 17. | Metuchen Borough | 27 | 2,316(1.17%)#17 | 53,673(0.05%)#327 |
| 18. | Strathmore | 27 | 2,316(1.17%)#18 | 53,673(0.05%)#328 |
| 19. | Kinnelon Borough | 26 | 2,316(1.12%)#19 | 53,673(0.05%)#336 |
| 20. | Lakewood | 23 | 2,316(0.99%)#20 | 53,673(0.04%)#364 |
| 21. | Tenafly Borough | 23 | 2,316(0.99%)#21 | 53,673(0.04%)#371 |
| 22. | Morris Plains Borough | 22 | 2,316(0.95%)#22 | 53,673(0.04%)#383 |
| 23. | Sayreville Borough | 20 | 2,316(0.86%)#23 | 53,673(0.04%)#399 |
| 24. | Princeton | 19 | 2,316(0.82%)#24 | 53,673(0.04%)#407 |
| 25. | Crestwood Village | 17 | 2,316(0.73%)#25 | 53,673(0.03%)#439 |
| 26. | North Caldwell Borough | 17 | 2,316(0.73%)#26 | 53,673(0.03%)#441 |
| 27. | Ashland | 16 | 2,316(0.69%)#27 | 53,673(0.03%)#456 |
| 28. | Jersey City | 15 | 2,316(0.65%)#28 | 53,673(0.03%)#462 |
| 29. | Perth Amboy | 13 | 2,316(0.56%)#29 | 53,673(0.02%)#518 |
| 30. | Preakness | 13 | 2,316(0.56%)#30 | 53,673(0.02%)#525 |
| 31. | Wanaque Borough | 12 | 2,316(0.52%)#31 | 53,673(0.02%)#553 |
| 32. | Lake Hopatcong | 12 | 2,316(0.52%)#32 | 53,673(0.02%)#554 |
| 33. | Robertsville | 11 | 2,316(0.47%)#33 | 53,673(0.02%)#577 |
| 34. | Mountain Lakes Borough | 10 | 2,316(0.43%)#34 | 53,673(0.02%)#616 |
| 35. | The Hills | 9 | 2,316(0.39%)#35 | 53,673(0.02%)#640 |
| 36. | Hillsdale Borough | 9 | 2,316(0.39%)#36 | 53,673(0.02%)#641 |
| 37. | Hoboken | 8 | 2,316(0.35%)#37 | 53,673(0.01%)#658 |
| 38. | Ridgewood | 8 | 2,316(0.35%)#38 | 53,673(0.01%)#666 |
| 39. | Martinsville | 8 | 2,316(0.35%)#39 | 53,673(0.01%)#672 |
| 40. | Hasbrouck Heights Borough | 8 | 2,316(0.35%)#40 | 53,673(0.01%)#673 |
| 41. | Helmetta Borough | 8 | 2,316(0.35%)#41 | 53,673(0.01%)#680 |
| 42. | Parsippany | 6 | 2,316(0.26%)#42 | 53,673(0.01%)#708 |
| 43. | Runnemede Borough | 6 | 2,316(0.26%)#43 | 53,673(0.01%)#711 |
| 44. | Brigantine | 4 | 2,316(0.17%)#44 | 53,673(0.01%)#743 |
| 45. | Morganville | 4 | 2,316(0.17%)#45 | 53,673(0.01%)#745 |
| 46. | Pennington Borough | 3 | 2,316(0.13%)#46 | 53,673(0.01%)#755 |
| 47. | Elizabeth | 2 | 2,316(0.09%)#47 | 53,673(0.00%)#757 |
Common Questions
What are the Top 10 Cities with the Most Immigrants from Moldova in New Jersey?
Top 10 Cities with the Most Immigrants from Moldova in New Jersey are:
#1
185
#2
119
#3
93
#4
90
#5
62
#6
49
#7
35
#8
31
#9
28
#10
27
What city has the Most Immigrants from Moldova in New Jersey?
Cedar Glen West has the Most Immigrants from Moldova in New Jersey with 185.
What is the Total Immigrants from Moldova in the State of New Jersey?
Total Immigrants from Moldova in New Jersey is 2,316.
What is the Total Immigrants from Moldova in the United States?
Total Immigrants from Moldova in the United States is 53,673.