Cities with the Highest Percentage of Canadian Population in New Jersey
RELATED REPORTS & OPTIONS
Canadian
New Jersey
Compare Cities
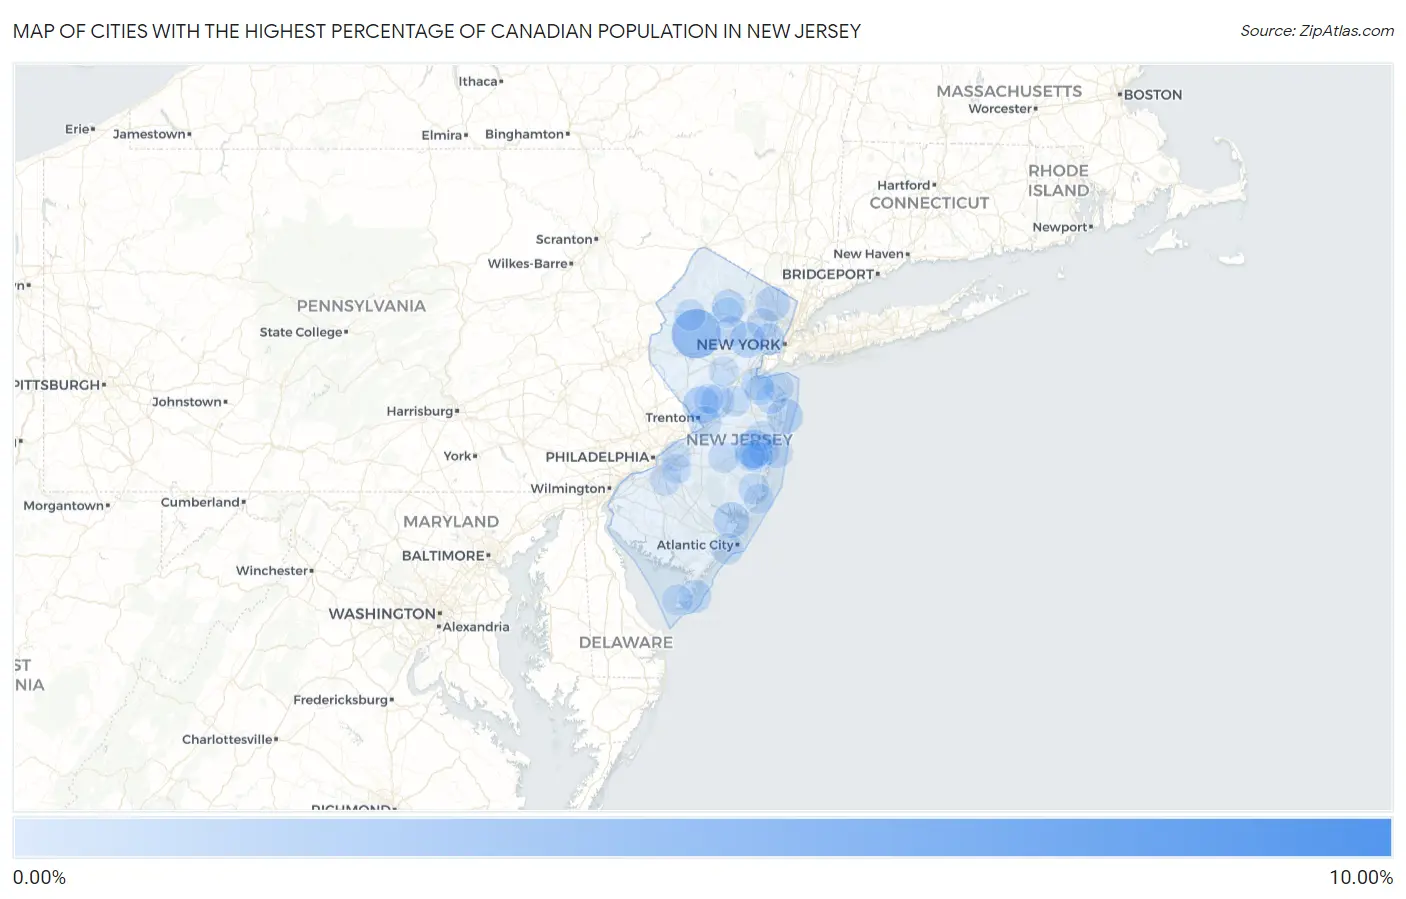
Map of Cities with the Highest Percentage of Canadian Population in New Jersey
0.00%
10.00%
Cities with the Highest Percentage of Canadian Population in New Jersey
| City | Canadian | vs State | vs National | |
| 1. | Washington Crossing | 9.07% | 0.12%(+8.95)#1 | 0.18%(+8.89)#46 |
| 2. | Long Valley | 3.81% | 0.12%(+3.69)#2 | 0.18%(+3.63)#155 |
| 3. | Cream Ridge | 3.62% | 0.12%(+3.50)#3 | 0.18%(+3.44)#166 |
| 4. | Layton | 3.01% | 0.12%(+2.88)#4 | 0.18%(+2.83)#234 |
| 5. | Fair Haven Borough | 2.31% | 0.12%(+2.19)#5 | 0.18%(+2.14)#325 |
| 6. | Oceanville | 2.30% | 0.12%(+2.18)#6 | 0.18%(+2.12)#328 |
| 7. | Auburn | 2.16% | 0.12%(+2.04)#7 | 0.18%(+1.98)#363 |
| 8. | Malaga | 1.91% | 0.12%(+1.79)#8 | 0.18%(+1.73)#438 |
| 9. | Leisure Village West | 1.76% | 0.12%(+1.63)#9 | 0.18%(+1.58)#491 |
| 10. | Lower Berkshire Valley | 1.70% | 0.12%(+1.58)#10 | 0.18%(+1.52)#513 |
| 11. | Lawrenceville | 1.54% | 0.12%(+1.42)#11 | 0.18%(+1.36)#591 |
| 12. | Allentown Borough | 1.43% | 0.12%(+1.31)#12 | 0.18%(+1.25)#653 |
| 13. | Loch Arbour | 1.36% | 0.12%(+1.24)#13 | 0.18%(+1.19)#698 |
| 14. | Port Republic | 1.33% | 0.12%(+1.20)#14 | 0.18%(+1.15)#729 |
| 15. | Vincentown | 1.29% | 0.12%(+1.16)#15 | 0.18%(+1.11)#757 |
| 16. | West Berlin | 1.29% | 0.12%(+1.16)#16 | 0.18%(+1.11)#758 |
| 17. | Califon Borough | 1.28% | 0.12%(+1.16)#17 | 0.18%(+1.10)#765 |
| 18. | Short Hills | 1.26% | 0.12%(+1.14)#18 | 0.18%(+1.08)#781 |
| 19. | West Cape May Borough | 1.19% | 0.12%(+1.06)#19 | 0.18%(+1.01)#846 |
| 20. | Cookstown | 1.15% | 0.12%(+1.03)#20 | 0.18%(+0.971)#882 |
| 21. | Ridgewood | 1.14% | 0.12%(+1.02)#21 | 0.18%(+0.966)#889 |
| 22. | Mountain Lakes Borough | 1.02% | 0.12%(+0.901)#22 | 0.18%(+0.844)#998 |
| 23. | Buena Borough | 1.02% | 0.12%(+0.900)#23 | 0.18%(+0.843)#1,000 |
| 24. | Rocky Hill Borough | 1.01% | 0.12%(+0.886)#24 | 0.18%(+0.829)#1,015 |
| 25. | Lyons | 0.98% | 0.12%(+0.863)#25 | 0.18%(+0.807)#1,041 |
| 26. | Plainsboro Center | 0.94% | 0.12%(+0.818)#26 | 0.18%(+0.762)#1,091 |
| 27. | Lake Telemark | 0.92% | 0.12%(+0.801)#27 | 0.18%(+0.744)#1,116 |
| 28. | Point Pleasant Beach Borough | 0.88% | 0.12%(+0.756)#28 | 0.18%(+0.699)#1,191 |
| 29. | Rockaway Borough | 0.83% | 0.12%(+0.713)#29 | 0.18%(+0.656)#1,264 |
| 30. | Neshanic Station | 0.83% | 0.12%(+0.706)#30 | 0.18%(+0.649)#1,280 |
| 31. | North Wildwood | 0.82% | 0.12%(+0.703)#31 | 0.18%(+0.646)#1,282 |
| 32. | White Horse | 0.77% | 0.12%(+0.652)#32 | 0.18%(+0.595)#1,389 |
| 33. | Spring Lake Borough | 0.75% | 0.12%(+0.631)#33 | 0.18%(+0.575)#1,443 |
| 34. | Stratford Borough | 0.75% | 0.12%(+0.625)#34 | 0.18%(+0.569)#1,457 |
| 35. | Midland Park Borough | 0.68% | 0.12%(+0.562)#35 | 0.18%(+0.505)#1,624 |
| 36. | Norwood Borough | 0.67% | 0.12%(+0.550)#36 | 0.18%(+0.493)#1,651 |
| 37. | Laurence Harbor | 0.67% | 0.12%(+0.548)#37 | 0.18%(+0.492)#1,653 |
| 38. | Chatham Borough | 0.65% | 0.12%(+0.530)#38 | 0.18%(+0.474)#1,702 |
| 39. | Bernardsville Borough | 0.65% | 0.12%(+0.525)#39 | 0.18%(+0.468)#1,716 |
| 40. | Cedar Knolls | 0.65% | 0.12%(+0.524)#40 | 0.18%(+0.467)#1,719 |
| 41. | Watchung Borough | 0.61% | 0.12%(+0.486)#41 | 0.18%(+0.429)#1,822 |
| 42. | Lake Como Borough | 0.58% | 0.12%(+0.463)#42 | 0.18%(+0.406)#1,882 |
| 43. | Toms River | 0.58% | 0.12%(+0.462)#43 | 0.18%(+0.405)#1,888 |
| 44. | Panther Valley | 0.53% | 0.12%(+0.404)#44 | 0.18%(+0.348)#2,101 |
| 45. | Margate City | 0.53% | 0.12%(+0.403)#45 | 0.18%(+0.347)#2,105 |
| 46. | Ho Ho Kus Borough | 0.52% | 0.12%(+0.398)#46 | 0.18%(+0.341)#2,127 |
| 47. | Caldwell Borough | 0.52% | 0.12%(+0.395)#47 | 0.18%(+0.339)#2,141 |
| 48. | Ocean Acres | 0.49% | 0.12%(+0.372)#48 | 0.18%(+0.315)#2,248 |
| 49. | Upper Montclair | 0.49% | 0.12%(+0.369)#49 | 0.18%(+0.312)#2,261 |
| 50. | Hasbrouck Heights Borough | 0.48% | 0.12%(+0.358)#50 | 0.18%(+0.302)#2,292 |
| 51. | Blackwood | 0.48% | 0.12%(+0.358)#51 | 0.18%(+0.301)#2,296 |
| 52. | Centre Grove | 0.48% | 0.12%(+0.358)#52 | 0.18%(+0.301)#2,297 |
| 53. | Hillsborough | 0.46% | 0.12%(+0.336)#53 | 0.18%(+0.279)#2,396 |
| 54. | Manasquan Borough | 0.46% | 0.12%(+0.334)#54 | 0.18%(+0.278)#2,403 |
| 55. | Country Lake Estates | 0.45% | 0.12%(+0.333)#55 | 0.18%(+0.276)#2,411 |
| 56. | Holiday City South | 0.45% | 0.12%(+0.332)#56 | 0.18%(+0.275)#2,420 |
| 57. | Harrison | 0.45% | 0.12%(+0.331)#57 | 0.18%(+0.274)#2,423 |
| 58. | Ogdensburg Borough | 0.45% | 0.12%(+0.330)#58 | 0.18%(+0.273)#2,430 |
| 59. | North Cape May | 0.44% | 0.12%(+0.322)#59 | 0.18%(+0.265)#2,472 |
| 60. | Riverdale Borough | 0.44% | 0.12%(+0.319)#60 | 0.18%(+0.263)#2,490 |
| 61. | Oradell Borough | 0.44% | 0.12%(+0.317)#61 | 0.18%(+0.260)#2,501 |
| 62. | Hopewell Borough | 0.44% | 0.12%(+0.317)#62 | 0.18%(+0.260)#2,504 |
| 63. | Stockton University | 0.42% | 0.12%(+0.302)#63 | 0.18%(+0.245)#2,579 |
| 64. | Stockton Borough | 0.42% | 0.12%(+0.299)#64 | 0.18%(+0.243)#2,594 |
| 65. | Washington Borough | 0.41% | 0.12%(+0.293)#65 | 0.18%(+0.236)#2,633 |
| 66. | Dover Beaches North | 0.41% | 0.12%(+0.291)#66 | 0.18%(+0.234)#2,646 |
| 67. | Morristown | 0.40% | 0.12%(+0.281)#67 | 0.18%(+0.224)#2,695 |
| 68. | Lakewood | 0.39% | 0.12%(+0.266)#68 | 0.18%(+0.210)#2,795 |
| 69. | Brielle Borough | 0.38% | 0.12%(+0.262)#69 | 0.18%(+0.205)#2,816 |
| 70. | Lake Hiawatha | 0.38% | 0.12%(+0.256)#70 | 0.18%(+0.199)#2,855 |
| 71. | Farmingdale Borough | 0.38% | 0.12%(+0.255)#71 | 0.18%(+0.199)#2,860 |
| 72. | Whittingham | 0.37% | 0.12%(+0.250)#72 | 0.18%(+0.193)#2,907 |
| 73. | Highlands Borough | 0.34% | 0.12%(+0.223)#73 | 0.18%(+0.166)#3,081 |
| 74. | Millington | 0.34% | 0.12%(+0.218)#74 | 0.18%(+0.162)#3,118 |
| 75. | Elmwood Park Borough | 0.34% | 0.12%(+0.217)#75 | 0.18%(+0.160)#3,130 |
| 76. | Pine Ridge At Crestwood | 0.34% | 0.12%(+0.215)#76 | 0.18%(+0.158)#3,148 |
| 77. | Leonia Borough | 0.33% | 0.12%(+0.213)#77 | 0.18%(+0.156)#3,166 |
| 78. | Lincroft | 0.32% | 0.12%(+0.202)#78 | 0.18%(+0.145)#3,245 |
| 79. | Franklin Center | 0.32% | 0.12%(+0.201)#79 | 0.18%(+0.144)#3,254 |
| 80. | Basking Ridge | 0.32% | 0.12%(+0.194)#80 | 0.18%(+0.138)#3,296 |
| 81. | Florham Park Borough | 0.30% | 0.12%(+0.183)#81 | 0.18%(+0.127)#3,387 |
| 82. | Beach Haven West | 0.30% | 0.12%(+0.183)#82 | 0.18%(+0.126)#3,390 |
| 83. | Helmetta Borough | 0.30% | 0.12%(+0.182)#83 | 0.18%(+0.126)#3,398 |
| 84. | Leonardo | 0.30% | 0.12%(+0.178)#84 | 0.18%(+0.121)#3,437 |
| 85. | Morris Plains Borough | 0.29% | 0.12%(+0.173)#85 | 0.18%(+0.117)#3,476 |
| 86. | White Meadow Lake | 0.29% | 0.12%(+0.171)#86 | 0.18%(+0.114)#3,492 |
| 87. | Bogota Borough | 0.29% | 0.12%(+0.169)#87 | 0.18%(+0.112)#3,512 |
| 88. | Shrewsbury Borough | 0.29% | 0.12%(+0.168)#88 | 0.18%(+0.112)#3,522 |
| 89. | Strathmore | 0.29% | 0.12%(+0.168)#89 | 0.18%(+0.111)#3,525 |
| 90. | Moorestown Lenola | 0.29% | 0.12%(+0.163)#90 | 0.18%(+0.107)#3,566 |
| 91. | Holiday City Berkeley | 0.28% | 0.12%(+0.163)#91 | 0.18%(+0.106)#3,569 |
| 92. | Princeton | 0.28% | 0.12%(+0.161)#92 | 0.18%(+0.104)#3,588 |
| 93. | High Bridge Borough | 0.28% | 0.12%(+0.159)#93 | 0.18%(+0.102)#3,611 |
| 94. | Closter Borough | 0.28% | 0.12%(+0.159)#94 | 0.18%(+0.102)#3,612 |
| 95. | Fair Lawn Borough | 0.28% | 0.12%(+0.159)#95 | 0.18%(+0.102)#3,613 |
| 96. | Hillsdale Borough | 0.28% | 0.12%(+0.155)#96 | 0.18%(+0.098)#3,640 |
| 97. | Springdale | 0.28% | 0.12%(+0.154)#97 | 0.18%(+0.097)#3,655 |
| 98. | Hamburg Borough | 0.27% | 0.12%(+0.153)#98 | 0.18%(+0.097)#3,660 |
| 99. | Park Ridge Borough | 0.27% | 0.12%(+0.153)#99 | 0.18%(+0.096)#3,662 |
| 100. | Roseland Borough | 0.27% | 0.12%(+0.151)#100 | 0.18%(+0.095)#3,682 |
Common Questions
What are the Top 10 Cities with the Highest Percentage of Canadian Population in New Jersey?
Top 10 Cities with the Highest Percentage of Canadian Population in New Jersey are:
#1
3.81%
#2
1.76%
#3
1.54%
#4
1.36%
#5
1.33%
#6
1.26%
#7
1.14%
#8
0.94%
#9
0.92%
#10
0.82%
What city has the Highest Percentage of Canadian Population in New Jersey?
Long Valley has the Highest Percentage of Canadian Population in New Jersey with 3.81%.
What is the Percentage of Canadian Population in the State of New Jersey?
Percentage of Canadian Population in New Jersey is 0.12%.
What is the Percentage of Canadian Population in the United States?
Percentage of Canadian Population in the United States is 0.18%.