Cities with the Largest Mexican Community in New Jersey
RELATED REPORTS & OPTIONS
Mexican
New Jersey
Compare Cities
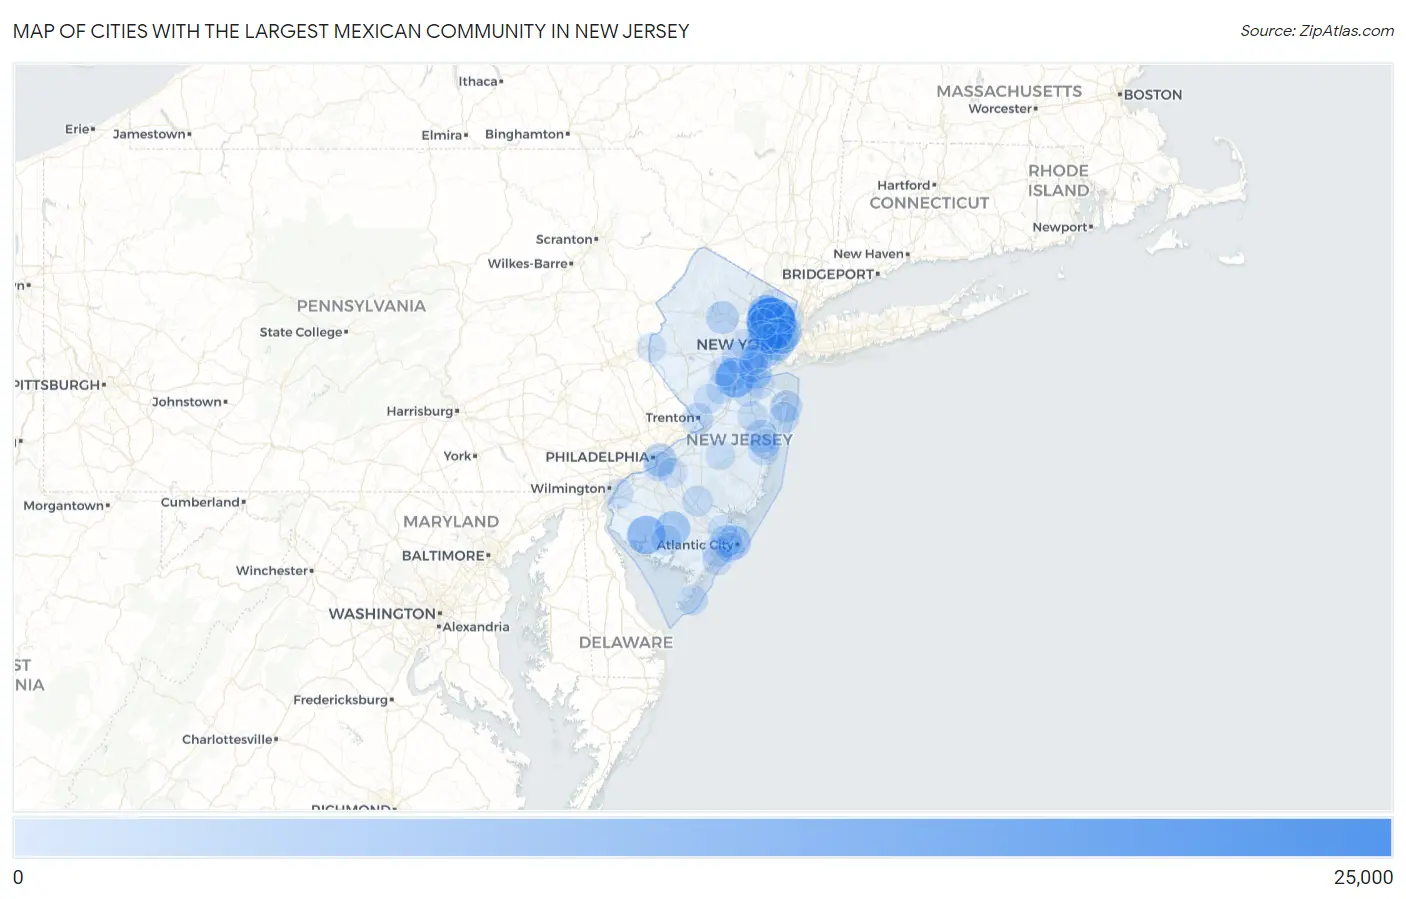
Map of Cities with the Largest Mexican Community in New Jersey
0
25,000
Cities with the Largest Mexican Community in New Jersey
| City | Mexican | vs State | vs National | |
| 1. | Passaic | 21,425 | 225,832(9.49%)#1 | 37,145,956(0.06%)#260 |
| 2. | New Brunswick | 10,693 | 225,832(4.73%)#2 | 37,145,956(0.03%)#496 |
| 3. | Bridgeton | 9,074 | 225,832(4.02%)#3 | 37,145,956(0.02%)#563 |
| 4. | Paterson | 7,950 | 225,832(3.52%)#4 | 37,145,956(0.02%)#642 |
| 5. | Vineland | 5,657 | 225,832(2.50%)#5 | 37,145,956(0.02%)#840 |
| 6. | Clifton | 5,204 | 225,832(2.30%)#6 | 37,145,956(0.01%)#898 |
| 7. | Newark | 4,742 | 225,832(2.10%)#7 | 37,145,956(0.01%)#968 |
| 8. | Elizabeth | 4,666 | 225,832(2.07%)#8 | 37,145,956(0.01%)#978 |
| 9. | Union City | 4,637 | 225,832(2.05%)#9 | 37,145,956(0.01%)#983 |
| 10. | Atlantic City | 4,633 | 225,832(2.05%)#10 | 37,145,956(0.01%)#985 |
| 11. | Jersey City | 4,471 | 225,832(1.98%)#11 | 37,145,956(0.01%)#1,006 |
| 12. | West New York | 4,252 | 225,832(1.88%)#12 | 37,145,956(0.01%)#1,040 |
| 13. | Perth Amboy | 3,950 | 225,832(1.75%)#13 | 37,145,956(0.01%)#1,095 |
| 14. | Freehold Borough | 3,676 | 225,832(1.63%)#14 | 37,145,956(0.01%)#1,161 |
| 15. | Camden | 3,644 | 225,832(1.61%)#15 | 37,145,956(0.01%)#1,165 |
| 16. | Lakewood | 3,279 | 225,832(1.45%)#16 | 37,145,956(0.01%)#1,280 |
| 17. | Dover | 3,214 | 225,832(1.42%)#17 | 37,145,956(0.01%)#1,307 |
| 18. | Pleasantville | 2,407 | 225,832(1.07%)#18 | 37,145,956(0.01%)#1,577 |
| 19. | Long Branch | 2,400 | 225,832(1.06%)#19 | 37,145,956(0.01%)#1,578 |
| 20. | Red Bank Borough | 2,225 | 225,832(0.99%)#20 | 37,145,956(0.01%)#1,689 |
| 21. | Plainfield | 2,003 | 225,832(0.89%)#21 | 37,145,956(0.01%)#1,816 |
| 22. | Trenton | 1,991 | 225,832(0.88%)#22 | 37,145,956(0.01%)#1,825 |
| 23. | Bayonne | 1,546 | 225,832(0.68%)#23 | 37,145,956(0.00%)#2,145 |
| 24. | Toms River | 1,507 | 225,832(0.67%)#24 | 37,145,956(0.00%)#2,185 |
| 25. | Asbury Park | 1,430 | 225,832(0.63%)#25 | 37,145,956(0.00%)#2,258 |
| 26. | Lindenwold Borough | 1,363 | 225,832(0.60%)#26 | 37,145,956(0.00%)#2,326 |
| 27. | Garfield | 1,312 | 225,832(0.58%)#27 | 37,145,956(0.00%)#2,375 |
| 28. | South River Borough | 1,182 | 225,832(0.52%)#28 | 37,145,956(0.00%)#2,532 |
| 29. | Linden | 1,143 | 225,832(0.51%)#29 | 37,145,956(0.00%)#2,593 |
| 30. | East Franklin | 1,143 | 225,832(0.51%)#30 | 37,145,956(0.00%)#2,594 |
| 31. | Kearny | 1,134 | 225,832(0.50%)#31 | 37,145,956(0.00%)#2,604 |
| 32. | Hammonton | 1,074 | 225,832(0.48%)#32 | 37,145,956(0.00%)#2,714 |
| 33. | Bound Brook Borough | 1,046 | 225,832(0.46%)#33 | 37,145,956(0.00%)#2,760 |
| 34. | Somers Point | 1,028 | 225,832(0.46%)#34 | 37,145,956(0.00%)#2,788 |
| 35. | Englewood | 982 | 225,832(0.43%)#35 | 37,145,956(0.00%)#2,866 |
| 36. | Hoboken | 923 | 225,832(0.41%)#36 | 37,145,956(0.00%)#2,966 |
| 37. | Wildwood | 911 | 225,832(0.40%)#37 | 37,145,956(0.00%)#2,991 |
| 38. | Old Bridge | 886 | 225,832(0.39%)#38 | 37,145,956(0.00%)#3,042 |
| 39. | Millville | 824 | 225,832(0.36%)#39 | 37,145,956(0.00%)#3,181 |
| 40. | Bradley Beach Borough | 812 | 225,832(0.36%)#40 | 37,145,956(0.00%)#3,211 |
| 41. | Bellmawr Borough | 784 | 225,832(0.35%)#41 | 37,145,956(0.00%)#3,275 |
| 42. | Kendall Park | 773 | 225,832(0.34%)#42 | 37,145,956(0.00%)#3,309 |
| 43. | Roselle Borough | 711 | 225,832(0.31%)#43 | 37,145,956(0.00%)#3,478 |
| 44. | Woodbridge | 695 | 225,832(0.31%)#44 | 37,145,956(0.00%)#3,509 |
| 45. | Ocean City | 693 | 225,832(0.31%)#45 | 37,145,956(0.00%)#3,519 |
| 46. | North Plainfield Borough | 614 | 225,832(0.27%)#46 | 37,145,956(0.00%)#3,797 |
| 47. | Point Pleasant Borough | 598 | 225,832(0.26%)#47 | 37,145,956(0.00%)#3,856 |
| 48. | Somerville Borough | 585 | 225,832(0.26%)#48 | 37,145,956(0.00%)#3,912 |
| 49. | South Bound Brook Borough | 580 | 225,832(0.26%)#49 | 37,145,956(0.00%)#3,939 |
| 50. | Leisure Village | 562 | 225,832(0.25%)#50 | 37,145,956(0.00%)#4,005 |
| 51. | Lodi Borough | 561 | 225,832(0.25%)#51 | 37,145,956(0.00%)#4,006 |
| 52. | Hillsborough | 537 | 225,832(0.24%)#52 | 37,145,956(0.00%)#4,109 |
| 53. | Gloucester City | 523 | 225,832(0.23%)#53 | 37,145,956(0.00%)#4,165 |
| 54. | Point Pleasant Beach Borough | 517 | 225,832(0.23%)#54 | 37,145,956(0.00%)#4,193 |
| 55. | Sicklerville | 508 | 225,832(0.22%)#55 | 37,145,956(0.00%)#4,227 |
| 56. | Highland Park Borough | 508 | 225,832(0.22%)#56 | 37,145,956(0.00%)#4,228 |
| 57. | Belmar Borough | 501 | 225,832(0.22%)#57 | 37,145,956(0.00%)#4,264 |
| 58. | West Freehold | 490 | 225,832(0.22%)#58 | 37,145,956(0.00%)#4,314 |
| 59. | Harrison | 468 | 225,832(0.21%)#59 | 37,145,956(0.00%)#4,428 |
| 60. | East Rutherford Borough | 465 | 225,832(0.21%)#60 | 37,145,956(0.00%)#4,439 |
| 61. | Hackensack | 460 | 225,832(0.20%)#61 | 37,145,956(0.00%)#4,469 |
| 62. | Keansburg Borough | 450 | 225,832(0.20%)#62 | 37,145,956(0.00%)#4,518 |
| 63. | Carneys Point | 447 | 225,832(0.20%)#63 | 37,145,956(0.00%)#4,538 |
| 64. | North Haledon Borough | 438 | 225,832(0.19%)#64 | 37,145,956(0.00%)#4,587 |
| 65. | Glassboro Borough | 437 | 225,832(0.19%)#65 | 37,145,956(0.00%)#4,590 |
| 66. | Secaucus | 427 | 225,832(0.19%)#66 | 37,145,956(0.00%)#4,665 |
| 67. | East Orange | 418 | 225,832(0.19%)#67 | 37,145,956(0.00%)#4,729 |
| 68. | Bergenfield Borough | 411 | 225,832(0.18%)#68 | 37,145,956(0.00%)#4,765 |
| 69. | Haddonfield Borough | 405 | 225,832(0.18%)#69 | 37,145,956(0.00%)#4,807 |
| 70. | Princeton | 393 | 225,832(0.17%)#70 | 37,145,956(0.00%)#4,895 |
| 71. | Pomona | 392 | 225,832(0.17%)#71 | 37,145,956(0.00%)#4,902 |
| 72. | Westwood Borough | 379 | 225,832(0.17%)#72 | 37,145,956(0.00%)#4,985 |
| 73. | Eatontown Borough | 377 | 225,832(0.17%)#73 | 37,145,956(0.00%)#5,004 |
| 74. | Sayreville Borough | 375 | 225,832(0.17%)#74 | 37,145,956(0.00%)#5,017 |
| 75. | Summit | 373 | 225,832(0.17%)#75 | 37,145,956(0.00%)#5,039 |
| 76. | Jamesburg Borough | 370 | 225,832(0.16%)#76 | 37,145,956(0.00%)#5,056 |
| 77. | Woodlynne Borough | 358 | 225,832(0.16%)#77 | 37,145,956(0.00%)#5,136 |
| 78. | Ridgewood | 357 | 225,832(0.16%)#78 | 37,145,956(0.00%)#5,137 |
| 79. | Wharton Borough | 354 | 225,832(0.16%)#79 | 37,145,956(0.00%)#5,164 |
| 80. | Pompton Lakes Borough | 349 | 225,832(0.15%)#80 | 37,145,956(0.00%)#5,190 |
| 81. | Rahway | 337 | 225,832(0.15%)#81 | 37,145,956(0.00%)#5,282 |
| 82. | Wallington Borough | 337 | 225,832(0.15%)#82 | 37,145,956(0.00%)#5,283 |
| 83. | Echelon | 335 | 225,832(0.15%)#83 | 37,145,956(0.00%)#5,296 |
| 84. | Prospect Park Borough | 329 | 225,832(0.15%)#84 | 37,145,956(0.00%)#5,349 |
| 85. | Ventnor City | 325 | 225,832(0.14%)#85 | 37,145,956(0.00%)#5,387 |
| 86. | Cliffwood Beach | 324 | 225,832(0.14%)#86 | 37,145,956(0.00%)#5,391 |
| 87. | Swedesboro Borough | 322 | 225,832(0.14%)#87 | 37,145,956(0.00%)#5,409 |
| 88. | Hawthorne Borough | 321 | 225,832(0.14%)#88 | 37,145,956(0.00%)#5,411 |
| 89. | Flanders | 317 | 225,832(0.14%)#89 | 37,145,956(0.00%)#5,442 |
| 90. | Phillipsburg | 311 | 225,832(0.14%)#90 | 37,145,956(0.00%)#5,492 |
| 91. | Ridgefield Borough | 309 | 225,832(0.14%)#91 | 37,145,956(0.00%)#5,508 |
| 92. | Palmyra Borough | 307 | 225,832(0.14%)#92 | 37,145,956(0.00%)#5,529 |
| 93. | Flemington Borough | 306 | 225,832(0.14%)#93 | 37,145,956(0.00%)#5,537 |
| 94. | Upper Montclair | 304 | 225,832(0.13%)#94 | 37,145,956(0.00%)#5,550 |
| 95. | Carteret Borough | 302 | 225,832(0.13%)#95 | 37,145,956(0.00%)#5,561 |
| 96. | Browns Mills | 291 | 225,832(0.13%)#96 | 37,145,956(0.00%)#5,670 |
| 97. | Woodland Park Borough | 289 | 225,832(0.13%)#97 | 37,145,956(0.00%)#5,687 |
| 98. | Franklin Center | 288 | 225,832(0.13%)#98 | 37,145,956(0.00%)#5,701 |
| 99. | Beachwood Borough | 283 | 225,832(0.13%)#99 | 37,145,956(0.00%)#5,752 |
| 100. | Dunellen Borough | 280 | 225,832(0.12%)#100 | 37,145,956(0.00%)#5,788 |
Common Questions
What are the Top 10 Cities with the Largest Mexican Community in New Jersey?
Top 10 Cities with the Largest Mexican Community in New Jersey are:
#1
21,425
#2
10,693
#3
9,074
#4
7,950
#5
5,657
#6
5,204
#7
4,742
#8
4,666
#9
4,637
#10
4,633
What city has the Largest Mexican Community in New Jersey?
Passaic has the Largest Mexican Community in New Jersey with 21,425.
What is the Total Mexican Population in the State of New Jersey?
Total Mexican Population in New Jersey is 225,832.
What is the Total Mexican Population in the United States?
Total Mexican Population in the United States is 37,145,956.