Cities with the Highest Percentage of Salvadoran Population in Washington
RELATED REPORTS & OPTIONS
Salvadoran
Washington
Compare Cities
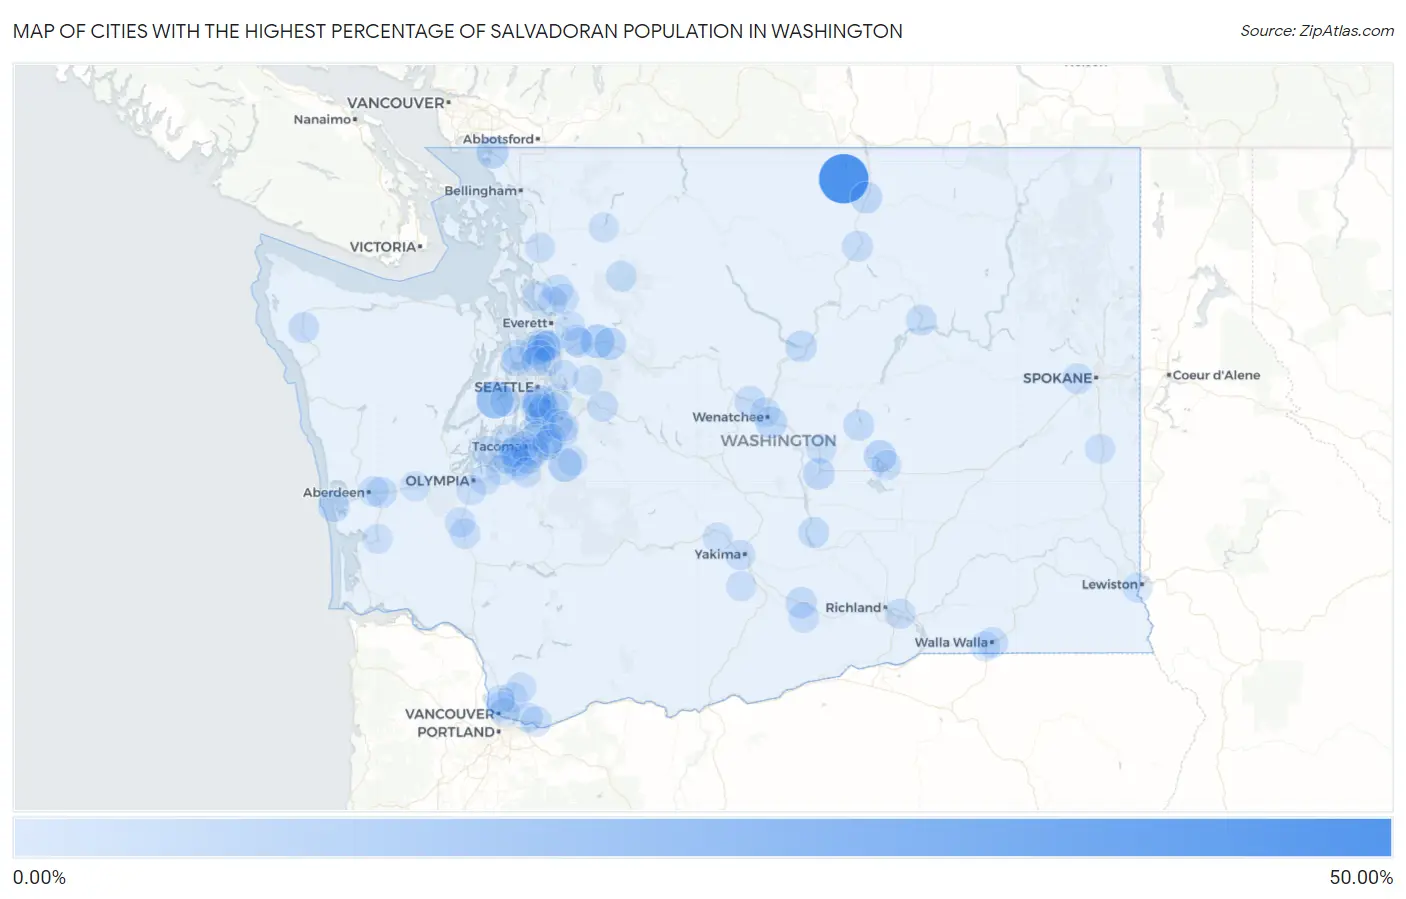
Map of Cities with the Highest Percentage of Salvadoran Population in Washington
0.00%
50.00%
Cities with the Highest Percentage of Salvadoran Population in Washington
| City | Salvadoran | vs State | vs National | |
| 1. | Loomis | 42.86% | 0.35%(+42.5)#1 | 0.72%(+42.1)#2 |
| 2. | Gorst | 15.15% | 0.35%(+14.8)#2 | 0.72%(+14.4)#78 |
| 3. | Sultan | 8.00% | 0.35%(+7.65)#3 | 0.72%(+7.28)#190 |
| 4. | South Prairie | 7.65% | 0.35%(+7.30)#4 | 0.72%(+6.93)#203 |
| 5. | Moses Lake North | 4.92% | 0.35%(+4.57)#5 | 0.72%(+4.20)#345 |
| 6. | Gold Bar | 4.75% | 0.35%(+4.40)#6 | 0.72%(+4.03)#364 |
| 7. | Blaine | 4.64% | 0.35%(+4.29)#7 | 0.72%(+3.92)#374 |
| 8. | Boulevard Park | 4.38% | 0.35%(+4.02)#8 | 0.72%(+3.65)#398 |
| 9. | South Wenatchee | 4.10% | 0.35%(+3.75)#9 | 0.72%(+3.38)#430 |
| 10. | George | 3.81% | 0.35%(+3.46)#10 | 0.72%(+3.09)#471 |
| 11. | Tonasket | 3.73% | 0.35%(+3.38)#11 | 0.72%(+3.01)#480 |
| 12. | North Lynnwood | 3.64% | 0.35%(+3.29)#12 | 0.72%(+2.92)#490 |
| 13. | Chelan | 3.37% | 0.35%(+3.02)#13 | 0.72%(+2.65)#549 |
| 14. | Westport | 3.08% | 0.35%(+2.73)#14 | 0.72%(+2.36)#597 |
| 15. | Seatac | 2.76% | 0.35%(+2.41)#15 | 0.72%(+2.04)#682 |
| 16. | Sunnyside | 2.65% | 0.35%(+2.30)#16 | 0.72%(+1.93)#710 |
| 17. | Kingston | 2.27% | 0.35%(+1.92)#17 | 0.72%(+1.55)#825 |
| 18. | Mattawa | 2.20% | 0.35%(+1.85)#18 | 0.72%(+1.47)#851 |
| 19. | Central Park | 2.17% | 0.35%(+1.82)#19 | 0.72%(+1.44)#862 |
| 20. | Lakeview | 2.14% | 0.35%(+1.79)#20 | 0.72%(+1.42)#871 |
| 21. | Des Moines | 2.12% | 0.35%(+1.77)#21 | 0.72%(+1.40)#875 |
| 22. | Cashmere | 2.03% | 0.35%(+1.68)#22 | 0.72%(+1.31)#900 |
| 23. | Arlington | 2.03% | 0.35%(+1.68)#23 | 0.72%(+1.31)#901 |
| 24. | Omak | 2.03% | 0.35%(+1.68)#24 | 0.72%(+1.31)#904 |
| 25. | Fife | 2.02% | 0.35%(+1.67)#25 | 0.72%(+1.30)#907 |
| 26. | Forks | 1.75% | 0.35%(+1.39)#26 | 0.72%(+1.02)#1,020 |
| 27. | Darrington | 1.70% | 0.35%(+1.35)#27 | 0.72%(+0.981)#1,053 |
| 28. | Longbranch | 1.69% | 0.35%(+1.34)#28 | 0.72%(+0.969)#1,058 |
| 29. | Monroe North | 1.65% | 0.35%(+1.30)#29 | 0.72%(+0.927)#1,086 |
| 30. | Lake Morton Berrydale | 1.64% | 0.35%(+1.29)#30 | 0.72%(+0.923)#1,087 |
| 31. | Burien | 1.63% | 0.35%(+1.28)#31 | 0.72%(+0.911)#1,097 |
| 32. | North Bend | 1.50% | 0.35%(+1.15)#32 | 0.72%(+0.775)#1,185 |
| 33. | Elmer City | 1.45% | 0.35%(+1.10)#33 | 0.72%(+0.728)#1,221 |
| 34. | Airway Heights | 1.43% | 0.35%(+1.08)#34 | 0.72%(+0.707)#1,233 |
| 35. | Tukwila | 1.42% | 0.35%(+1.07)#35 | 0.72%(+0.697)#1,239 |
| 36. | Walla Walla | 1.40% | 0.35%(+1.05)#36 | 0.72%(+0.676)#1,259 |
| 37. | Wollochet | 1.37% | 0.35%(+1.02)#37 | 0.72%(+0.653)#1,270 |
| 38. | East Port Orchard | 1.36% | 0.35%(+1.01)#38 | 0.72%(+0.642)#1,286 |
| 39. | Fircrest | 1.31% | 0.35%(+0.959)#39 | 0.72%(+0.589)#1,322 |
| 40. | Edmonds | 1.27% | 0.35%(+0.916)#40 | 0.72%(+0.545)#1,361 |
| 41. | Mabton | 1.21% | 0.35%(+0.859)#41 | 0.72%(+0.488)#1,403 |
| 42. | Martha Lake | 1.15% | 0.35%(+0.797)#42 | 0.72%(+0.426)#1,448 |
| 43. | Pasco | 1.15% | 0.35%(+0.794)#43 | 0.72%(+0.424)#1,450 |
| 44. | Washougal | 1.08% | 0.35%(+0.731)#44 | 0.72%(+0.360)#1,511 |
| 45. | Algona | 1.01% | 0.35%(+0.660)#45 | 0.72%(+0.289)#1,601 |
| 46. | Federal Way | 1.01% | 0.35%(+0.660)#46 | 0.72%(+0.289)#1,602 |
| 47. | Mcchord Afb | 0.97% | 0.35%(+0.615)#47 | 0.72%(+0.244)#1,659 |
| 48. | Centralia | 0.88% | 0.35%(+0.527)#48 | 0.72%(+0.156)#1,764 |
| 49. | Newcastle | 0.84% | 0.35%(+0.484)#49 | 0.72%(+0.114)#1,814 |
| 50. | Lakewood | 0.82% | 0.35%(+0.470)#50 | 0.72%(+0.099)#1,834 |
| 51. | Waller | 0.78% | 0.35%(+0.425)#51 | 0.72%(+0.054)#1,922 |
| 52. | Kent | 0.76% | 0.35%(+0.406)#52 | 0.72%(+0.035)#1,954 |
| 53. | Grand Mound | 0.76% | 0.35%(+0.405)#53 | 0.72%(+0.034)#1,958 |
| 54. | Yakima | 0.73% | 0.35%(+0.375)#54 | 0.72%(+0.004)#2,006 |
| 55. | White Center | 0.72% | 0.35%(+0.366)#55 | 0.72%(-0.005)#2,024 |
| 56. | Larch Way | 0.70% | 0.35%(+0.354)#56 | 0.72%(-0.017)#2,047 |
| 57. | Pacific | 0.70% | 0.35%(+0.354)#57 | 0.72%(-0.017)#2,049 |
| 58. | Indianola | 0.70% | 0.35%(+0.353)#58 | 0.72%(-0.018)#2,050 |
| 59. | Moses Lake | 0.70% | 0.35%(+0.349)#59 | 0.72%(-0.022)#2,055 |
| 60. | Lynnwood | 0.66% | 0.35%(+0.314)#60 | 0.72%(-0.057)#2,112 |
| 61. | Midland | 0.66% | 0.35%(+0.310)#61 | 0.72%(-0.061)#2,127 |
| 62. | Brush Prairie | 0.65% | 0.35%(+0.297)#62 | 0.72%(-0.074)#2,152 |
| 63. | Aberdeen | 0.61% | 0.35%(+0.256)#63 | 0.72%(-0.115)#2,235 |
| 64. | Hazel Dell | 0.60% | 0.35%(+0.248)#64 | 0.72%(-0.123)#2,259 |
| 65. | Mount Vernon | 0.58% | 0.35%(+0.230)#65 | 0.72%(-0.141)#2,300 |
| 66. | Sisco Heights | 0.57% | 0.35%(+0.221)#66 | 0.72%(-0.150)#2,319 |
| 67. | Everett | 0.57% | 0.35%(+0.220)#67 | 0.72%(-0.151)#2,320 |
| 68. | Tacoma | 0.57% | 0.35%(+0.218)#68 | 0.72%(-0.153)#2,325 |
| 69. | Wenatchee | 0.56% | 0.35%(+0.206)#69 | 0.72%(-0.165)#2,347 |
| 70. | Dupont | 0.54% | 0.35%(+0.192)#70 | 0.72%(-0.179)#2,387 |
| 71. | Kayak Point | 0.54% | 0.35%(+0.191)#71 | 0.72%(-0.180)#2,390 |
| 72. | College Place | 0.53% | 0.35%(+0.180)#72 | 0.72%(-0.191)#2,414 |
| 73. | Steilacoom | 0.52% | 0.35%(+0.173)#73 | 0.72%(-0.198)#2,431 |
| 74. | Mountlake Terrace | 0.49% | 0.35%(+0.136)#74 | 0.72%(-0.235)#2,514 |
| 75. | Camas | 0.47% | 0.35%(+0.119)#75 | 0.72%(-0.252)#2,560 |
| 76. | Renton | 0.47% | 0.35%(+0.116)#76 | 0.72%(-0.255)#2,567 |
| 77. | Lacey | 0.45% | 0.35%(+0.099)#77 | 0.72%(-0.272)#2,615 |
| 78. | West Clarkston Highland | 0.44% | 0.35%(+0.093)#78 | 0.72%(-0.278)#2,626 |
| 79. | University Place | 0.43% | 0.35%(+0.079)#79 | 0.72%(-0.292)#2,670 |
| 80. | Raymond | 0.42% | 0.35%(+0.070)#80 | 0.72%(-0.301)#2,700 |
| 81. | Elma | 0.41% | 0.35%(+0.058)#81 | 0.72%(-0.313)#2,736 |
| 82. | Quincy | 0.40% | 0.35%(+0.049)#82 | 0.72%(-0.322)#2,762 |
| 83. | Auburn | 0.39% | 0.35%(+0.044)#83 | 0.72%(-0.327)#2,773 |
| 84. | Vancouver | 0.39% | 0.35%(+0.041)#84 | 0.72%(-0.329)#2,783 |
| 85. | Kenmore | 0.39% | 0.35%(+0.039)#85 | 0.72%(-0.332)#2,791 |
| 86. | Tieton | 0.39% | 0.35%(+0.037)#86 | 0.72%(-0.334)#2,797 |
| 87. | Shoreline | 0.38% | 0.35%(+0.029)#87 | 0.72%(-0.342)#2,829 |
| 88. | Concrete | 0.38% | 0.35%(+0.028)#88 | 0.72%(-0.343)#2,837 |
| 89. | Tumwater | 0.36% | 0.35%(+0.008)#89 | 0.72%(-0.363)#2,915 |
| 90. | Covington | 0.35% | 0.35%(-0.000)#90 | 0.72%(-0.371)#2,948 |
| 91. | Marysville | 0.34% | 0.35%(-0.009)#91 | 0.72%(-0.380)#2,978 |
| 92. | Rosalia | 0.33% | 0.35%(-0.017)#92 | 0.72%(-0.388)#3,013 |
| 93. | Venersborg | 0.33% | 0.35%(-0.018)#93 | 0.72%(-0.389)#3,021 |
| 94. | Buckley | 0.33% | 0.35%(-0.023)#94 | 0.72%(-0.394)#3,037 |
| 95. | Carnation | 0.32% | 0.35%(-0.033)#95 | 0.72%(-0.404)#3,064 |
| 96. | Harrah | 0.31% | 0.35%(-0.038)#96 | 0.72%(-0.409)#3,087 |
| 97. | Spanaway | 0.31% | 0.35%(-0.042)#97 | 0.72%(-0.413)#3,106 |
| 98. | Redmond | 0.30% | 0.35%(-0.048)#98 | 0.72%(-0.419)#3,128 |
| 99. | Monroe | 0.30% | 0.35%(-0.050)#99 | 0.72%(-0.421)#3,140 |
| 100. | Salmon Creek | 0.30% | 0.35%(-0.051)#100 | 0.72%(-0.421)#3,141 |
Common Questions
What are the Top 10 Cities with the Highest Percentage of Salvadoran Population in Washington?
Top 10 Cities with the Highest Percentage of Salvadoran Population in Washington are:
#1
42.86%
#2
15.15%
#3
8.00%
#4
7.65%
#5
4.92%
#6
4.75%
#7
4.64%
#8
4.38%
#9
4.10%
#10
3.81%
What city has the Highest Percentage of Salvadoran Population in Washington?
Loomis has the Highest Percentage of Salvadoran Population in Washington with 42.86%.
What is the Percentage of Salvadoran Population in the State of Washington?
Percentage of Salvadoran Population in Washington is 0.35%.
What is the Percentage of Salvadoran Population in the United States?
Percentage of Salvadoran Population in the United States is 0.72%.