South Cle Elum, WA Map & Demographics
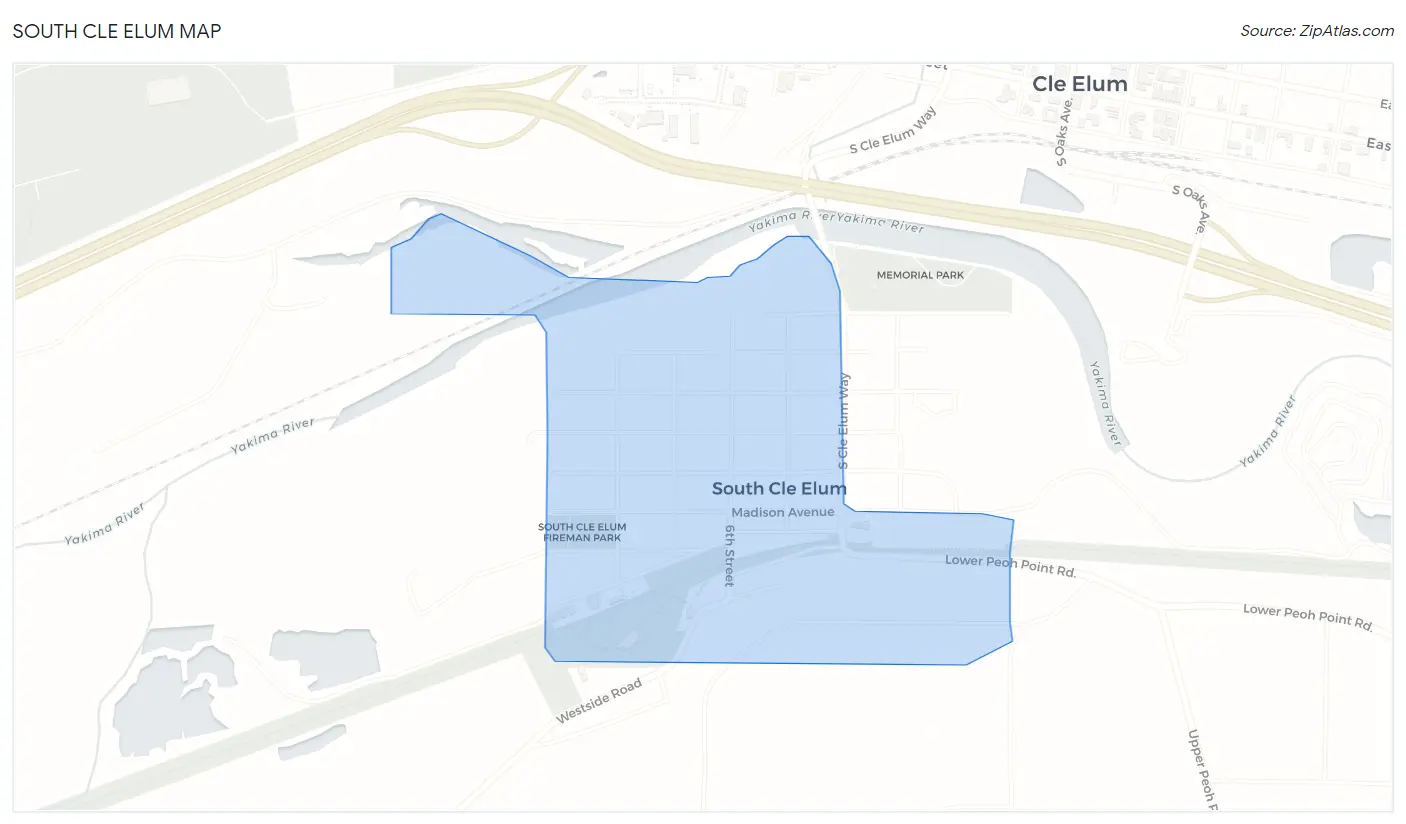
South Cle Elum Map
South Cle Elum Overview
$31,850
PER CAPITA INCOME
$53,750
AVG FAMILY INCOME
$56,400
AVG HOUSEHOLD INCOME
47.3%
WAGE / INCOME GAP [ % ]
52.7¢/ $1
WAGE / INCOME GAP [ $ ]
0.42
INEQUALITY / GINI INDEX
715
TOTAL POPULATION
372
MALE POPULATION
343
FEMALE POPULATION
108.45
MALES / 100 FEMALES
92.20
FEMALES / 100 MALES
35.2
MEDIAN AGE
2.6
AVG FAMILY SIZE
2.2
AVG HOUSEHOLD SIZE
390
LABOR FORCE [ PEOPLE ]
65.7%
PERCENT IN LABOR FORCE
7.7%
UNEMPLOYMENT RATE
South Cle Elum Zip Codes
South Cle Elum Area Codes
Income in South Cle Elum
Income Overview in South Cle Elum
Per Capita Income in South Cle Elum is $31,850, while median incomes of families and households are $53,750 and $56,400 respectively.
| Characteristic | Number | Measure |
| Per Capita Income | 715 | $31,850 |
| Median Family Income | 210 | $53,750 |
| Mean Family Income | 210 | $76,153 |
| Median Household Income | 324 | $56,400 |
| Mean Household Income | 324 | $70,643 |
| Income Deficit | 210 | $0 |
| Wage / Income Gap (%) | 715 | 47.32% |
| Wage / Income Gap ($) | 715 | 52.68¢ per $1 |
| Gini / Inequality Index | 715 | 0.42 |
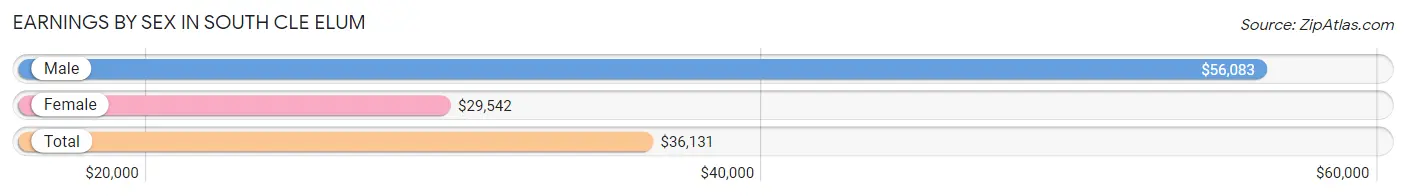
Earnings by Sex in South Cle Elum
Average Earnings in South Cle Elum are $36,131, $56,083 for men and $29,542 for women, a difference of 47.3%.
| Sex | Number | Average Earnings |
| Male | 165 (43.4%) | $56,083 |
| Female | 215 (56.6%) | $29,542 |
| Total | 380 (100.0%) | $36,131 |
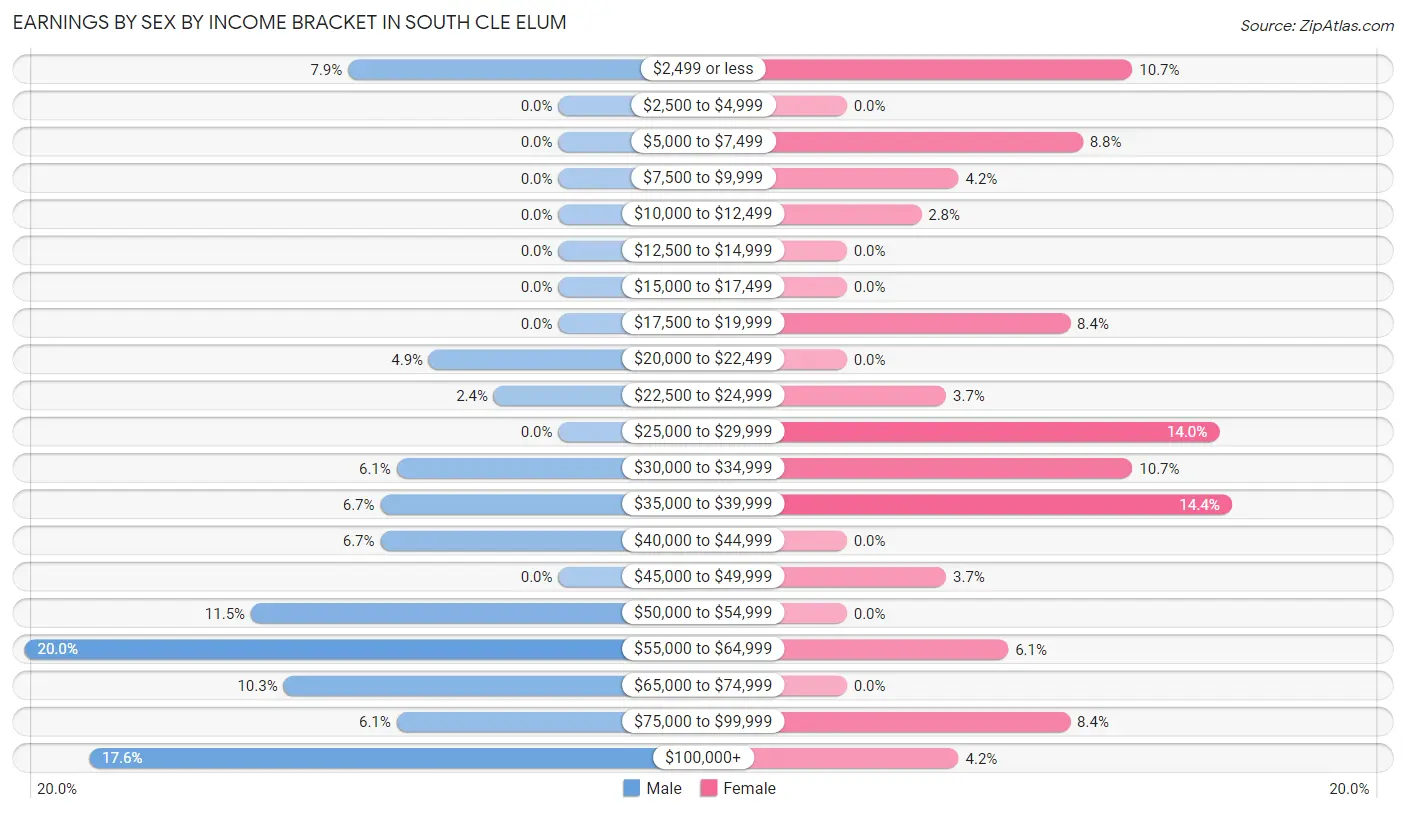
Earnings by Sex by Income Bracket in South Cle Elum
The most common earnings brackets in South Cle Elum are $55,000 to $64,999 for men (33 | 20.0%) and $35,000 to $39,999 for women (31 | 14.4%).
| Income | Male | Female |
| $2,499 or less | 13 (7.9%) | 23 (10.7%) |
| $2,500 to $4,999 | 0 (0.0%) | 0 (0.0%) |
| $5,000 to $7,499 | 0 (0.0%) | 19 (8.8%) |
| $7,500 to $9,999 | 0 (0.0%) | 9 (4.2%) |
| $10,000 to $12,499 | 0 (0.0%) | 6 (2.8%) |
| $12,500 to $14,999 | 0 (0.0%) | 0 (0.0%) |
| $15,000 to $17,499 | 0 (0.0%) | 0 (0.0%) |
| $17,500 to $19,999 | 0 (0.0%) | 18 (8.4%) |
| $20,000 to $22,499 | 8 (4.9%) | 0 (0.0%) |
| $22,500 to $24,999 | 4 (2.4%) | 8 (3.7%) |
| $25,000 to $29,999 | 0 (0.0%) | 30 (14.0%) |
| $30,000 to $34,999 | 10 (6.1%) | 23 (10.7%) |
| $35,000 to $39,999 | 11 (6.7%) | 31 (14.4%) |
| $40,000 to $44,999 | 11 (6.7%) | 0 (0.0%) |
| $45,000 to $49,999 | 0 (0.0%) | 8 (3.7%) |
| $50,000 to $54,999 | 19 (11.5%) | 0 (0.0%) |
| $55,000 to $64,999 | 33 (20.0%) | 13 (6.0%) |
| $65,000 to $74,999 | 17 (10.3%) | 0 (0.0%) |
| $75,000 to $99,999 | 10 (6.1%) | 18 (8.4%) |
| $100,000+ | 29 (17.6%) | 9 (4.2%) |
| Total | 165 (100.0%) | 215 (100.0%) |
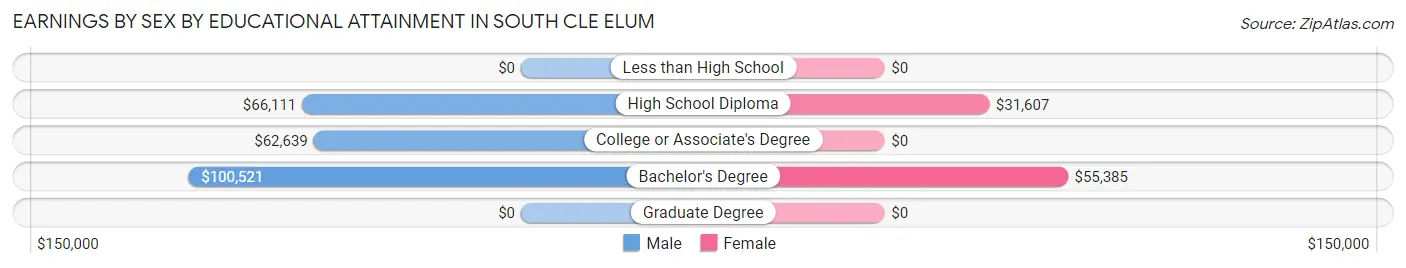
Earnings by Sex by Educational Attainment in South Cle Elum
Average earnings in South Cle Elum are $63,542 for men and $33,750 for women, a difference of 46.9%. Men with an educational attainment of bachelor's degree enjoy the highest average annual earnings of $100,521, while those with college or associate's degree education earn the least with $62,639. Women with an educational attainment of bachelor's degree earn the most with the average annual earnings of $55,385, while those with high school diploma education have the smallest earnings of $31,607.
| Educational Attainment | Male Income | Female Income |
| Less than High School | - | - |
| High School Diploma | $66,111 | $31,607 |
| College or Associate's Degree | $62,639 | $0 |
| Bachelor's Degree | $100,521 | $55,385 |
| Graduate Degree | - | - |
| Total | $63,542 | $33,750 |
Family Income in South Cle Elum
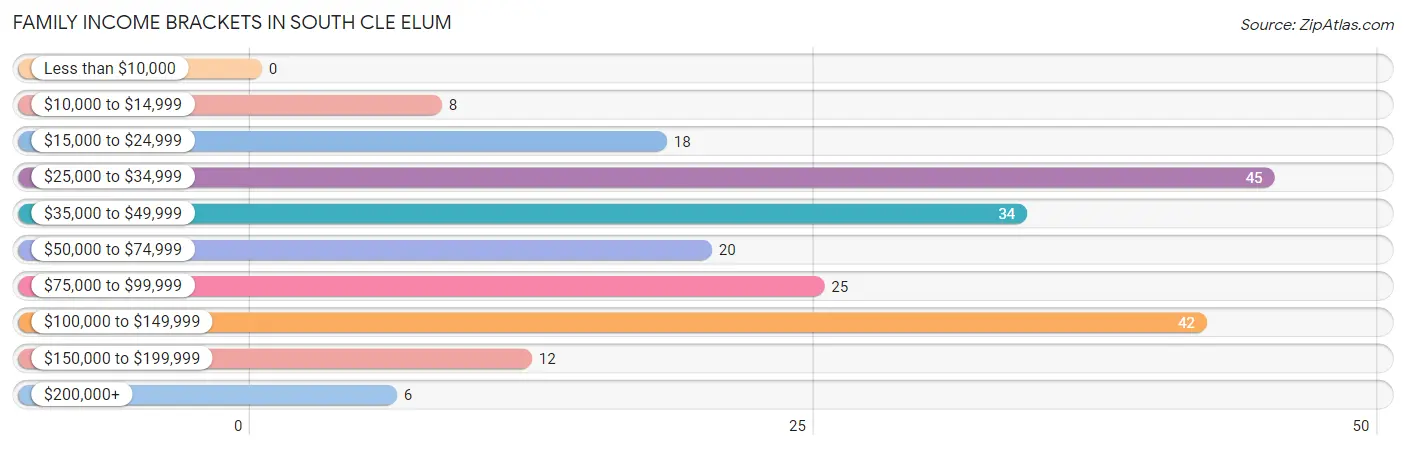
Family Income Brackets in South Cle Elum
According to the South Cle Elum family income data, there are 45 families falling into the $25,000 to $34,999 income range, which is the most common income bracket and makes up 21.4% of all families.
| Income Bracket | # Families | % Families |
| Less than $10,000 | 0 | 0.0% |
| $10,000 to $14,999 | 8 | 3.8% |
| $15,000 to $24,999 | 18 | 8.6% |
| $25,000 to $34,999 | 45 | 21.4% |
| $35,000 to $49,999 | 34 | 16.2% |
| $50,000 to $74,999 | 20 | 9.5% |
| $75,000 to $99,999 | 25 | 11.9% |
| $100,000 to $149,999 | 42 | 20.0% |
| $150,000 to $199,999 | 12 | 5.7% |
| $200,000+ | 6 | 2.9% |
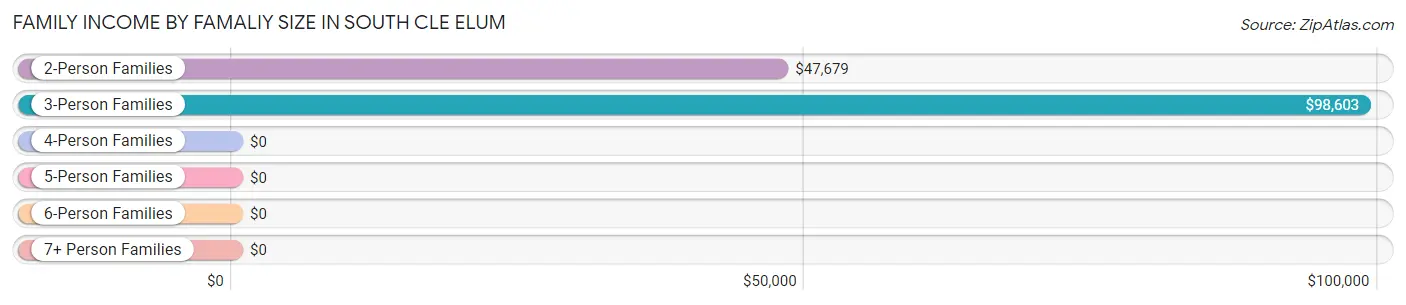
Family Income by Famaliy Size in South Cle Elum
3-person families (37 | 17.6%) account for the highest median family income in South Cle Elum with $98,603 per family, while 3-person families (37 | 17.6%) have the highest median income of $32,868 per family member.
| Income Bracket | # Families | Median Income |
| 2-Person Families | 147 (70.0%) | $47,679 |
| 3-Person Families | 37 (17.6%) | $98,603 |
| 4-Person Families | 0 (0.0%) | $0 |
| 5-Person Families | 12 (5.7%) | $0 |
| 6-Person Families | 14 (6.7%) | $0 |
| 7+ Person Families | 0 (0.0%) | $0 |
| Total | 210 (100.0%) | $53,750 |
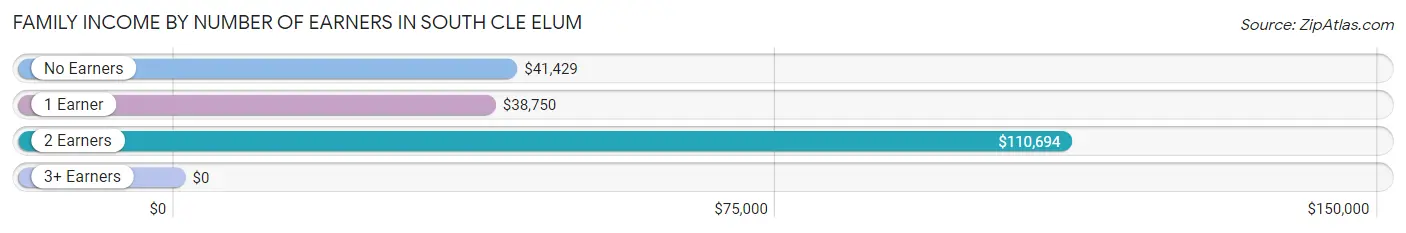
Family Income by Number of Earners in South Cle Elum
| Number of Earners | # Families | Median Income |
| No Earners | 42 (20.0%) | $41,429 |
| 1 Earner | 66 (31.4%) | $38,750 |
| 2 Earners | 85 (40.5%) | $110,694 |
| 3+ Earners | 17 (8.1%) | $0 |
| Total | 210 (100.0%) | $53,750 |
Household Income in South Cle Elum
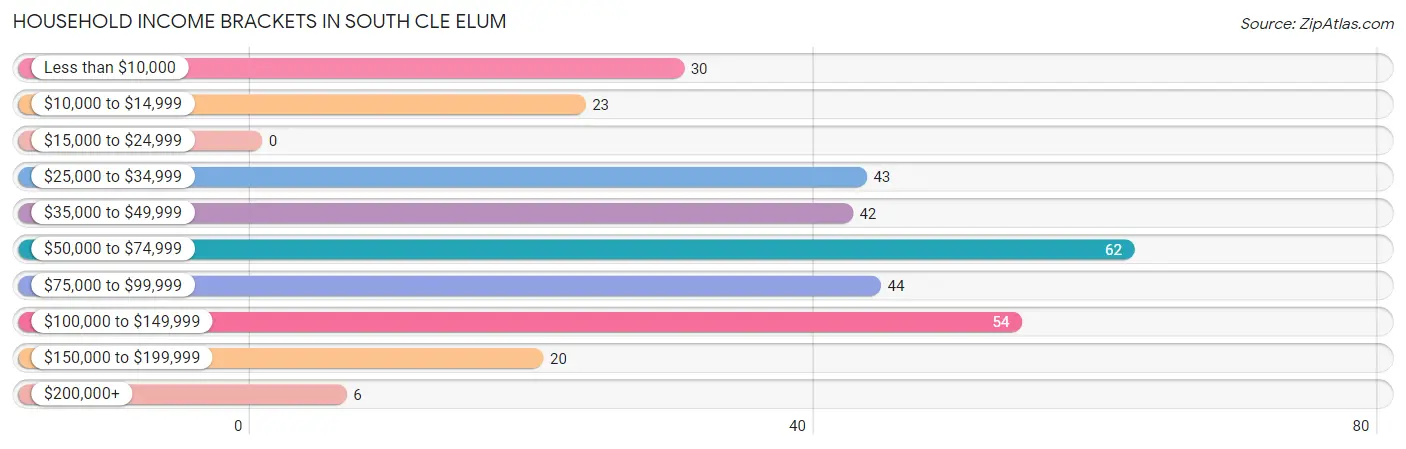
Household Income Brackets in South Cle Elum
With 62 households falling in the category, the $50,000 to $74,999 income range is the most frequent in South Cle Elum, accounting for 19.1% of all households.
| Income Bracket | # Households | % Households |
| Less than $10,000 | 30 | 9.3% |
| $10,000 to $14,999 | 23 | 7.1% |
| $15,000 to $24,999 | 0 | 0.0% |
| $25,000 to $34,999 | 43 | 13.3% |
| $35,000 to $49,999 | 42 | 13.0% |
| $50,000 to $74,999 | 62 | 19.1% |
| $75,000 to $99,999 | 44 | 13.6% |
| $100,000 to $149,999 | 54 | 16.7% |
| $150,000 to $199,999 | 20 | 6.2% |
| $200,000+ | 6 | 1.9% |
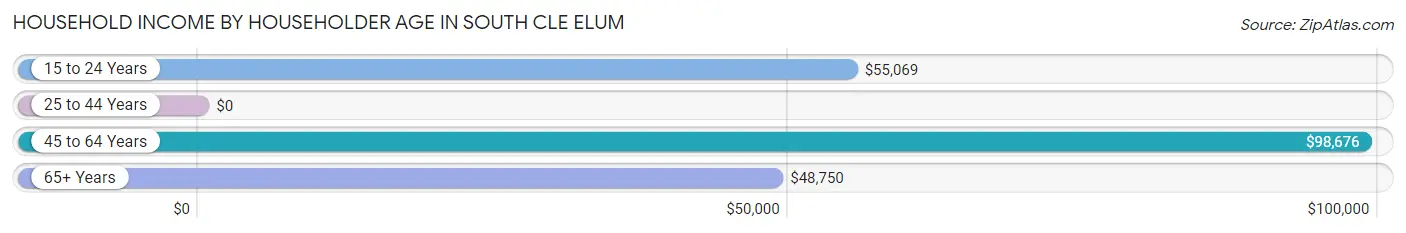
Household Income by Householder Age in South Cle Elum
The median household income in South Cle Elum is $56,400, with the highest median household income of $98,676 found in the 45 to 64 years age bracket for the primary householder. A total of 112 households (34.6%) fall into this category. Meanwhile, the 25 to 44 years age bracket for the primary householder has the lowest median household income of $0, with 88 households (27.2%) in this group.
| Income Bracket | # Households | Median Income |
| 15 to 24 Years | 35 (10.8%) | $55,069 |
| 25 to 44 Years | 88 (27.2%) | $0 |
| 45 to 64 Years | 112 (34.6%) | $98,676 |
| 65+ Years | 89 (27.5%) | $48,750 |
| Total | 324 (100.0%) | $56,400 |
Poverty in South Cle Elum
Income Below Poverty by Sex and Age in South Cle Elum
With 22.9% poverty level for males and 33.5% for females among the residents of South Cle Elum, 6 to 11 year old males and 18 to 24 year old females are the most vulnerable to poverty, with 17 males (100.0%) and 36 females (90.0%) in their respective age groups living below the poverty level.
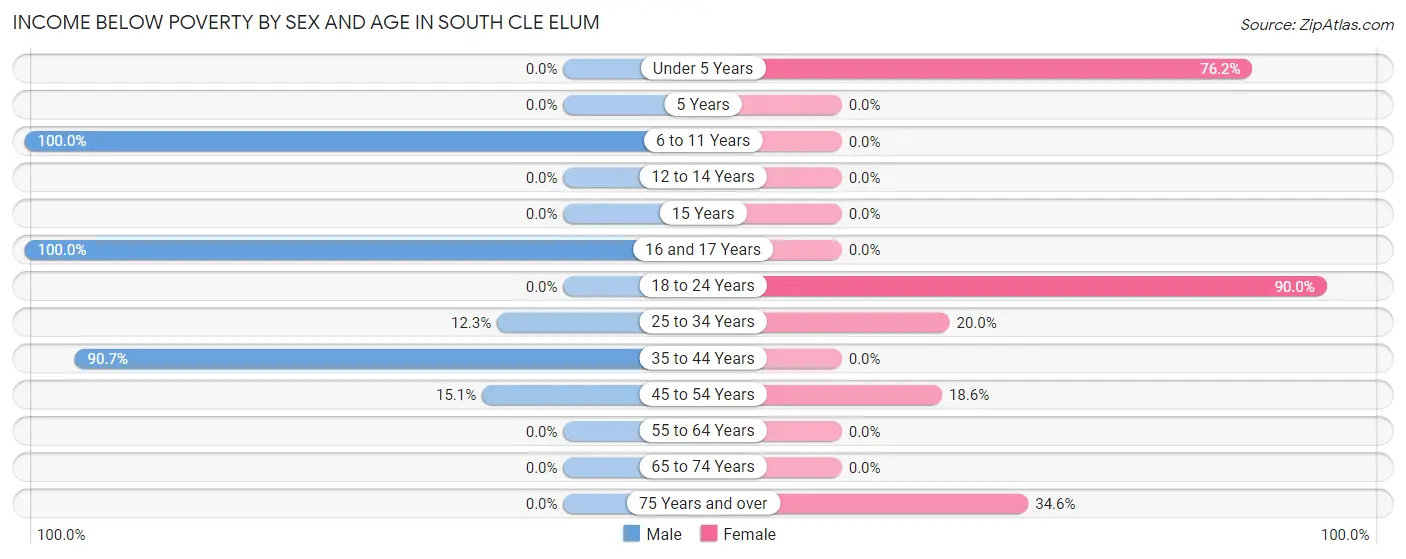
| Age Bracket | Male | Female |
| Under 5 Years | 0 (0.0%) | 48 (76.2%) |
| 5 Years | 0 (0.0%) | 0 (0.0%) |
| 6 to 11 Years | 17 (100.0%) | 0 (0.0%) |
| 12 to 14 Years | 0 (0.0%) | 0 (0.0%) |
| 15 Years | 0 (0.0%) | 0 (0.0%) |
| 16 and 17 Years | 13 (100.0%) | 0 (0.0%) |
| 18 to 24 Years | 0 (0.0%) | 36 (90.0%) |
| 25 to 34 Years | 8 (12.3%) | 14 (20.0%) |
| 35 to 44 Years | 39 (90.7%) | 0 (0.0%) |
| 45 to 54 Years | 8 (15.1%) | 8 (18.6%) |
| 55 to 64 Years | 0 (0.0%) | 0 (0.0%) |
| 65 to 74 Years | 0 (0.0%) | 0 (0.0%) |
| 75 Years and over | 0 (0.0%) | 9 (34.6%) |
| Total | 85 (22.9%) | 115 (33.5%) |
Income Above Poverty by Sex and Age in South Cle Elum
According to the poverty statistics in South Cle Elum, males aged under 5 years and females aged 6 to 11 years are the age groups that are most secure financially, with 100.0% of males and 100.0% of females in these age groups living above the poverty line.
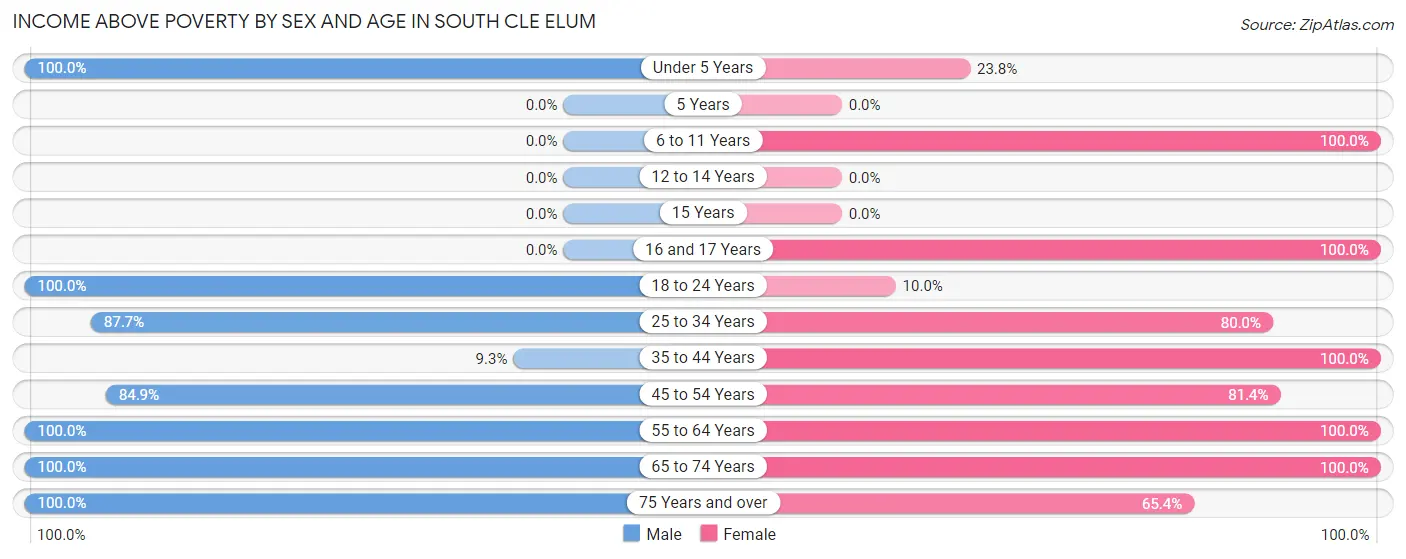
| Age Bracket | Male | Female |
| Under 5 Years | 30 (100.0%) | 15 (23.8%) |
| 5 Years | 0 (0.0%) | 0 (0.0%) |
| 6 to 11 Years | 0 (0.0%) | 11 (100.0%) |
| 12 to 14 Years | 0 (0.0%) | 0 (0.0%) |
| 15 Years | 0 (0.0%) | 0 (0.0%) |
| 16 and 17 Years | 0 (0.0%) | 8 (100.0%) |
| 18 to 24 Years | 37 (100.0%) | 4 (10.0%) |
| 25 to 34 Years | 57 (87.7%) | 56 (80.0%) |
| 35 to 44 Years | 4 (9.3%) | 4 (100.0%) |
| 45 to 54 Years | 45 (84.9%) | 35 (81.4%) |
| 55 to 64 Years | 44 (100.0%) | 53 (100.0%) |
| 65 to 74 Years | 50 (100.0%) | 25 (100.0%) |
| 75 Years and over | 20 (100.0%) | 17 (65.4%) |
| Total | 287 (77.1%) | 228 (66.5%) |
Income Below Poverty Among Married-Couple Families in South Cle Elum
The poverty statistics for married-couple families in South Cle Elum show that 17.6% or 22 of the total 125 families live below the poverty line. Families with 3 or 4 children have the highest poverty rate of 53.8%, comprising of 14 families. On the other hand, families with no children have the lowest poverty rate of 8.1%, which includes 8 families.
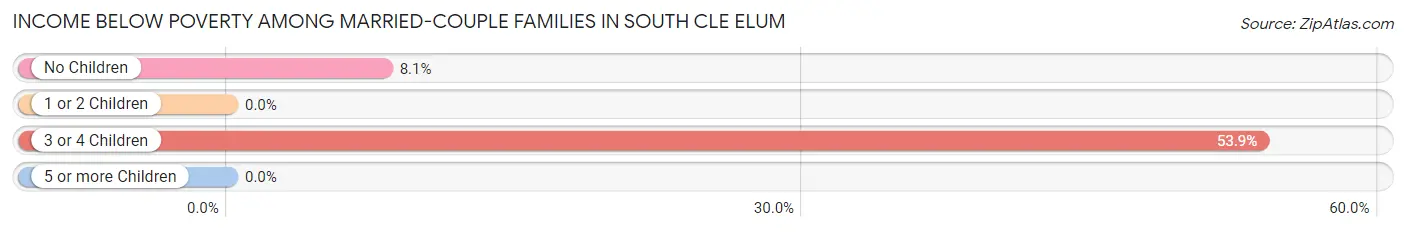
| Children | Above Poverty | Below Poverty |
| No Children | 91 (91.9%) | 8 (8.1%) |
| 1 or 2 Children | 0 (0.0%) | 0 (0.0%) |
| 3 or 4 Children | 12 (46.2%) | 14 (53.8%) |
| 5 or more Children | 0 (0.0%) | 0 (0.0%) |
| Total | 103 (82.4%) | 22 (17.6%) |
Income Below Poverty Among Single-Parent Households in South Cle Elum
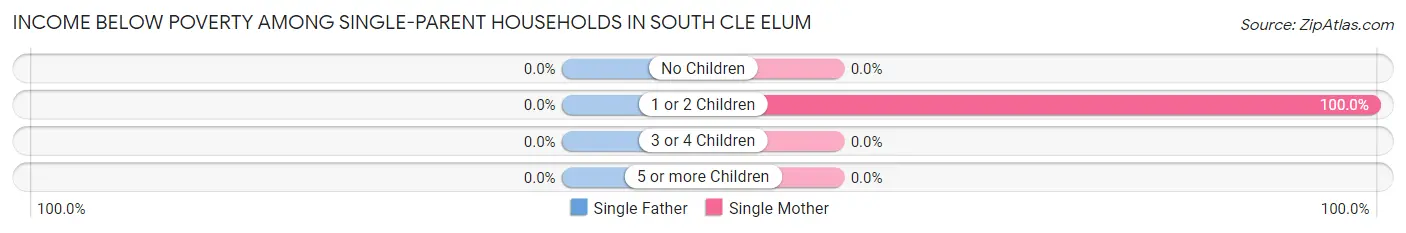
| Children | Single Father | Single Mother |
| No Children | 0 (0.0%) | 0 (0.0%) |
| 1 or 2 Children | 0 (0.0%) | 18 (100.0%) |
| 3 or 4 Children | 0 (0.0%) | 0 (0.0%) |
| 5 or more Children | 0 (0.0%) | 0 (0.0%) |
| Total | 0 (0.0%) | 18 (39.1%) |
Income Below Poverty Among Married-Couple vs Single-Parent Households in South Cle Elum
The poverty data for South Cle Elum shows that 22 of the married-couple family households (17.6%) and 18 of the single-parent households (21.2%) are living below the poverty level. Within the married-couple family households, those with 3 or 4 children have the highest poverty rate, with 14 households (53.8%) falling below the poverty line. Among the single-parent households, those with 1 or 2 children have the highest poverty rate, with 18 household (46.2%) living below poverty.
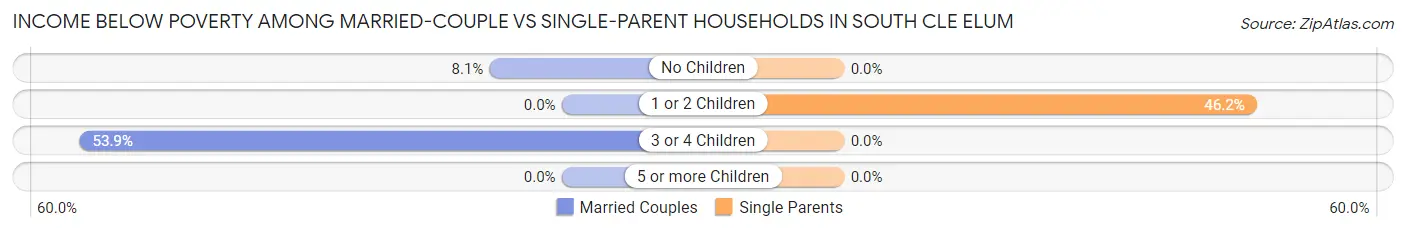
| Children | Married-Couple Families | Single-Parent Households |
| No Children | 8 (8.1%) | 0 (0.0%) |
| 1 or 2 Children | 0 (0.0%) | 18 (46.2%) |
| 3 or 4 Children | 14 (53.8%) | 0 (0.0%) |
| 5 or more Children | 0 (0.0%) | 0 (0.0%) |
| Total | 22 (17.6%) | 18 (21.2%) |
Race in South Cle Elum
The most populous races in South Cle Elum are White / Caucasian (646 | 90.3%), Two or more Races (55 | 7.7%), and Hispanic or Latino (34 | 4.8%).
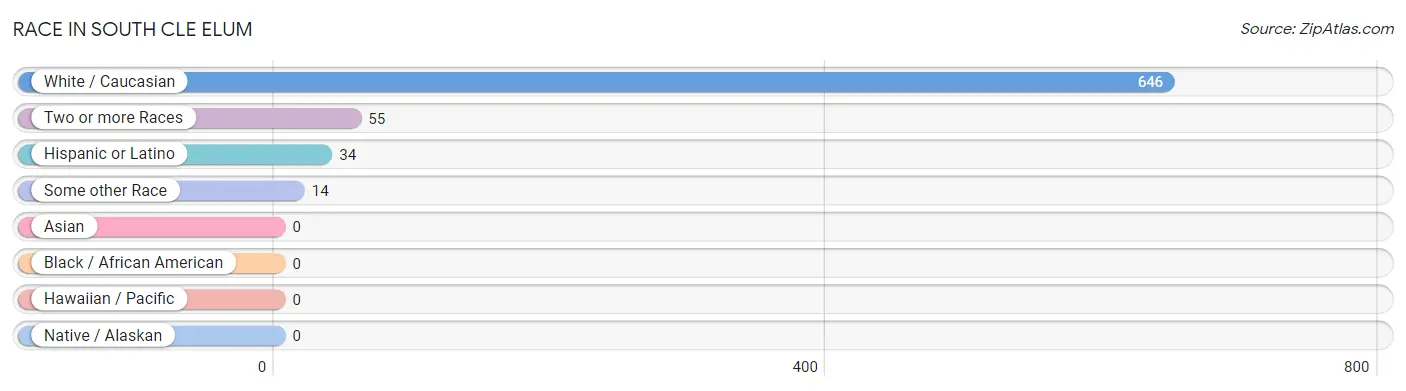
| Race | # Population | % Population |
| Asian | 0 | 0.0% |
| Black / African American | 0 | 0.0% |
| Hawaiian / Pacific | 0 | 0.0% |
| Hispanic or Latino | 34 | 4.8% |
| Native / Alaskan | 0 | 0.0% |
| White / Caucasian | 646 | 90.3% |
| Two or more Races | 55 | 7.7% |
| Some other Race | 14 | 2.0% |
| Total | 715 | 100.0% |
Ancestry in South Cle Elum
The most populous ancestries reported in South Cle Elum are European (183 | 25.6%), Norwegian (62 | 8.7%), German (60 | 8.4%), Italian (49 | 6.9%), and English (47 | 6.6%), together accounting for 56.1% of all South Cle Elum residents.
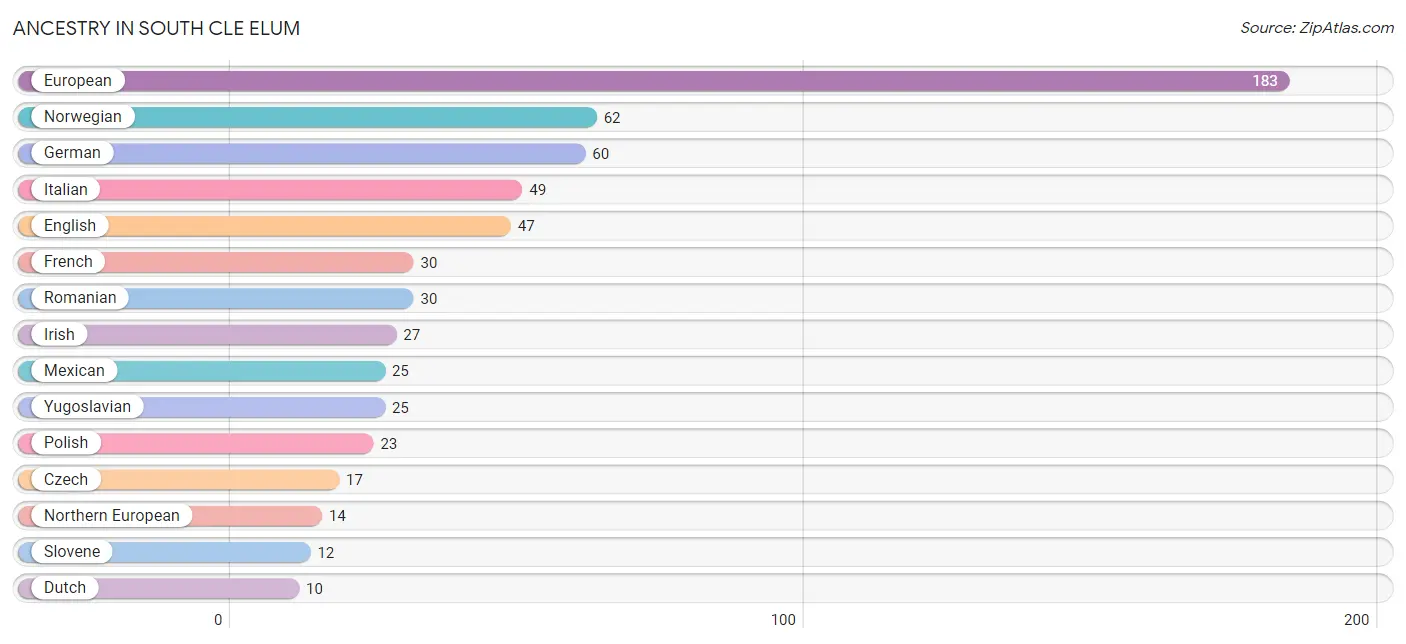
| Ancestry | # Population | % Population |
| Czech | 17 | 2.4% |
| Dutch | 10 | 1.4% |
| English | 47 | 6.6% |
| European | 183 | 25.6% |
| French | 30 | 4.2% |
| French Canadian | 9 | 1.3% |
| German | 60 | 8.4% |
| Hungarian | 9 | 1.3% |
| Irish | 27 | 3.8% |
| Italian | 49 | 6.9% |
| Mexican | 25 | 3.5% |
| Northern European | 14 | 2.0% |
| Norwegian | 62 | 8.7% |
| Osage | 6 | 0.8% |
| Pennsylvania German | 7 | 1.0% |
| Polish | 23 | 3.2% |
| Puget Sound Salish | 6 | 0.8% |
| Romanian | 30 | 4.2% |
| Scotch-Irish | 9 | 1.3% |
| Scottish | 7 | 1.0% |
| Slovene | 12 | 1.7% |
| Spanish | 9 | 1.3% |
| Swedish | 9 | 1.3% |
| Yugoslavian | 25 | 3.5% | View All 24 Rows |
Immigrants in South Cle Elum
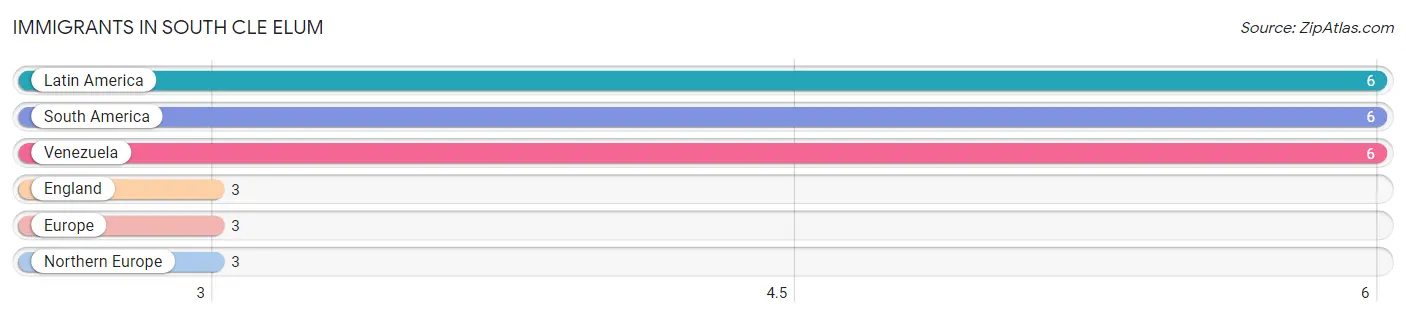
The most numerous immigrant groups reported in South Cle Elum came from Latin America (6 | 0.8%), South America (6 | 0.8%), Venezuela (6 | 0.8%), England (3 | 0.4%), and Europe (3 | 0.4%), together accounting for 3.4% of all South Cle Elum residents.
| Immigration Origin | # Population | % Population |
| England | 3 | 0.4% |
| Europe | 3 | 0.4% |
| Latin America | 6 | 0.8% |
| Northern Europe | 3 | 0.4% |
| South America | 6 | 0.8% |
| Venezuela | 6 | 0.8% | View All 6 Rows |
Sex and Age in South Cle Elum
Sex and Age in South Cle Elum
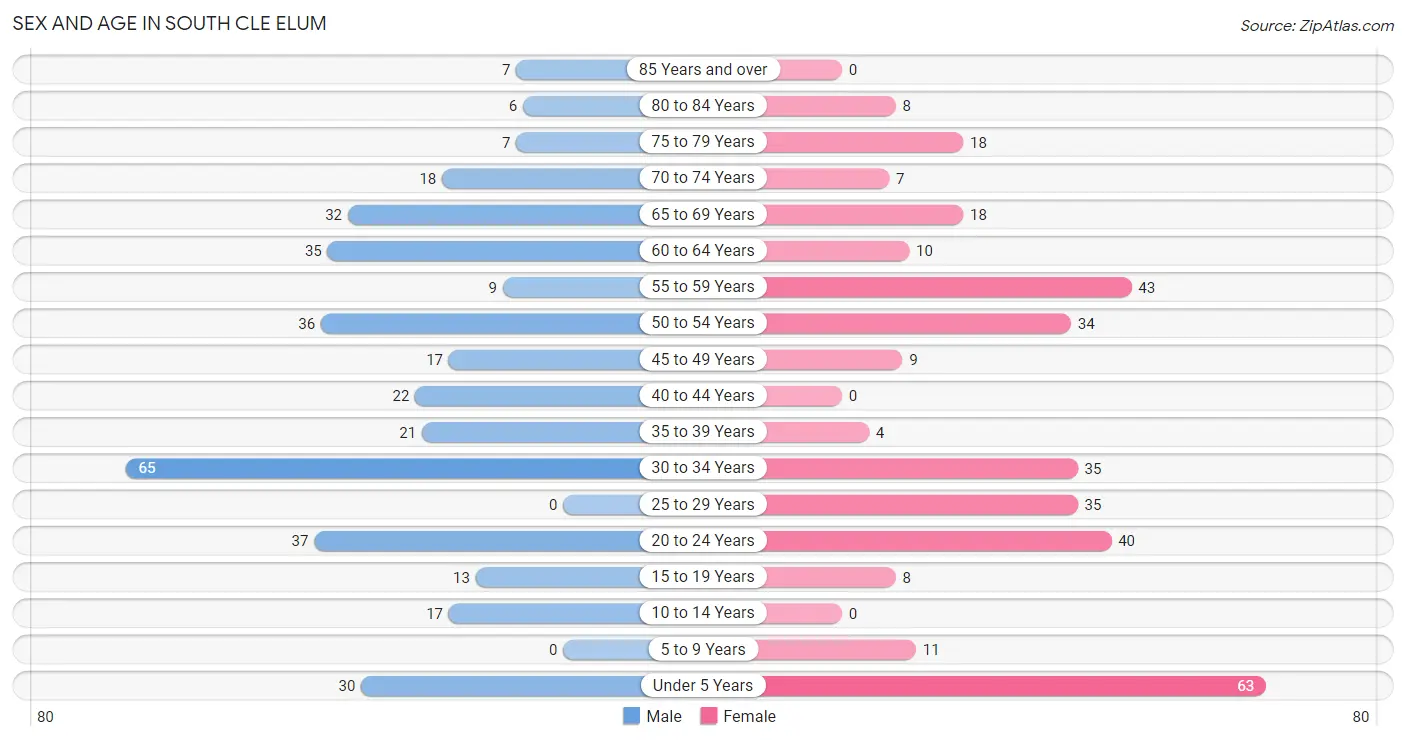
The most populous age groups in South Cle Elum are 30 to 34 Years (65 | 17.5%) for men and Under 5 Years (63 | 18.4%) for women.
| Age Bracket | Male | Female |
| Under 5 Years | 30 (8.1%) | 63 (18.4%) |
| 5 to 9 Years | 0 (0.0%) | 11 (3.2%) |
| 10 to 14 Years | 17 (4.6%) | 0 (0.0%) |
| 15 to 19 Years | 13 (3.5%) | 8 (2.3%) |
| 20 to 24 Years | 37 (10.0%) | 40 (11.7%) |
| 25 to 29 Years | 0 (0.0%) | 35 (10.2%) |
| 30 to 34 Years | 65 (17.5%) | 35 (10.2%) |
| 35 to 39 Years | 21 (5.7%) | 4 (1.2%) |
| 40 to 44 Years | 22 (5.9%) | 0 (0.0%) |
| 45 to 49 Years | 17 (4.6%) | 9 (2.6%) |
| 50 to 54 Years | 36 (9.7%) | 34 (9.9%) |
| 55 to 59 Years | 9 (2.4%) | 43 (12.5%) |
| 60 to 64 Years | 35 (9.4%) | 10 (2.9%) |
| 65 to 69 Years | 32 (8.6%) | 18 (5.2%) |
| 70 to 74 Years | 18 (4.8%) | 7 (2.0%) |
| 75 to 79 Years | 7 (1.9%) | 18 (5.2%) |
| 80 to 84 Years | 6 (1.6%) | 8 (2.3%) |
| 85 Years and over | 7 (1.9%) | 0 (0.0%) |
| Total | 372 (100.0%) | 343 (100.0%) |
Families and Households in South Cle Elum
Median Family Size in South Cle Elum
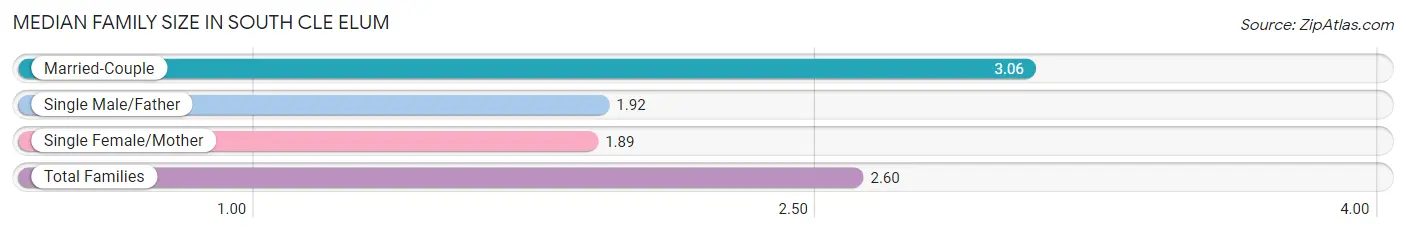
The median family size in South Cle Elum is 2.60 persons per family, with married-couple families (125 | 59.5%) accounting for the largest median family size of 3.06 persons per family. On the other hand, single female/mother families (46 | 21.9%) represent the smallest median family size with 1.89 persons per family.
| Family Type | # Families | Family Size |
| Married-Couple | 125 (59.5%) | 3.06 |
| Single Male/Father | 39 (18.6%) | 1.92 |
| Single Female/Mother | 46 (21.9%) | 1.89 |
| Total Families | 210 (100.0%) | 2.60 |
Median Household Size in South Cle Elum
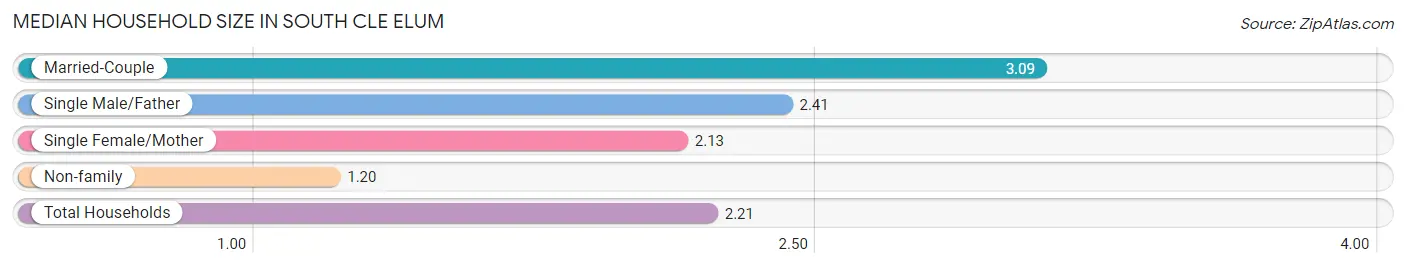
The median household size in South Cle Elum is 2.21 persons per household, with married-couple households (125 | 38.6%) accounting for the largest median household size of 3.09 persons per household. non-family households (114 | 35.2%) represent the smallest median household size with 1.20 persons per household.
| Household Type | # Households | Household Size |
| Married-Couple | 125 (38.6%) | 3.09 |
| Single Male/Father | 39 (12.0%) | 2.41 |
| Single Female/Mother | 46 (14.2%) | 2.13 |
| Non-family | 114 (35.2%) | 1.20 |
| Total Households | 324 (100.0%) | 2.21 |
Household Size by Marriage Status in South Cle Elum
Out of a total of 324 households in South Cle Elum, 210 (64.8%) are family households, while 114 (35.2%) are nonfamily households. The most numerous type of family households are 2-person households, comprising 111, and the most common type of nonfamily households are 1-person households, comprising 92.
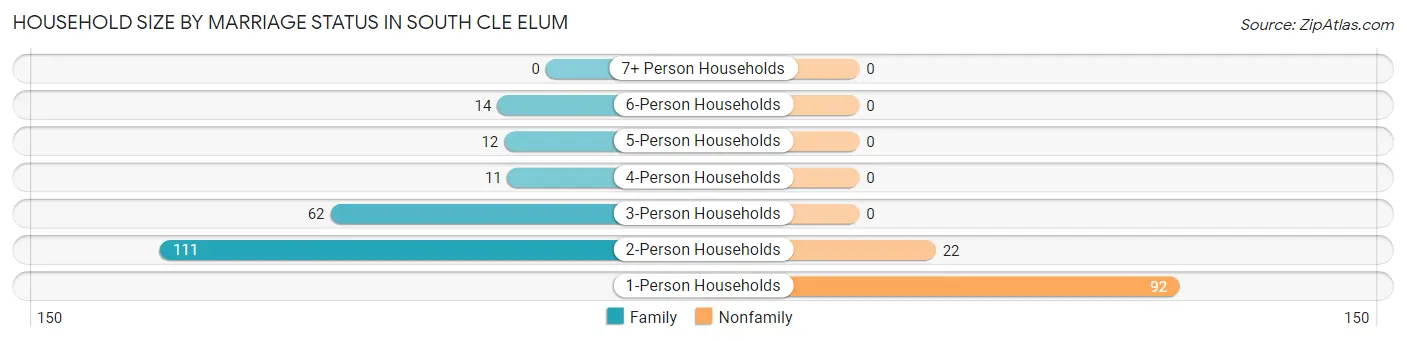
| Household Size | Family Households | Nonfamily Households |
| 1-Person Households | - | 92 (28.4%) |
| 2-Person Households | 111 (34.3%) | 22 (6.8%) |
| 3-Person Households | 62 (19.1%) | 0 (0.0%) |
| 4-Person Households | 11 (3.4%) | 0 (0.0%) |
| 5-Person Households | 12 (3.7%) | 0 (0.0%) |
| 6-Person Households | 14 (4.3%) | 0 (0.0%) |
| 7+ Person Households | 0 (0.0%) | 0 (0.0%) |
| Total | 210 (64.8%) | 114 (35.2%) |
Female Fertility in South Cle Elum
Fertility by Age in South Cle Elum
| Age Bracket | Women with Births | Births / 1,000 Women |
| 15 to 19 years | 0 (0.0%) | 0.0 |
| 20 to 34 years | 0 (0.0%) | 0.0 |
| 35 to 50 years | 0 (0.0%) | 0.0 |
| Total | 0 (0.0%) | 0.0 |
Fertility by Age by Marriage Status in South Cle Elum
| Age Bracket | Married | Unmarried |
| 15 to 19 years | 0 (0.0%) | 0 (0.0%) |
| 20 to 34 years | 0 (0.0%) | 0 (0.0%) |
| 35 to 50 years | 0 (0.0%) | 0 (0.0%) |
| Total | 0 (0.0%) | 0 (0.0%) |
Fertility by Education in South Cle Elum
| Educational Attainment | Women with Births | Births / 1,000 Women |
| Less than High School | 0 (0.0%) | 0.0 |
| High School Diploma | 0 (0.0%) | 0.0 |
| College or Associate's Degree | 0 (0.0%) | 0.0 |
| Bachelor's Degree | 0 (0.0%) | 0.0 |
| Graduate Degree | 0 (0.0%) | 0.0 |
| Total | 0 (0.0%) | 0.0 |
Fertility by Education by Marriage Status in South Cle Elum
| Educational Attainment | Married | Unmarried |
| Less than High School | 0 (0.0%) | 0 (0.0%) |
| High School Diploma | 0 (0.0%) | 0 (0.0%) |
| College or Associate's Degree | 0 (0.0%) | 0 (0.0%) |
| Bachelor's Degree | 0 (0.0%) | 0 (0.0%) |
| Graduate Degree | 0 (0.0%) | 0 (0.0%) |
| Total | 0 (0.0%) | 0 (0.0%) |
Employment Characteristics in South Cle Elum
Employment by Class of Employer in South Cle Elum
Among the 330 employed individuals in South Cle Elum, private company employees (253 | 76.7%), not-for-profit organizations (20 | 6.1%), and self-employed (not incorporated) (18 | 5.4%) make up the most common classes of employment.
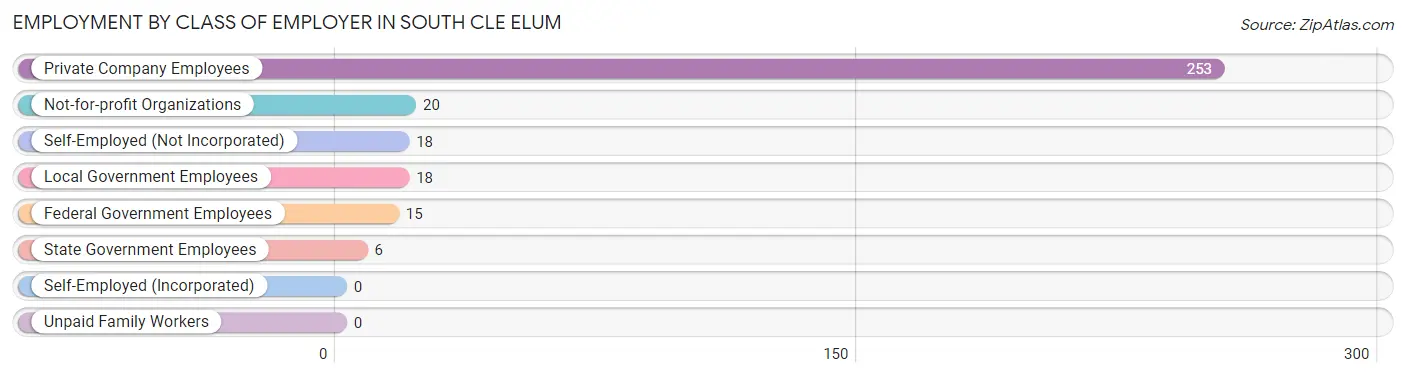
| Employer Class | # Employees | % Employees |
| Private Company Employees | 253 | 76.7% |
| Self-Employed (Incorporated) | 0 | 0.0% |
| Self-Employed (Not Incorporated) | 18 | 5.4% |
| Not-for-profit Organizations | 20 | 6.1% |
| Local Government Employees | 18 | 5.4% |
| State Government Employees | 6 | 1.8% |
| Federal Government Employees | 15 | 4.5% |
| Unpaid Family Workers | 0 | 0.0% |
| Total | 330 | 100.0% |
Employment Status by Age in South Cle Elum
According to the labor force statistics for South Cle Elum, out of the total population over 16 years of age (594), 65.7% or 390 individuals are in the labor force, with 7.7% or 30 of them unemployed. The age group with the highest labor force participation rate is 25 to 29 years, with 100.0% or 35 individuals in the labor force. Within the labor force, the 35 to 44 years age range has the highest percentage of unemployed individuals, with 73.3% or 22 of them being unemployed.
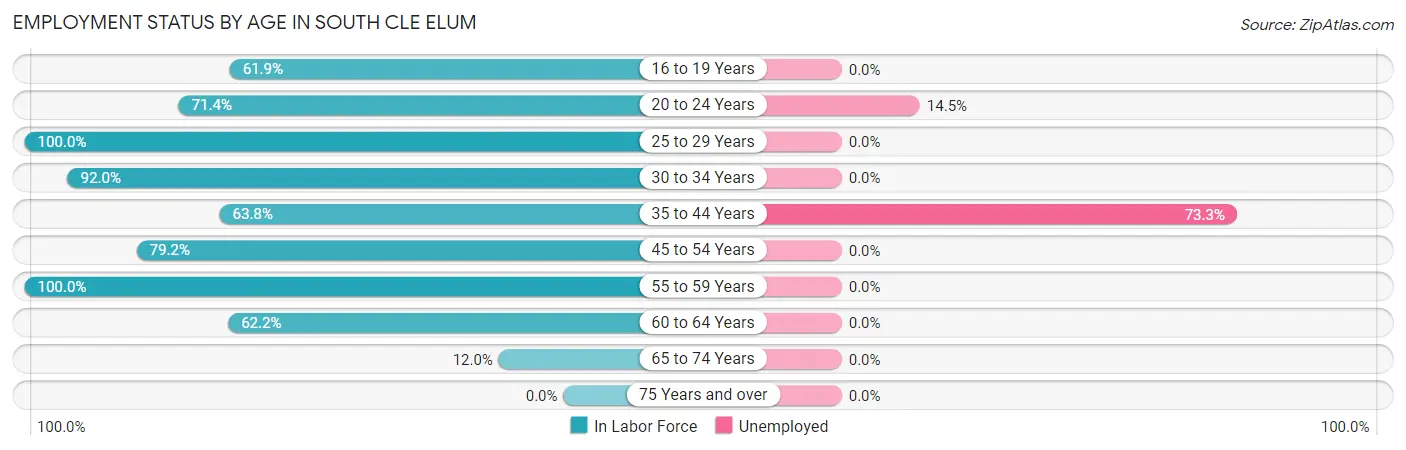
| Age Bracket | In Labor Force | Unemployed |
| 16 to 19 Years | 13 (61.9%) | 0 (0.0%) |
| 20 to 24 Years | 55 (71.4%) | 8 (14.5%) |
| 25 to 29 Years | 35 (100.0%) | 0 (0.0%) |
| 30 to 34 Years | 92 (92.0%) | 0 (0.0%) |
| 35 to 44 Years | 30 (63.8%) | 22 (73.3%) |
| 45 to 54 Years | 76 (79.2%) | 0 (0.0%) |
| 55 to 59 Years | 52 (100.0%) | 0 (0.0%) |
| 60 to 64 Years | 28 (62.2%) | 0 (0.0%) |
| 65 to 74 Years | 9 (12.0%) | 0 (0.0%) |
| 75 Years and over | 0 (0.0%) | 0 (0.0%) |
| Total | 390 (65.7%) | 30 (7.7%) |
Employment Status by Educational Attainment in South Cle Elum
According to labor force statistics for South Cle Elum, 83.5% of individuals (313) out of the total population between 25 and 64 years of age (375) are in the labor force, with 7.0% or 22 of them being unemployed. The group with the highest labor force participation rate are those with the educational attainment of bachelor's degree or higher, with 100.0% or 87 individuals in the labor force. Within the labor force, individuals with less than high school education have the highest percentage of unemployment, with 62.9% or 22 of them being unemployed.
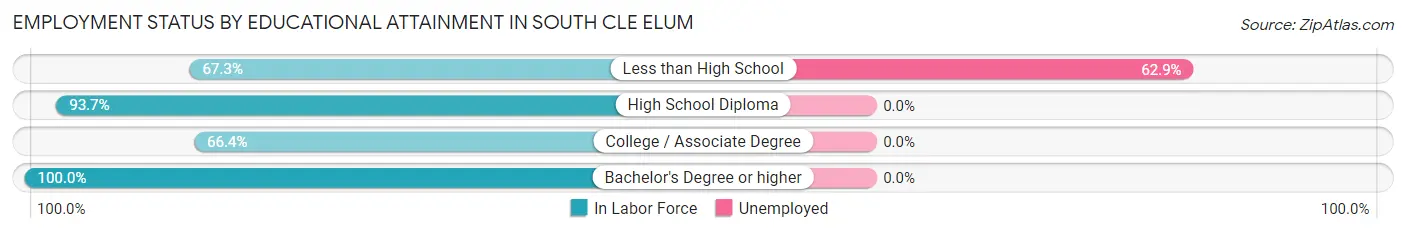
| Educational Attainment | In Labor Force | Unemployed |
| Less than High School | 35 (67.3%) | 33 (62.9%) |
| High School Diploma | 118 (93.7%) | 0 (0.0%) |
| College / Associate Degree | 73 (66.4%) | 0 (0.0%) |
| Bachelor's Degree or higher | 87 (100.0%) | 0 (0.0%) |
| Total | 313 (83.5%) | 26 (7.0%) |
Employment Occupations by Sex in South Cle Elum
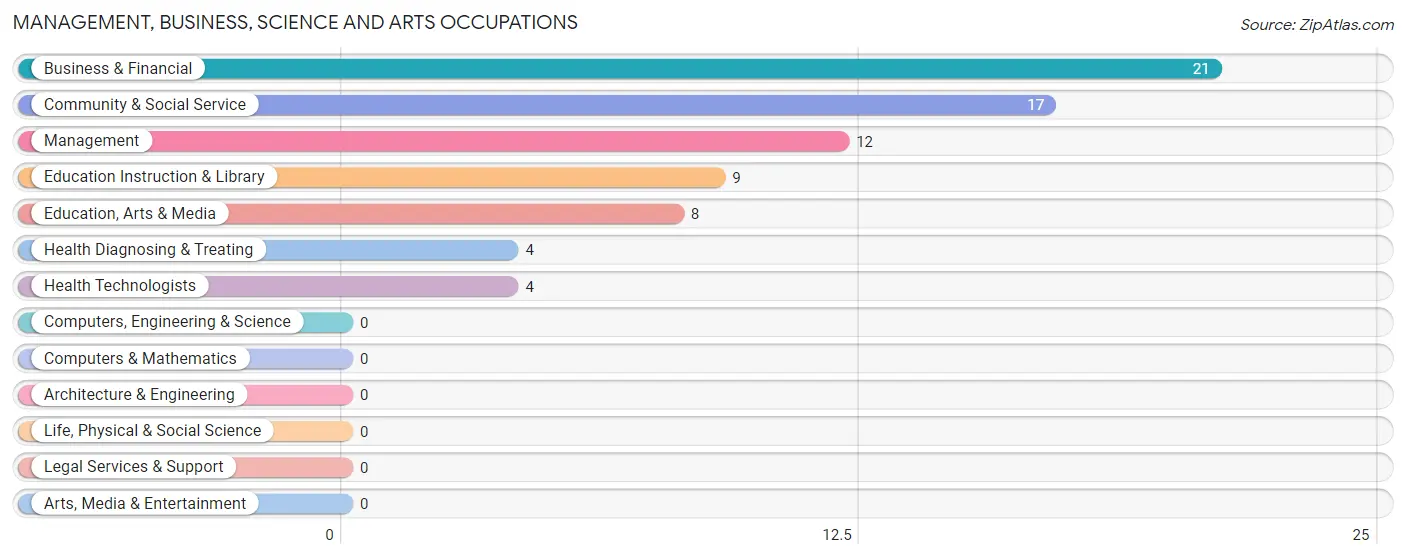
Management, Business, Science and Arts Occupations
The most common Management, Business, Science and Arts occupations in South Cle Elum are Business & Financial (21 | 5.8%), Community & Social Service (17 | 4.7%), Management (12 | 3.3%), Education Instruction & Library (9 | 2.5%), and Education, Arts & Media (8 | 2.2%).
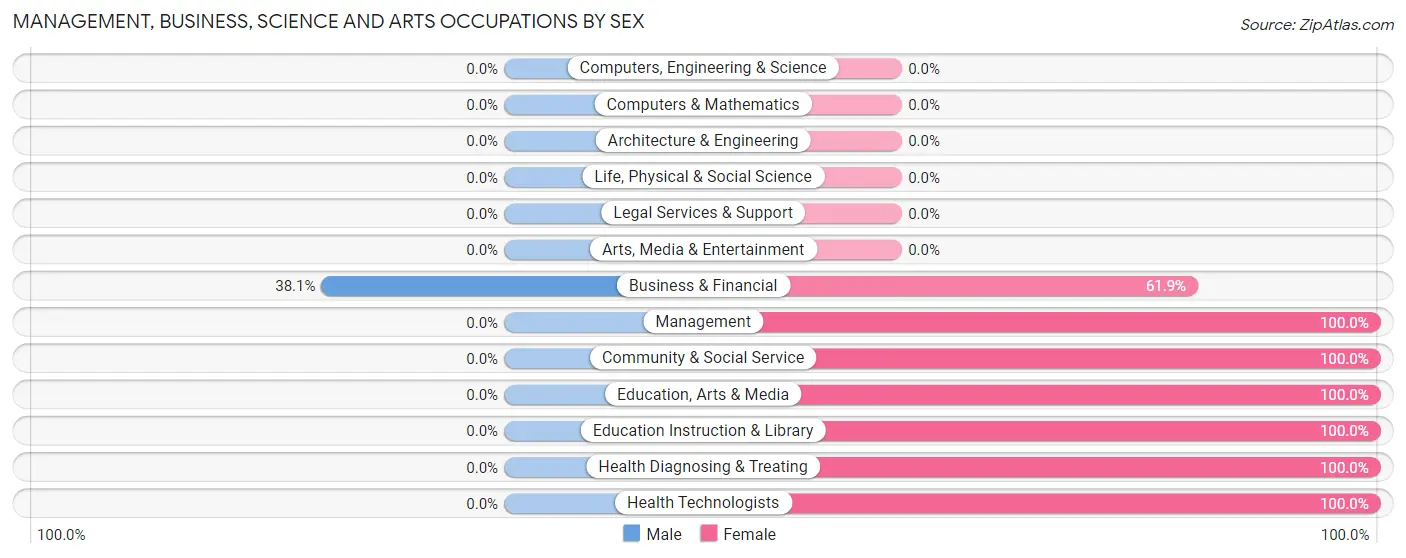
Management, Business, Science and Arts Occupations by Sex
| Occupation | Male | Female |
| Management | 0 (0.0%) | 12 (100.0%) |
| Business & Financial | 8 (38.1%) | 13 (61.9%) |
| Computers, Engineering & Science | 0 (0.0%) | 0 (0.0%) |
| Computers & Mathematics | 0 (0.0%) | 0 (0.0%) |
| Architecture & Engineering | 0 (0.0%) | 0 (0.0%) |
| Life, Physical & Social Science | 0 (0.0%) | 0 (0.0%) |
| Community & Social Service | 0 (0.0%) | 17 (100.0%) |
| Education, Arts & Media | 0 (0.0%) | 8 (100.0%) |
| Legal Services & Support | 0 (0.0%) | 0 (0.0%) |
| Education Instruction & Library | 0 (0.0%) | 9 (100.0%) |
| Arts, Media & Entertainment | 0 (0.0%) | 0 (0.0%) |
| Health Diagnosing & Treating | 0 (0.0%) | 4 (100.0%) |
| Health Technologists | 0 (0.0%) | 4 (100.0%) |
| Total (Category) | 8 (14.8%) | 46 (85.2%) |
| Total (Overall) | 165 (45.8%) | 195 (54.2%) |
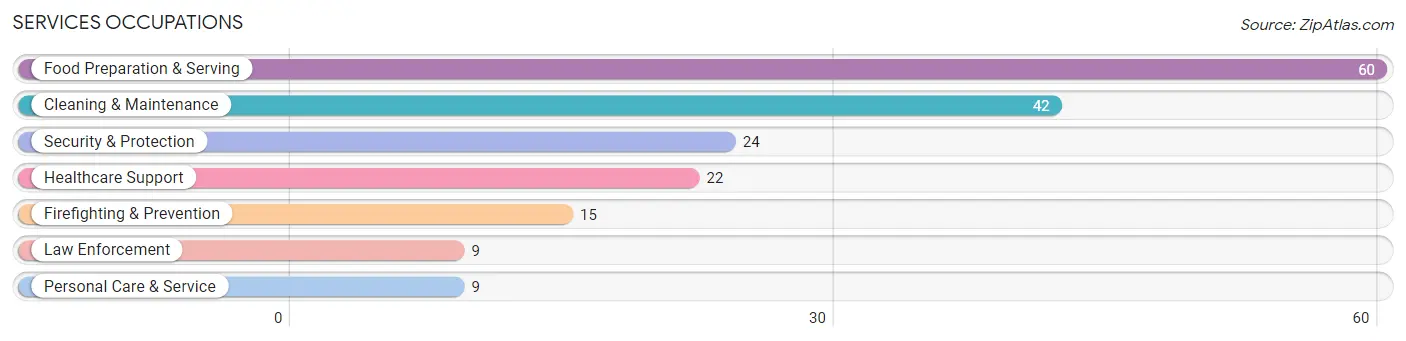
Services Occupations
The most common Services occupations in South Cle Elum are Food Preparation & Serving (60 | 16.7%), Cleaning & Maintenance (42 | 11.7%), Security & Protection (24 | 6.7%), Healthcare Support (22 | 6.1%), and Firefighting & Prevention (15 | 4.2%).
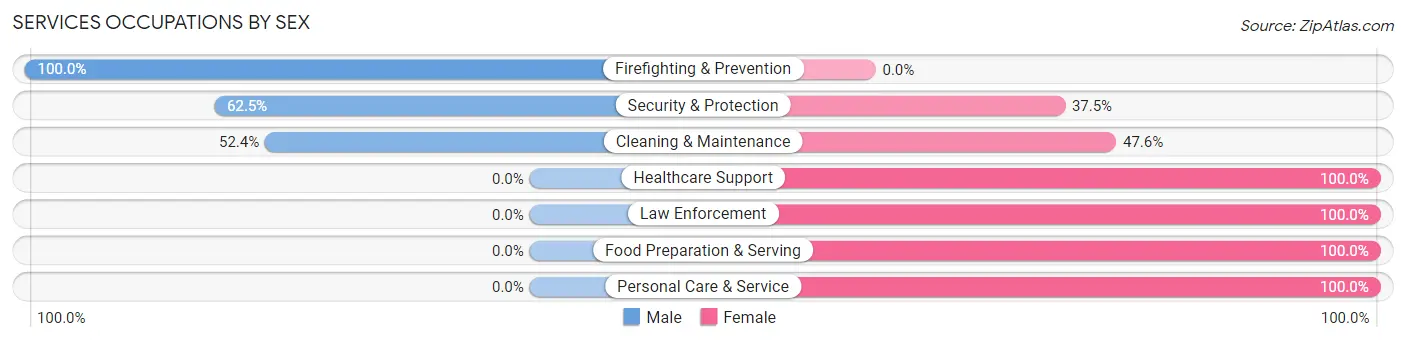
Services Occupations by Sex
Within the Services occupations in South Cle Elum, the most male-oriented occupations are Firefighting & Prevention (100.0%), Security & Protection (62.5%), and Cleaning & Maintenance (52.4%), while the most female-oriented occupations are Healthcare Support (100.0%), Law Enforcement (100.0%), and Food Preparation & Serving (100.0%).
| Occupation | Male | Female |
| Healthcare Support | 0 (0.0%) | 22 (100.0%) |
| Security & Protection | 15 (62.5%) | 9 (37.5%) |
| Firefighting & Prevention | 15 (100.0%) | 0 (0.0%) |
| Law Enforcement | 0 (0.0%) | 9 (100.0%) |
| Food Preparation & Serving | 0 (0.0%) | 60 (100.0%) |
| Cleaning & Maintenance | 22 (52.4%) | 20 (47.6%) |
| Personal Care & Service | 0 (0.0%) | 9 (100.0%) |
| Total (Category) | 37 (23.6%) | 120 (76.4%) |
| Total (Overall) | 165 (45.8%) | 195 (54.2%) |
Sales and Office Occupations
The most common Sales and Office occupations in South Cle Elum are , and Office & Administration (41 | 11.4%).
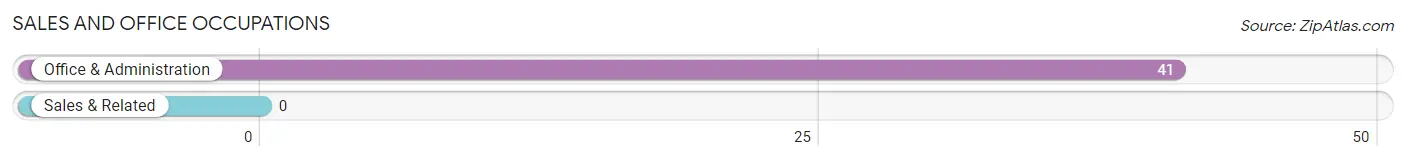
Sales and Office Occupations by Sex
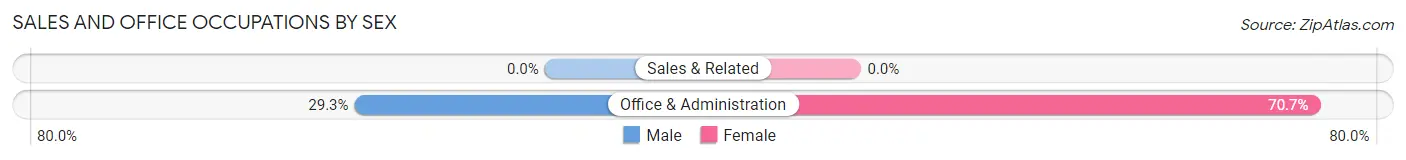
| Occupation | Male | Female |
| Sales & Related | 0 (0.0%) | 0 (0.0%) |
| Office & Administration | 12 (29.3%) | 29 (70.7%) |
| Total (Category) | 12 (29.3%) | 29 (70.7%) |
| Total (Overall) | 165 (45.8%) | 195 (54.2%) |
Natural Resources, Construction and Maintenance Occupations
The most common Natural Resources, Construction and Maintenance occupations in South Cle Elum are Construction & Extraction (32 | 8.9%), and Farming, Fishing & Forestry (10 | 2.8%).
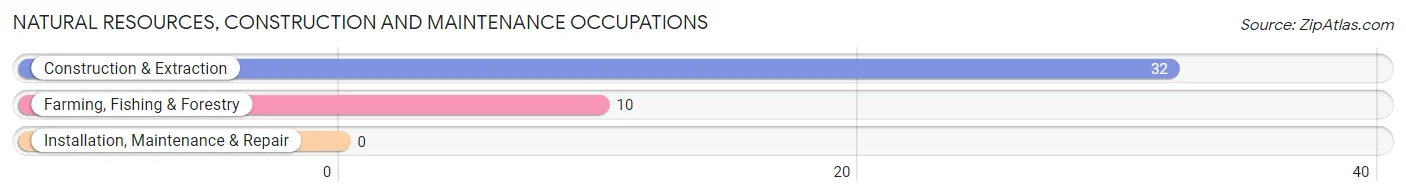
Natural Resources, Construction and Maintenance Occupations by Sex
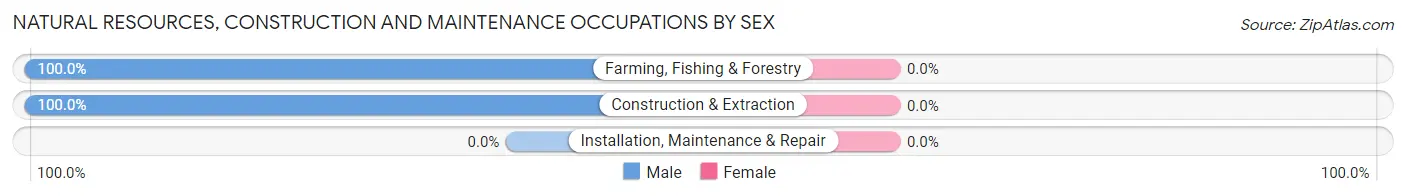
| Occupation | Male | Female |
| Farming, Fishing & Forestry | 10 (100.0%) | 0 (0.0%) |
| Construction & Extraction | 32 (100.0%) | 0 (0.0%) |
| Installation, Maintenance & Repair | 0 (0.0%) | 0 (0.0%) |
| Total (Category) | 42 (100.0%) | 0 (0.0%) |
| Total (Overall) | 165 (45.8%) | 195 (54.2%) |
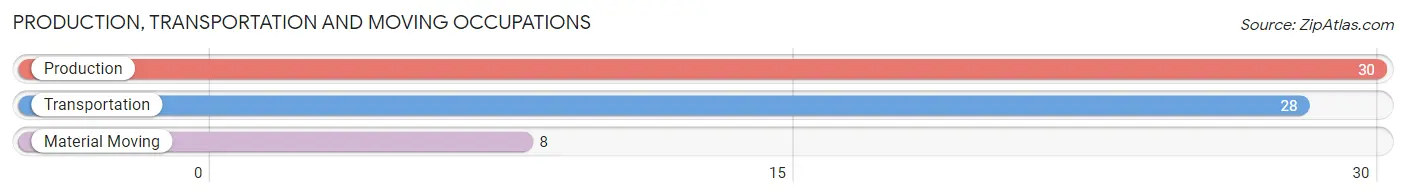
Production, Transportation and Moving Occupations
The most common Production, Transportation and Moving occupations in South Cle Elum are Production (30 | 8.3%), Transportation (28 | 7.8%), and Material Moving (8 | 2.2%).
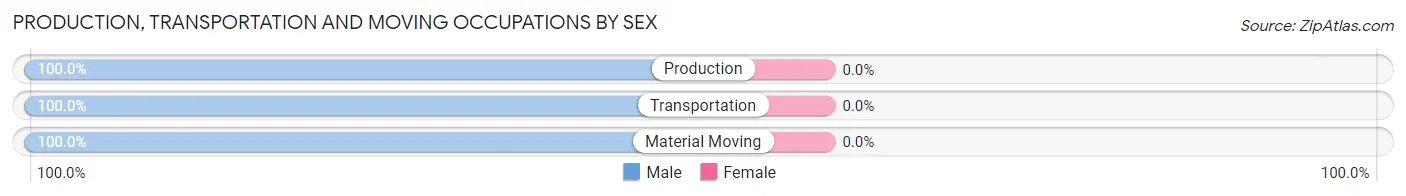
Production, Transportation and Moving Occupations by Sex
| Occupation | Male | Female |
| Production | 30 (100.0%) | 0 (0.0%) |
| Transportation | 28 (100.0%) | 0 (0.0%) |
| Material Moving | 8 (100.0%) | 0 (0.0%) |
| Total (Category) | 66 (100.0%) | 0 (0.0%) |
| Total (Overall) | 165 (45.8%) | 195 (54.2%) |
Employment Industries by Sex in South Cle Elum
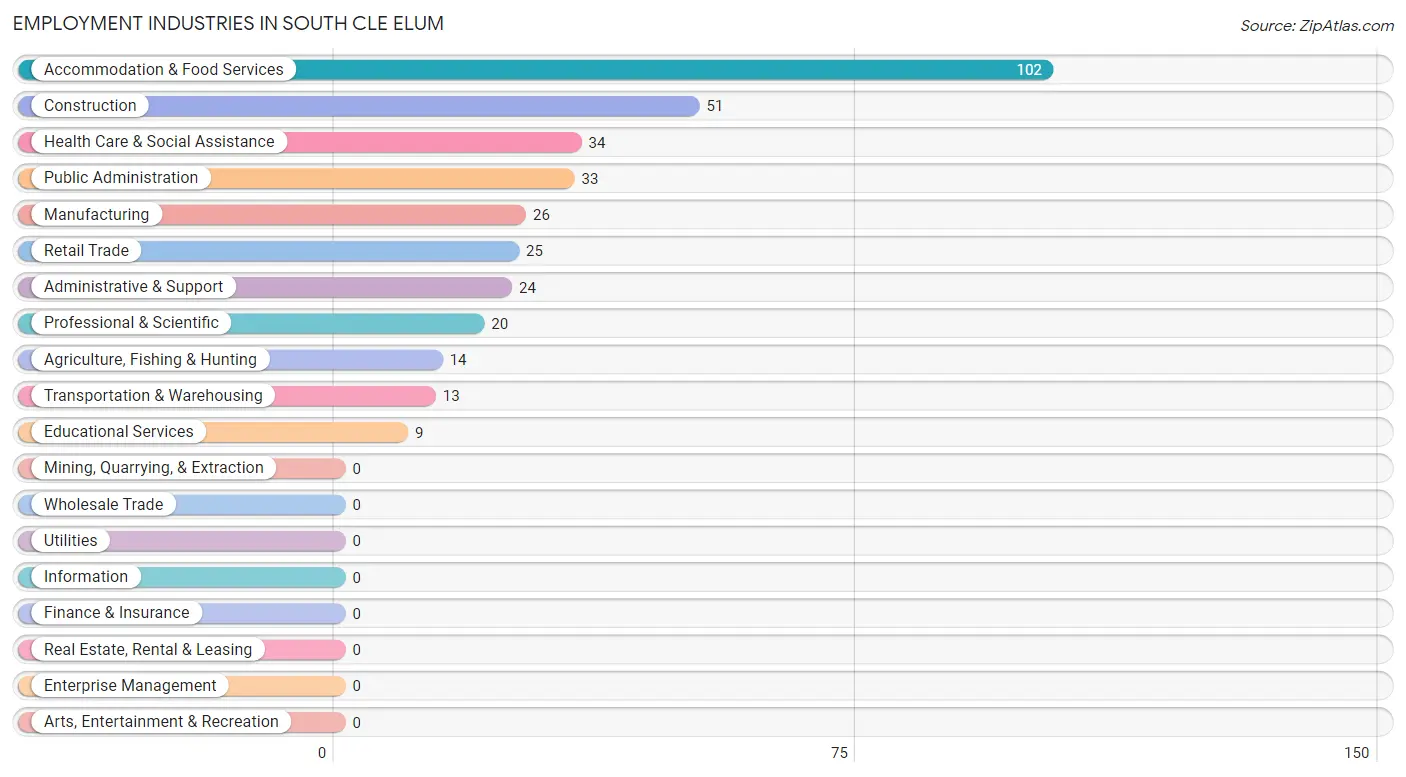
Employment Industries in South Cle Elum
The major employment industries in South Cle Elum include Accommodation & Food Services (102 | 28.3%), Construction (51 | 14.2%), Health Care & Social Assistance (34 | 9.4%), Public Administration (33 | 9.2%), and Manufacturing (26 | 7.2%).
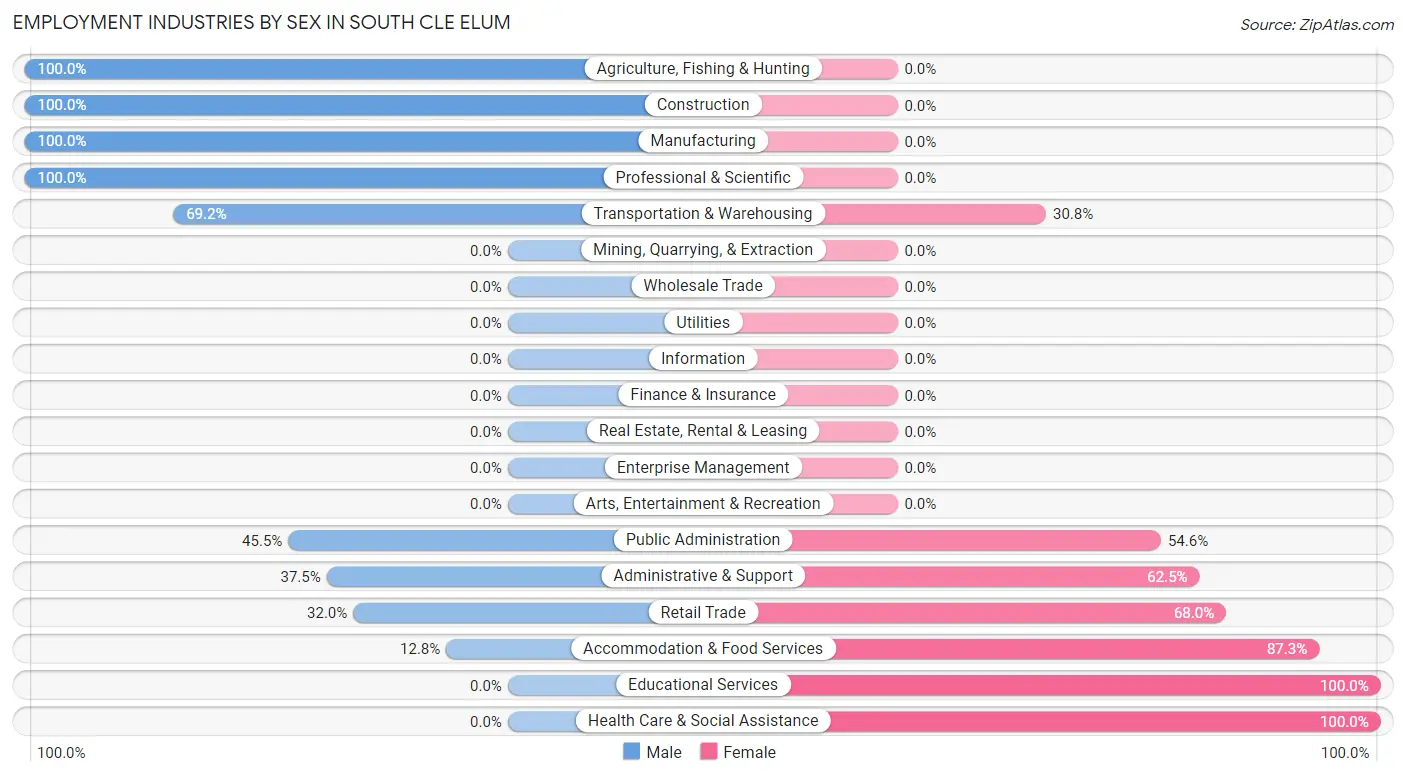
Employment Industries by Sex in South Cle Elum
The South Cle Elum industries that see more men than women are Agriculture, Fishing & Hunting (100.0%), Construction (100.0%), and Manufacturing (100.0%), whereas the industries that tend to have a higher number of women are Educational Services (100.0%), Health Care & Social Assistance (100.0%), and Accommodation & Food Services (87.3%).
| Industry | Male | Female |
| Agriculture, Fishing & Hunting | 14 (100.0%) | 0 (0.0%) |
| Mining, Quarrying, & Extraction | 0 (0.0%) | 0 (0.0%) |
| Construction | 51 (100.0%) | 0 (0.0%) |
| Manufacturing | 26 (100.0%) | 0 (0.0%) |
| Wholesale Trade | 0 (0.0%) | 0 (0.0%) |
| Retail Trade | 8 (32.0%) | 17 (68.0%) |
| Transportation & Warehousing | 9 (69.2%) | 4 (30.8%) |
| Utilities | 0 (0.0%) | 0 (0.0%) |
| Information | 0 (0.0%) | 0 (0.0%) |
| Finance & Insurance | 0 (0.0%) | 0 (0.0%) |
| Real Estate, Rental & Leasing | 0 (0.0%) | 0 (0.0%) |
| Professional & Scientific | 20 (100.0%) | 0 (0.0%) |
| Enterprise Management | 0 (0.0%) | 0 (0.0%) |
| Administrative & Support | 9 (37.5%) | 15 (62.5%) |
| Educational Services | 0 (0.0%) | 9 (100.0%) |
| Health Care & Social Assistance | 0 (0.0%) | 34 (100.0%) |
| Arts, Entertainment & Recreation | 0 (0.0%) | 0 (0.0%) |
| Accommodation & Food Services | 13 (12.8%) | 89 (87.3%) |
| Public Administration | 15 (45.5%) | 18 (54.5%) |
| Total | 165 (45.8%) | 195 (54.2%) |
Education in South Cle Elum
School Enrollment in South Cle Elum
The most common levels of schooling among the 65 students in South Cle Elum are college / undergraduate (24 | 36.9%), nursery / preschool (15 | 23.1%), and kindergarten (11 | 16.9%).
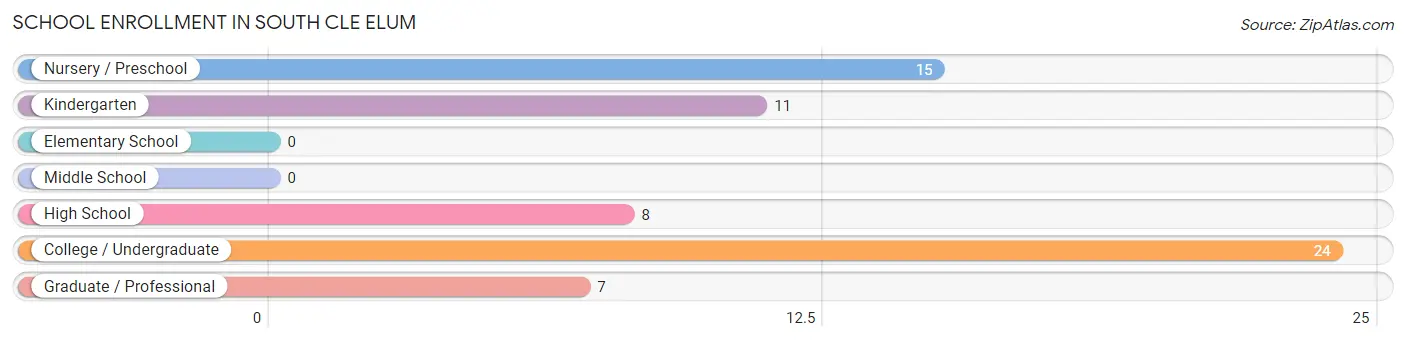
| School Level | # Students | % Students |
| Nursery / Preschool | 15 | 23.1% |
| Kindergarten | 11 | 16.9% |
| Elementary School | 0 | 0.0% |
| Middle School | 0 | 0.0% |
| High School | 8 | 12.3% |
| College / Undergraduate | 24 | 36.9% |
| Graduate / Professional | 7 | 10.8% |
| Total | 65 | 100.0% |
School Enrollment by Age by Funding Source in South Cle Elum
Out of a total of 65 students who are enrolled in schools in South Cle Elum, 7 (10.8%) attend a private institution, while the remaining 58 (89.2%) are enrolled in public schools. The age group of 35 years and over has the highest likelihood of being enrolled in private schools, with 7 (100.0% in the age bracket) enrolled. Conversely, the age group of 3 to 4 year olds has the lowest likelihood of being enrolled in a private school, with 15 (100.0% in the age bracket) attending a public institution.
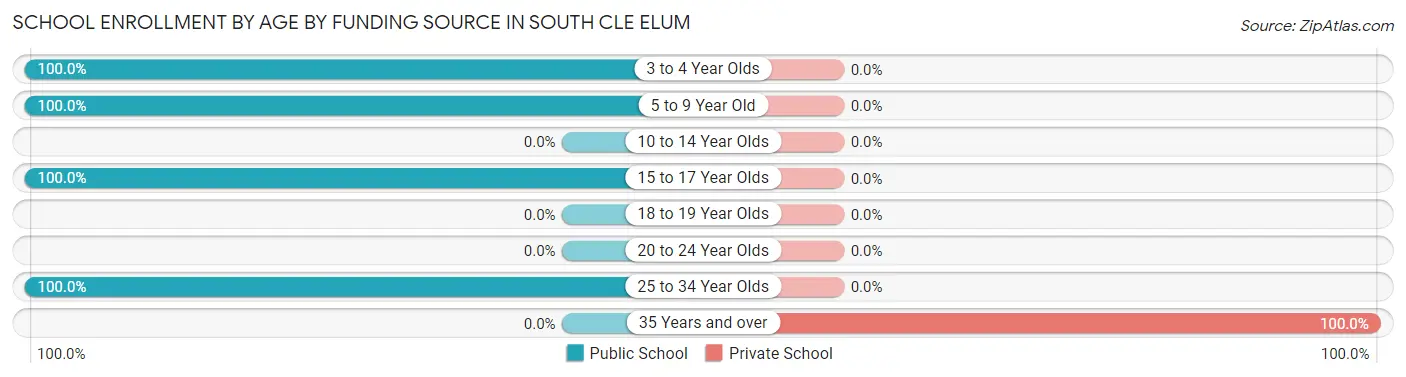
| Age Bracket | Public School | Private School |
| 3 to 4 Year Olds | 15 (100.0%) | 0 (0.0%) |
| 5 to 9 Year Old | 11 (100.0%) | 0 (0.0%) |
| 10 to 14 Year Olds | 0 (0.0%) | 0 (0.0%) |
| 15 to 17 Year Olds | 8 (100.0%) | 0 (0.0%) |
| 18 to 19 Year Olds | 0 (0.0%) | 0 (0.0%) |
| 20 to 24 Year Olds | 0 (0.0%) | 0 (0.0%) |
| 25 to 34 Year Olds | 24 (100.0%) | 0 (0.0%) |
| 35 Years and over | 0 (0.0%) | 7 (100.0%) |
| Total | 58 (89.2%) | 7 (10.8%) |
Educational Attainment by Field of Study in South Cle Elum
Arts & humanities (31 | 25.0%), business (20 | 16.1%), liberal arts & history (15 | 12.1%), science & technology (13 | 10.5%), and education (13 | 10.5%) are the most common fields of study among 124 individuals in South Cle Elum who have obtained a bachelor's degree or higher.
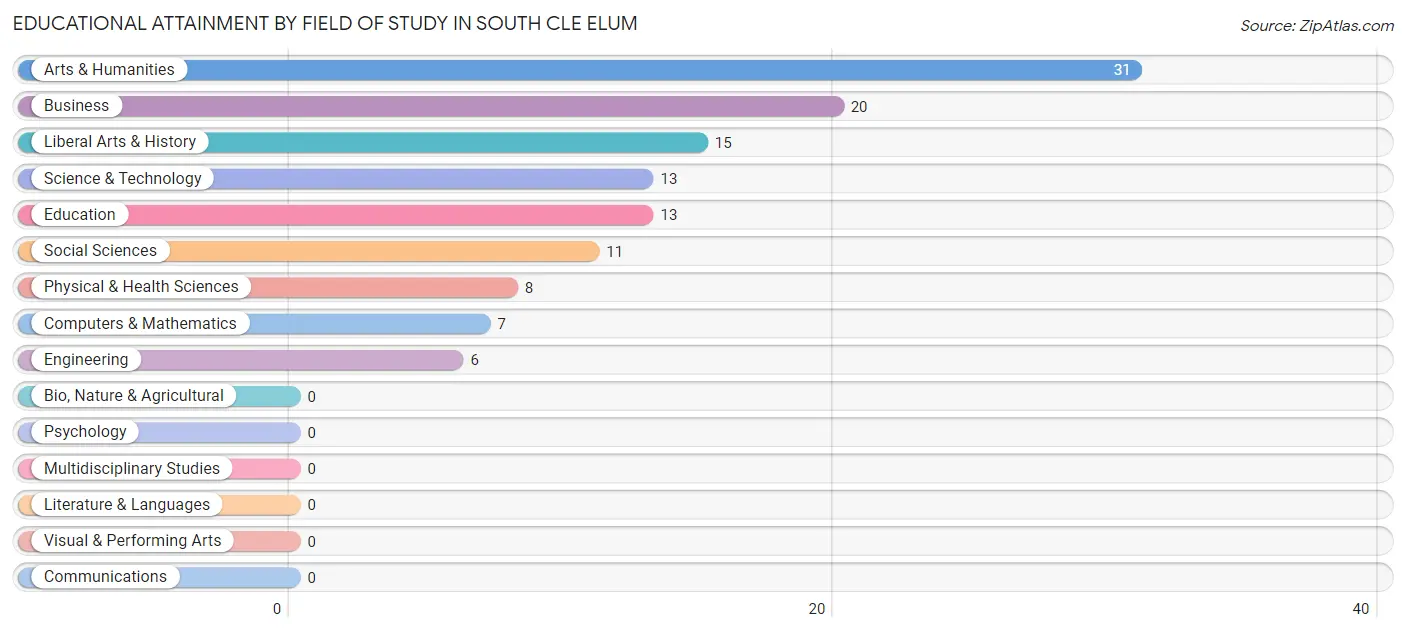
| Field of Study | # Graduates | % Graduates |
| Computers & Mathematics | 7 | 5.7% |
| Bio, Nature & Agricultural | 0 | 0.0% |
| Physical & Health Sciences | 8 | 6.5% |
| Psychology | 0 | 0.0% |
| Social Sciences | 11 | 8.9% |
| Engineering | 6 | 4.8% |
| Multidisciplinary Studies | 0 | 0.0% |
| Science & Technology | 13 | 10.5% |
| Business | 20 | 16.1% |
| Education | 13 | 10.5% |
| Literature & Languages | 0 | 0.0% |
| Liberal Arts & History | 15 | 12.1% |
| Visual & Performing Arts | 0 | 0.0% |
| Communications | 0 | 0.0% |
| Arts & Humanities | 31 | 25.0% |
| Total | 124 | 100.0% |
Transportation & Commute in South Cle Elum
Vehicle Availability by Sex in South Cle Elum
The most prevalent vehicle ownership categories in South Cle Elum are males with 2 vehicles (83, accounting for 50.3%) and females with 2 vehicles (63, making up 50.3%).
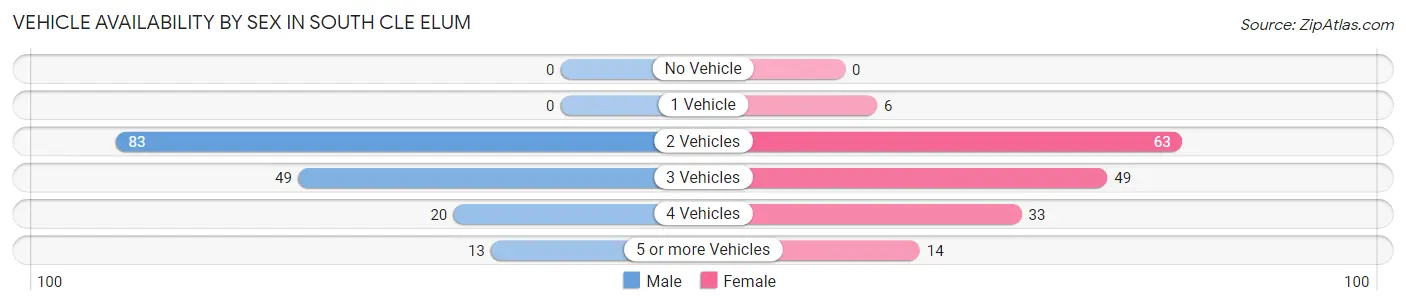
| Vehicles Available | Male | Female |
| No Vehicle | 0 (0.0%) | 0 (0.0%) |
| 1 Vehicle | 0 (0.0%) | 6 (3.6%) |
| 2 Vehicles | 83 (50.3%) | 63 (38.2%) |
| 3 Vehicles | 49 (29.7%) | 49 (29.7%) |
| 4 Vehicles | 20 (12.1%) | 33 (20.0%) |
| 5 or more Vehicles | 13 (7.9%) | 14 (8.5%) |
| Total | 165 (100.0%) | 165 (100.0%) |
Commute Time in South Cle Elum
The most frequently occuring commute durations in South Cle Elum are 5 to 9 minutes (100 commuters, 33.0%), 60 to 89 minutes (52 commuters, 17.2%), and 20 to 24 minutes (31 commuters, 10.2%).
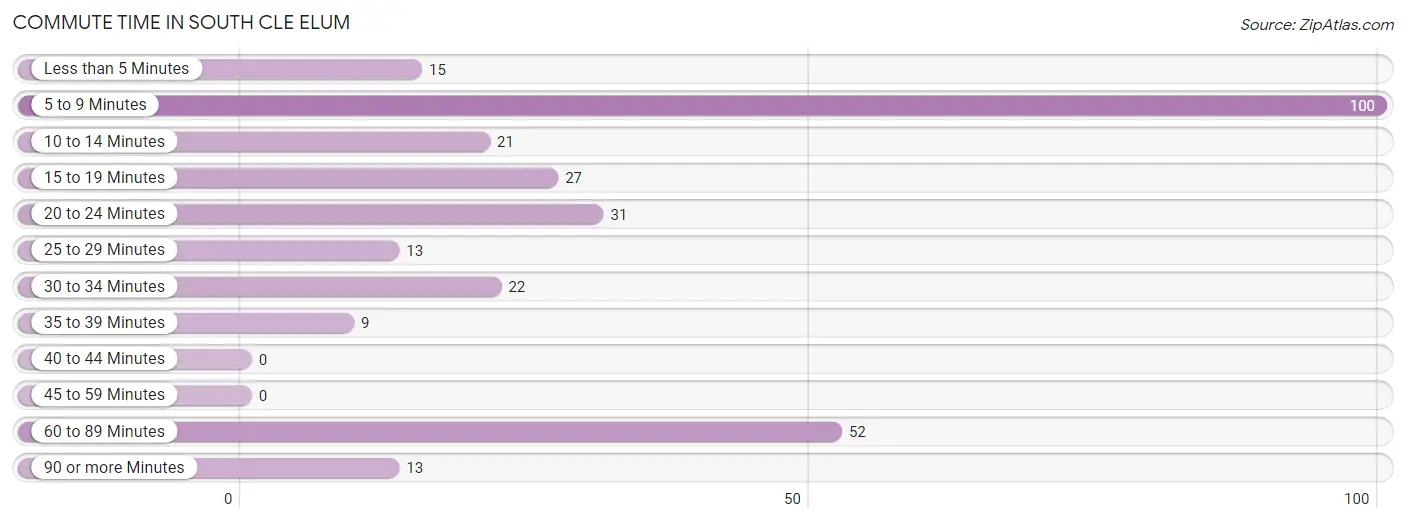
| Commute Time | # Commuters | % Commuters |
| Less than 5 Minutes | 15 | 5.0% |
| 5 to 9 Minutes | 100 | 33.0% |
| 10 to 14 Minutes | 21 | 6.9% |
| 15 to 19 Minutes | 27 | 8.9% |
| 20 to 24 Minutes | 31 | 10.2% |
| 25 to 29 Minutes | 13 | 4.3% |
| 30 to 34 Minutes | 22 | 7.3% |
| 35 to 39 Minutes | 9 | 3.0% |
| 40 to 44 Minutes | 0 | 0.0% |
| 45 to 59 Minutes | 0 | 0.0% |
| 60 to 89 Minutes | 52 | 17.2% |
| 90 or more Minutes | 13 | 4.3% |
Commute Time by Sex in South Cle Elum
The most common commute times in South Cle Elum are 5 to 9 minutes (57 commuters, 37.2%) for males and 5 to 9 minutes (43 commuters, 28.7%) for females.
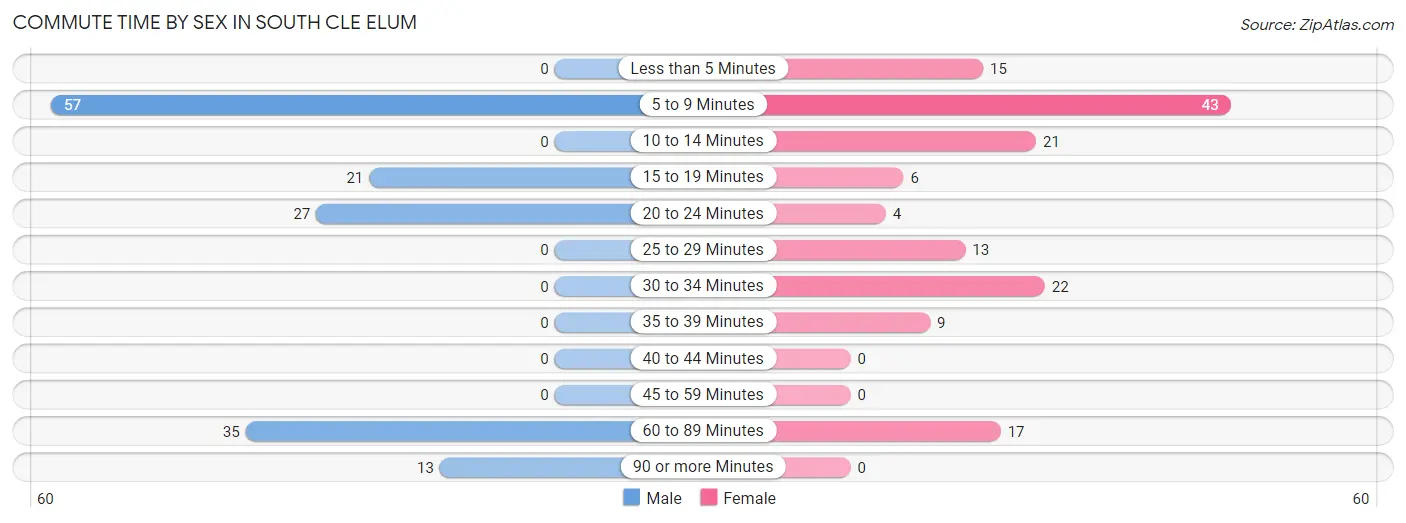
| Commute Time | Male | Female |
| Less than 5 Minutes | 0 (0.0%) | 15 (10.0%) |
| 5 to 9 Minutes | 57 (37.2%) | 43 (28.7%) |
| 10 to 14 Minutes | 0 (0.0%) | 21 (14.0%) |
| 15 to 19 Minutes | 21 (13.7%) | 6 (4.0%) |
| 20 to 24 Minutes | 27 (17.6%) | 4 (2.7%) |
| 25 to 29 Minutes | 0 (0.0%) | 13 (8.7%) |
| 30 to 34 Minutes | 0 (0.0%) | 22 (14.7%) |
| 35 to 39 Minutes | 0 (0.0%) | 9 (6.0%) |
| 40 to 44 Minutes | 0 (0.0%) | 0 (0.0%) |
| 45 to 59 Minutes | 0 (0.0%) | 0 (0.0%) |
| 60 to 89 Minutes | 35 (22.9%) | 17 (11.3%) |
| 90 or more Minutes | 13 (8.5%) | 0 (0.0%) |
Time of Departure to Work by Sex in South Cle Elum
The most frequent times of departure to work in South Cle Elum are 6:30 AM to 6:59 AM (62, 40.5%) for males and 7:00 AM to 7:29 AM (57, 38.0%) for females.
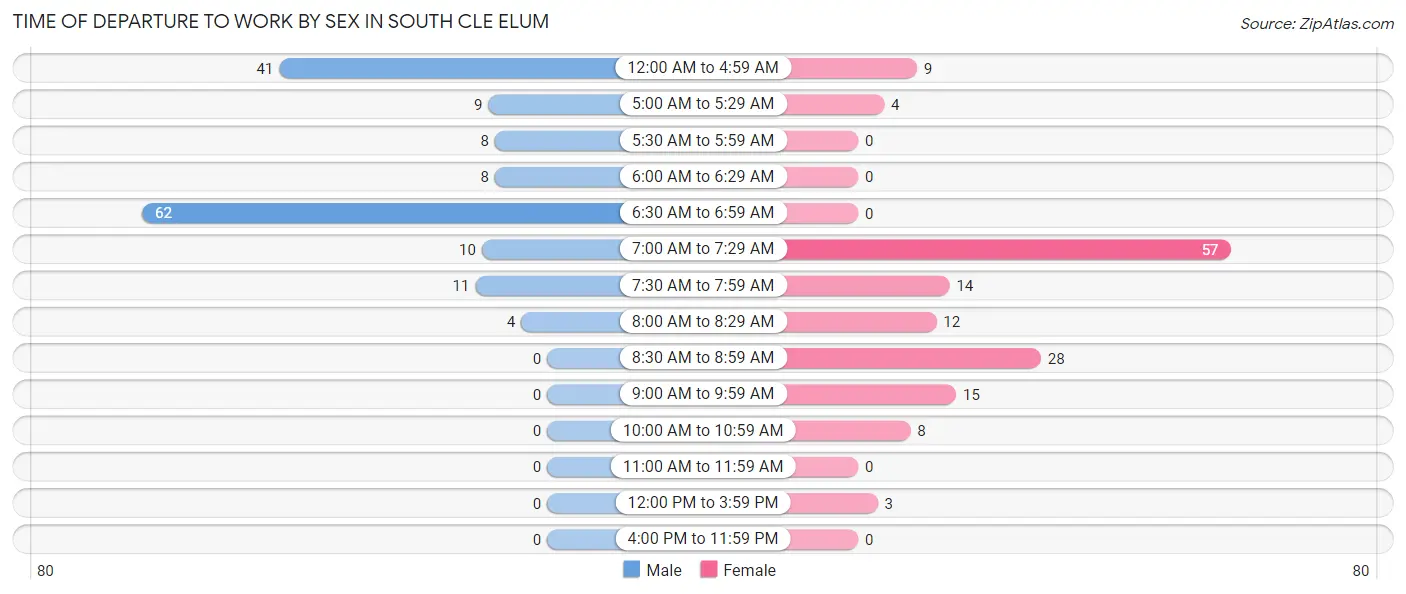
| Time of Departure | Male | Female |
| 12:00 AM to 4:59 AM | 41 (26.8%) | 9 (6.0%) |
| 5:00 AM to 5:29 AM | 9 (5.9%) | 4 (2.7%) |
| 5:30 AM to 5:59 AM | 8 (5.2%) | 0 (0.0%) |
| 6:00 AM to 6:29 AM | 8 (5.2%) | 0 (0.0%) |
| 6:30 AM to 6:59 AM | 62 (40.5%) | 0 (0.0%) |
| 7:00 AM to 7:29 AM | 10 (6.5%) | 57 (38.0%) |
| 7:30 AM to 7:59 AM | 11 (7.2%) | 14 (9.3%) |
| 8:00 AM to 8:29 AM | 4 (2.6%) | 12 (8.0%) |
| 8:30 AM to 8:59 AM | 0 (0.0%) | 28 (18.7%) |
| 9:00 AM to 9:59 AM | 0 (0.0%) | 15 (10.0%) |
| 10:00 AM to 10:59 AM | 0 (0.0%) | 8 (5.3%) |
| 11:00 AM to 11:59 AM | 0 (0.0%) | 0 (0.0%) |
| 12:00 PM to 3:59 PM | 0 (0.0%) | 3 (2.0%) |
| 4:00 PM to 11:59 PM | 0 (0.0%) | 0 (0.0%) |
| Total | 153 (100.0%) | 150 (100.0%) |
Housing Occupancy in South Cle Elum
Occupancy by Ownership in South Cle Elum
Of the total 324 dwellings in South Cle Elum, owner-occupied units account for 193 (59.6%), while renter-occupied units make up 131 (40.4%).
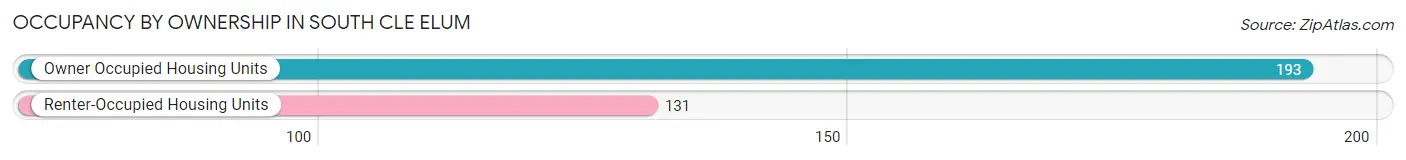
| Occupancy | # Housing Units | % Housing Units |
| Owner Occupied Housing Units | 193 | 59.6% |
| Renter-Occupied Housing Units | 131 | 40.4% |
| Total Occupied Housing Units | 324 | 100.0% |
Occupancy by Household Size in South Cle Elum
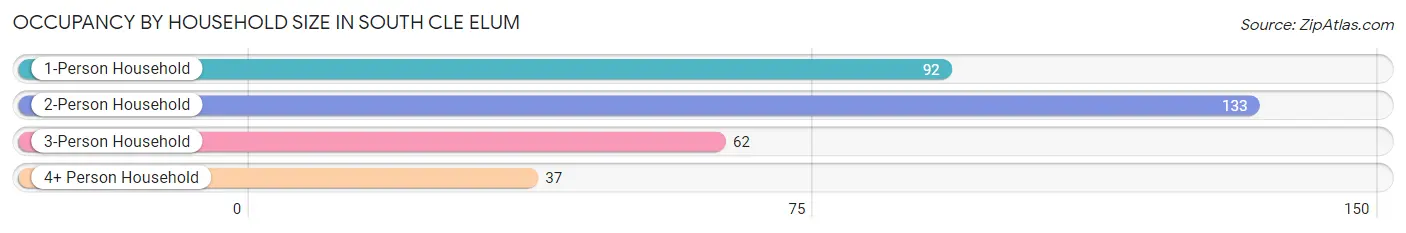
| Household Size | # Housing Units | % Housing Units |
| 1-Person Household | 92 | 28.4% |
| 2-Person Household | 133 | 41.0% |
| 3-Person Household | 62 | 19.1% |
| 4+ Person Household | 37 | 11.4% |
| Total Housing Units | 324 | 100.0% |
Occupancy by Ownership by Household Size in South Cle Elum
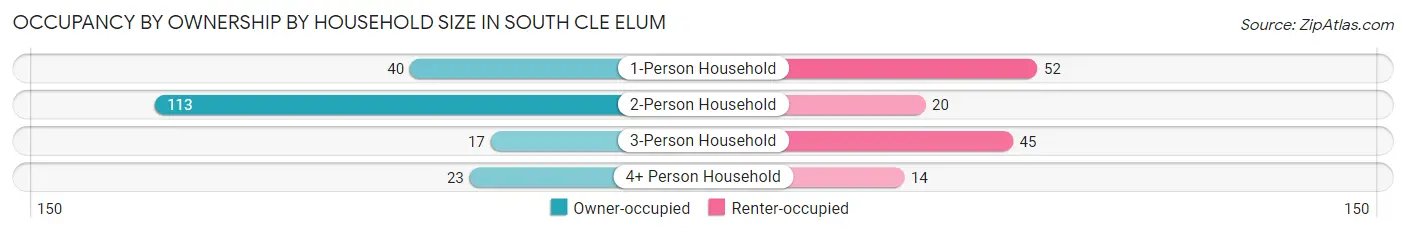
| Household Size | Owner-occupied | Renter-occupied |
| 1-Person Household | 40 (43.5%) | 52 (56.5%) |
| 2-Person Household | 113 (85.0%) | 20 (15.0%) |
| 3-Person Household | 17 (27.4%) | 45 (72.6%) |
| 4+ Person Household | 23 (62.2%) | 14 (37.8%) |
| Total Housing Units | 193 (59.6%) | 131 (40.4%) |
Occupancy by Educational Attainment in South Cle Elum
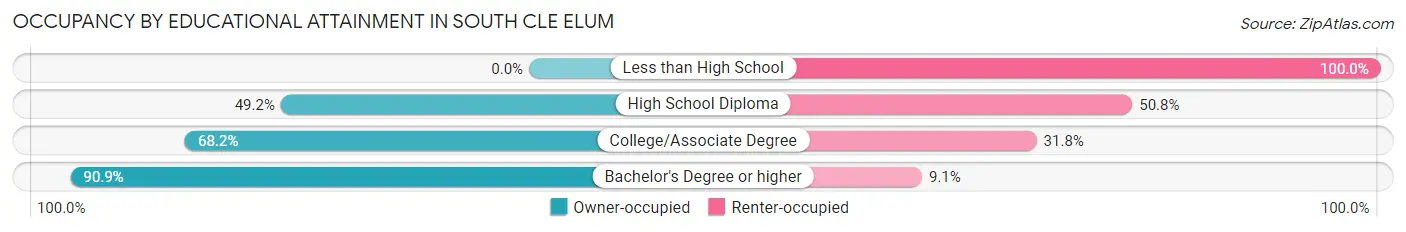
| Household Size | Owner-occupied | Renter-occupied |
| Less than High School | 0 (0.0%) | 31 (100.0%) |
| High School Diploma | 63 (49.2%) | 65 (50.8%) |
| College/Associate Degree | 60 (68.2%) | 28 (31.8%) |
| Bachelor's Degree or higher | 70 (90.9%) | 7 (9.1%) |
Occupancy by Age of Householder in South Cle Elum
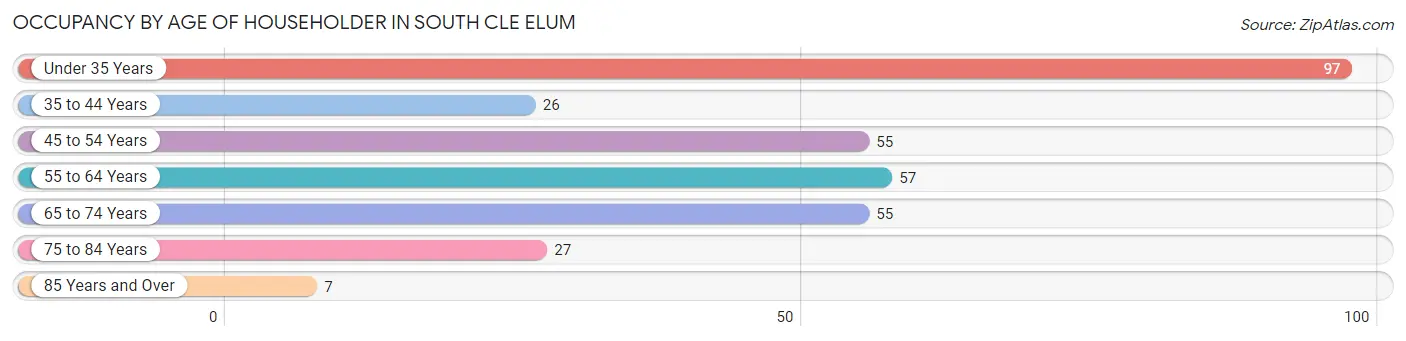
| Age Bracket | # Households | % Households |
| Under 35 Years | 97 | 29.9% |
| 35 to 44 Years | 26 | 8.0% |
| 45 to 54 Years | 55 | 17.0% |
| 55 to 64 Years | 57 | 17.6% |
| 65 to 74 Years | 55 | 17.0% |
| 75 to 84 Years | 27 | 8.3% |
| 85 Years and Over | 7 | 2.2% |
| Total | 324 | 100.0% |
Housing Finances in South Cle Elum
Median Income by Occupancy in South Cle Elum
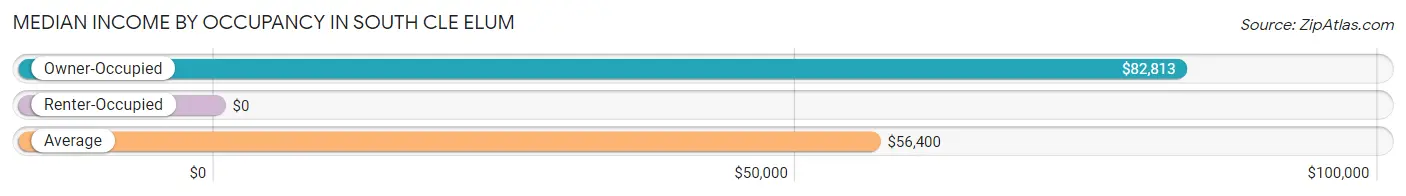
| Occupancy Type | # Households | Median Income |
| Owner-Occupied | 193 (59.6%) | $82,813 |
| Renter-Occupied | 131 (40.4%) | $0 |
| Average | 324 (100.0%) | $56,400 |
Occupancy by Householder Income Bracket in South Cle Elum
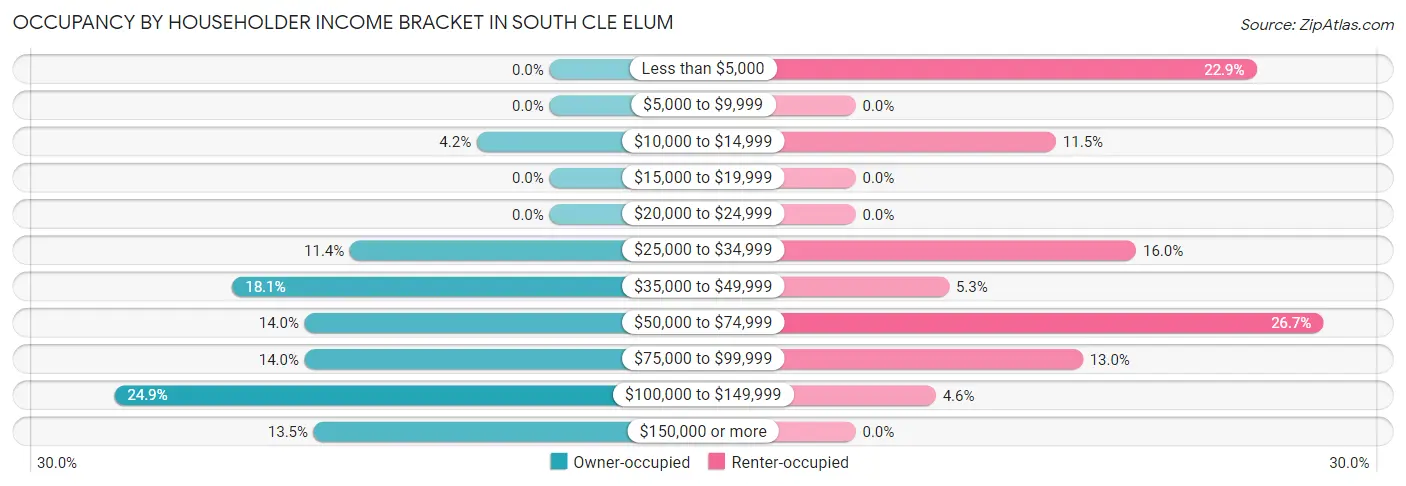
| Income Bracket | Owner-occupied | Renter-occupied |
| Less than $5,000 | 0 (0.0%) | 30 (22.9%) |
| $5,000 to $9,999 | 0 (0.0%) | 0 (0.0%) |
| $10,000 to $14,999 | 8 (4.2%) | 15 (11.5%) |
| $15,000 to $19,999 | 0 (0.0%) | 0 (0.0%) |
| $20,000 to $24,999 | 0 (0.0%) | 0 (0.0%) |
| $25,000 to $34,999 | 22 (11.4%) | 21 (16.0%) |
| $35,000 to $49,999 | 35 (18.1%) | 7 (5.3%) |
| $50,000 to $74,999 | 27 (14.0%) | 35 (26.7%) |
| $75,000 to $99,999 | 27 (14.0%) | 17 (13.0%) |
| $100,000 to $149,999 | 48 (24.9%) | 6 (4.6%) |
| $150,000 or more | 26 (13.5%) | 0 (0.0%) |
| Total | 193 (100.0%) | 131 (100.0%) |
Monthly Housing Cost Tiers in South Cle Elum
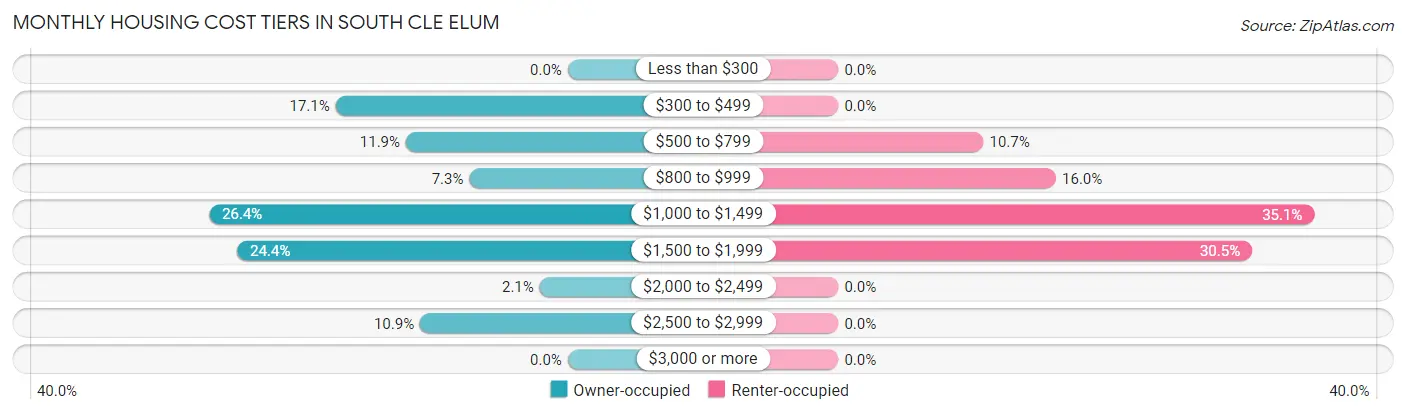
| Monthly Cost | Owner-occupied | Renter-occupied |
| Less than $300 | 0 (0.0%) | 0 (0.0%) |
| $300 to $499 | 33 (17.1%) | 0 (0.0%) |
| $500 to $799 | 23 (11.9%) | 14 (10.7%) |
| $800 to $999 | 14 (7.2%) | 21 (16.0%) |
| $1,000 to $1,499 | 51 (26.4%) | 46 (35.1%) |
| $1,500 to $1,999 | 47 (24.3%) | 40 (30.5%) |
| $2,000 to $2,499 | 4 (2.1%) | 0 (0.0%) |
| $2,500 to $2,999 | 21 (10.9%) | 0 (0.0%) |
| $3,000 or more | 0 (0.0%) | 0 (0.0%) |
| Total | 193 (100.0%) | 131 (100.0%) |
Physical Housing Characteristics in South Cle Elum
Housing Structures in South Cle Elum
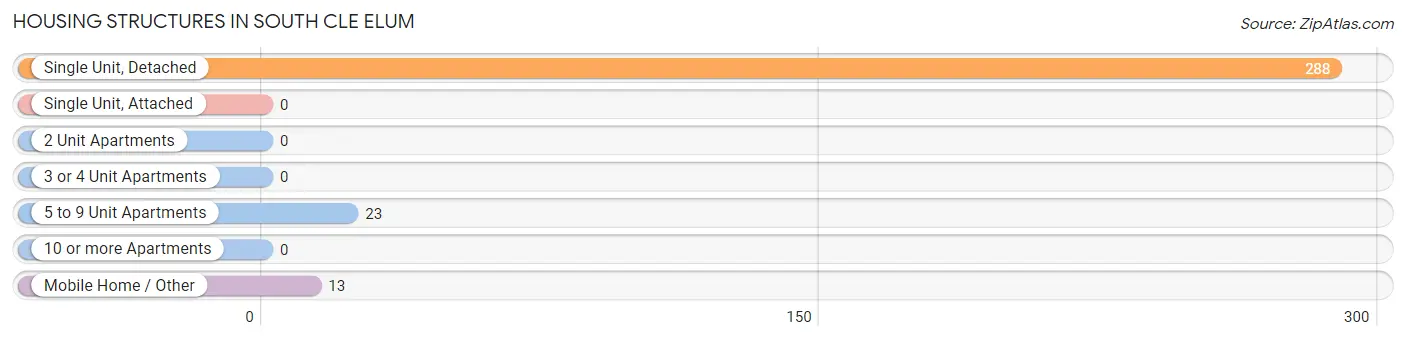
| Structure Type | # Housing Units | % Housing Units |
| Single Unit, Detached | 288 | 88.9% |
| Single Unit, Attached | 0 | 0.0% |
| 2 Unit Apartments | 0 | 0.0% |
| 3 or 4 Unit Apartments | 0 | 0.0% |
| 5 to 9 Unit Apartments | 23 | 7.1% |
| 10 or more Apartments | 0 | 0.0% |
| Mobile Home / Other | 13 | 4.0% |
| Total | 324 | 100.0% |
Housing Structures by Occupancy in South Cle Elum
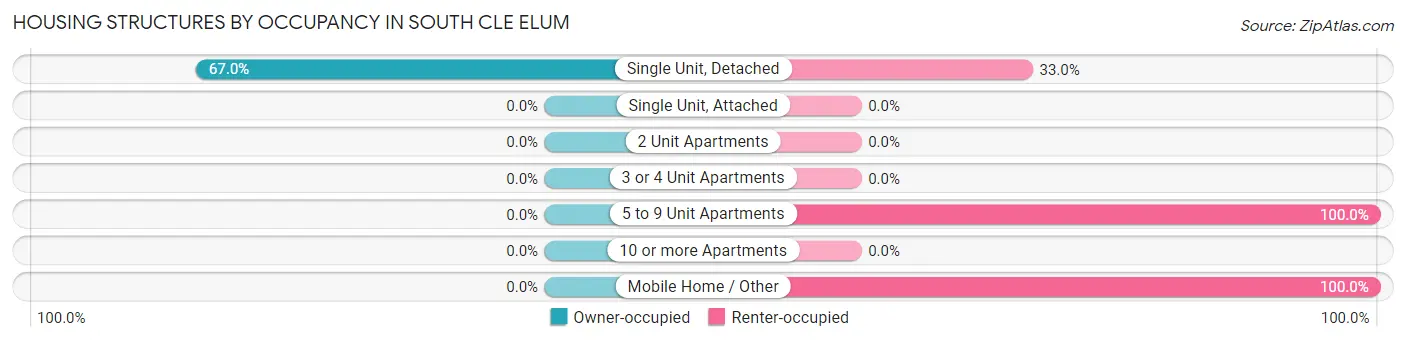
| Structure Type | Owner-occupied | Renter-occupied |
| Single Unit, Detached | 193 (67.0%) | 95 (33.0%) |
| Single Unit, Attached | 0 (0.0%) | 0 (0.0%) |
| 2 Unit Apartments | 0 (0.0%) | 0 (0.0%) |
| 3 or 4 Unit Apartments | 0 (0.0%) | 0 (0.0%) |
| 5 to 9 Unit Apartments | 0 (0.0%) | 23 (100.0%) |
| 10 or more Apartments | 0 (0.0%) | 0 (0.0%) |
| Mobile Home / Other | 0 (0.0%) | 13 (100.0%) |
| Total | 193 (59.6%) | 131 (40.4%) |
Housing Structures by Number of Rooms in South Cle Elum
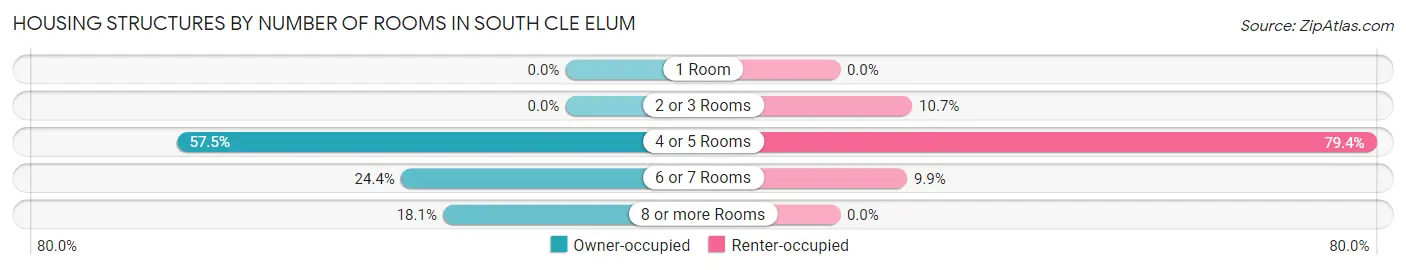
| Number of Rooms | Owner-occupied | Renter-occupied |
| 1 Room | 0 (0.0%) | 0 (0.0%) |
| 2 or 3 Rooms | 0 (0.0%) | 14 (10.7%) |
| 4 or 5 Rooms | 111 (57.5%) | 104 (79.4%) |
| 6 or 7 Rooms | 47 (24.3%) | 13 (9.9%) |
| 8 or more Rooms | 35 (18.1%) | 0 (0.0%) |
| Total | 193 (100.0%) | 131 (100.0%) |
Housing Structure by Heating Type in South Cle Elum
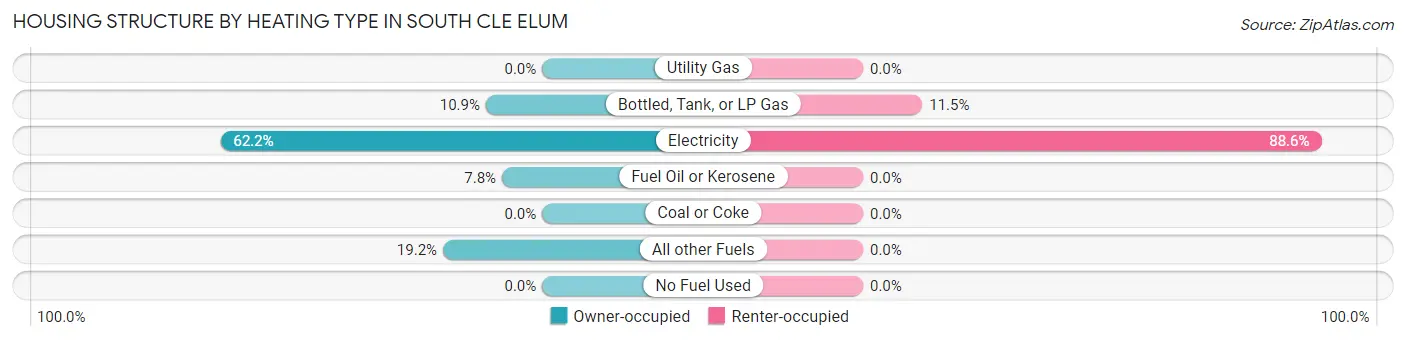
| Heating Type | Owner-occupied | Renter-occupied |
| Utility Gas | 0 (0.0%) | 0 (0.0%) |
| Bottled, Tank, or LP Gas | 21 (10.9%) | 15 (11.5%) |
| Electricity | 120 (62.2%) | 116 (88.5%) |
| Fuel Oil or Kerosene | 15 (7.8%) | 0 (0.0%) |
| Coal or Coke | 0 (0.0%) | 0 (0.0%) |
| All other Fuels | 37 (19.2%) | 0 (0.0%) |
| No Fuel Used | 0 (0.0%) | 0 (0.0%) |
| Total | 193 (100.0%) | 131 (100.0%) |
Household Vehicle Usage in South Cle Elum
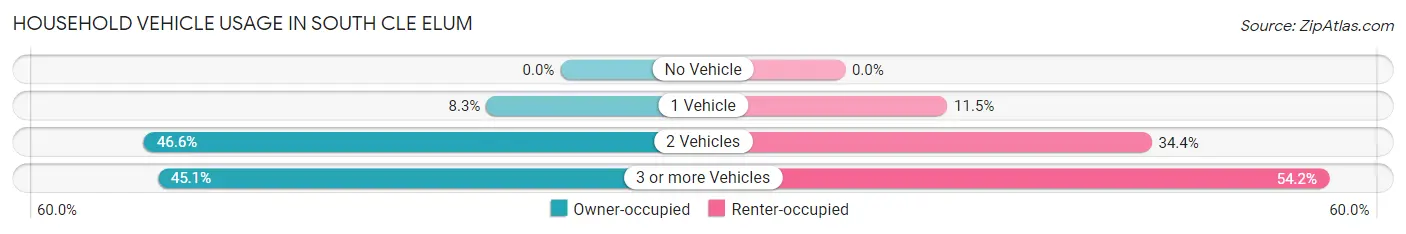
| Vehicles per Household | Owner-occupied | Renter-occupied |
| No Vehicle | 0 (0.0%) | 0 (0.0%) |
| 1 Vehicle | 16 (8.3%) | 15 (11.5%) |
| 2 Vehicles | 90 (46.6%) | 45 (34.4%) |
| 3 or more Vehicles | 87 (45.1%) | 71 (54.2%) |
| Total | 193 (100.0%) | 131 (100.0%) |
Real Estate & Mortgages in South Cle Elum
Real Estate and Mortgage Overview in South Cle Elum
| Characteristic | Without Mortgage | With Mortgage |
| Housing Units | 63 | 130 |
| Median Property Value | $392,900 | $334,900 |
| Median Household Income | $67,734 | $18 |
| Monthly Housing Costs | $494 | $0 |
| Real Estate Taxes | $1,317 | $0 |
Property Value by Mortgage Status in South Cle Elum
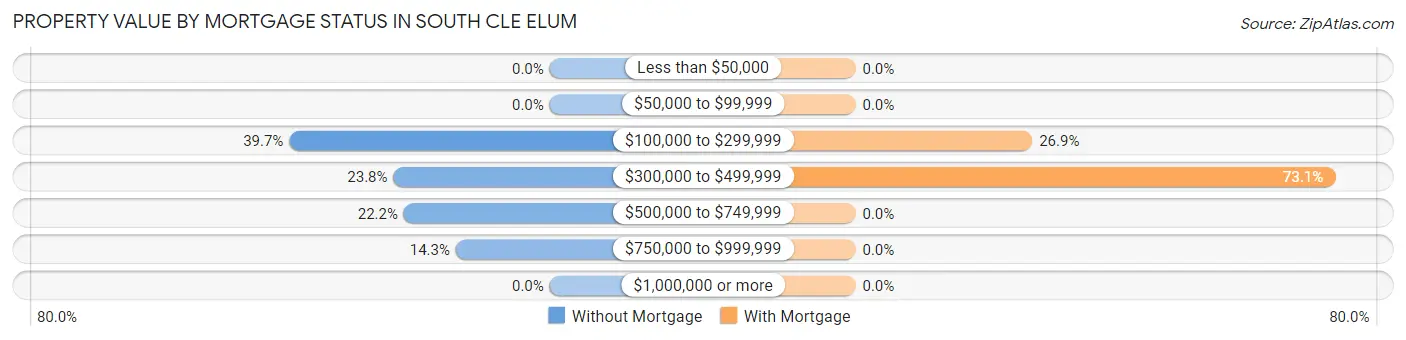
| Property Value | Without Mortgage | With Mortgage |
| Less than $50,000 | 0 (0.0%) | 0 (0.0%) |
| $50,000 to $99,999 | 0 (0.0%) | 0 (0.0%) |
| $100,000 to $299,999 | 25 (39.7%) | 35 (26.9%) |
| $300,000 to $499,999 | 15 (23.8%) | 95 (73.1%) |
| $500,000 to $749,999 | 14 (22.2%) | 0 (0.0%) |
| $750,000 to $999,999 | 9 (14.3%) | 0 (0.0%) |
| $1,000,000 or more | 0 (0.0%) | 0 (0.0%) |
| Total | 63 (100.0%) | 130 (100.0%) |
Household Income by Mortgage Status in South Cle Elum
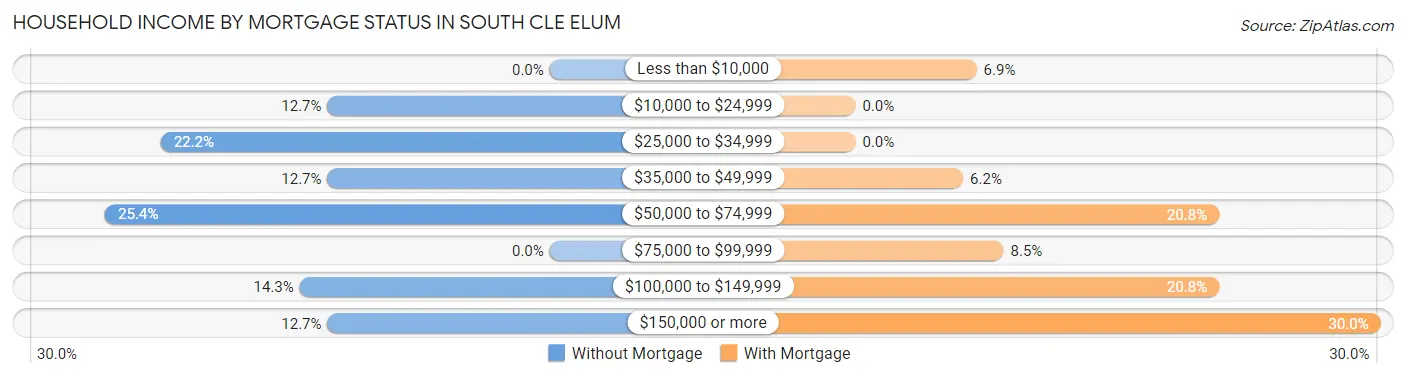
| Household Income | Without Mortgage | With Mortgage |
| Less than $10,000 | 0 (0.0%) | 9 (6.9%) |
| $10,000 to $24,999 | 8 (12.7%) | 0 (0.0%) |
| $25,000 to $34,999 | 14 (22.2%) | 0 (0.0%) |
| $35,000 to $49,999 | 8 (12.7%) | 8 (6.1%) |
| $50,000 to $74,999 | 16 (25.4%) | 27 (20.8%) |
| $75,000 to $99,999 | 0 (0.0%) | 11 (8.5%) |
| $100,000 to $149,999 | 9 (14.3%) | 27 (20.8%) |
| $150,000 or more | 8 (12.7%) | 39 (30.0%) |
| Total | 63 (100.0%) | 130 (100.0%) |
Property Value to Household Income Ratio in South Cle Elum
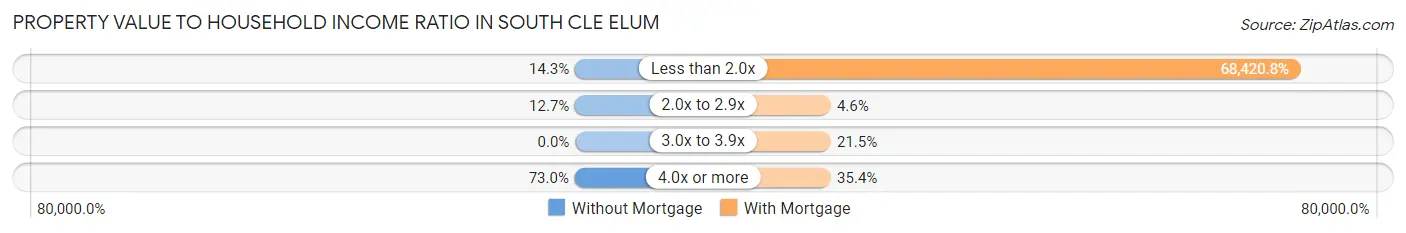
| Value-to-Income Ratio | Without Mortgage | With Mortgage |
| Less than 2.0x | 9 (14.3%) | 88,947 (68,420.8%) |
| 2.0x to 2.9x | 8 (12.7%) | 6 (4.6%) |
| 3.0x to 3.9x | 0 (0.0%) | 28 (21.5%) |
| 4.0x or more | 46 (73.0%) | 46 (35.4%) |
| Total | 63 (100.0%) | 130 (100.0%) |
Real Estate Taxes by Mortgage Status in South Cle Elum
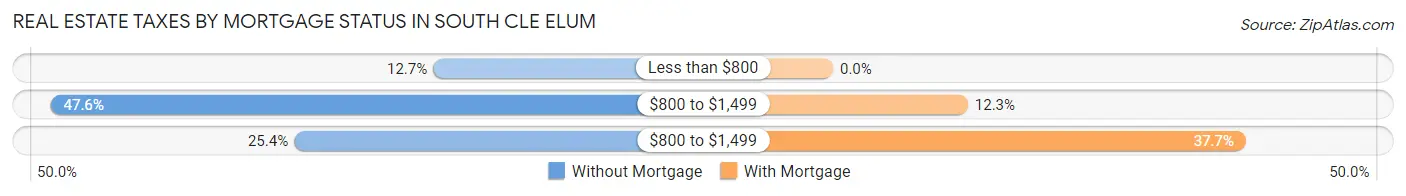
| Property Taxes | Without Mortgage | With Mortgage |
| Less than $800 | 8 (12.7%) | 0 (0.0%) |
| $800 to $1,499 | 30 (47.6%) | 16 (12.3%) |
| $800 to $1,499 | 16 (25.4%) | 49 (37.7%) |
| Total | 63 (100.0%) | 130 (100.0%) |
Health & Disability in South Cle Elum
Health Insurance Coverage by Age in South Cle Elum
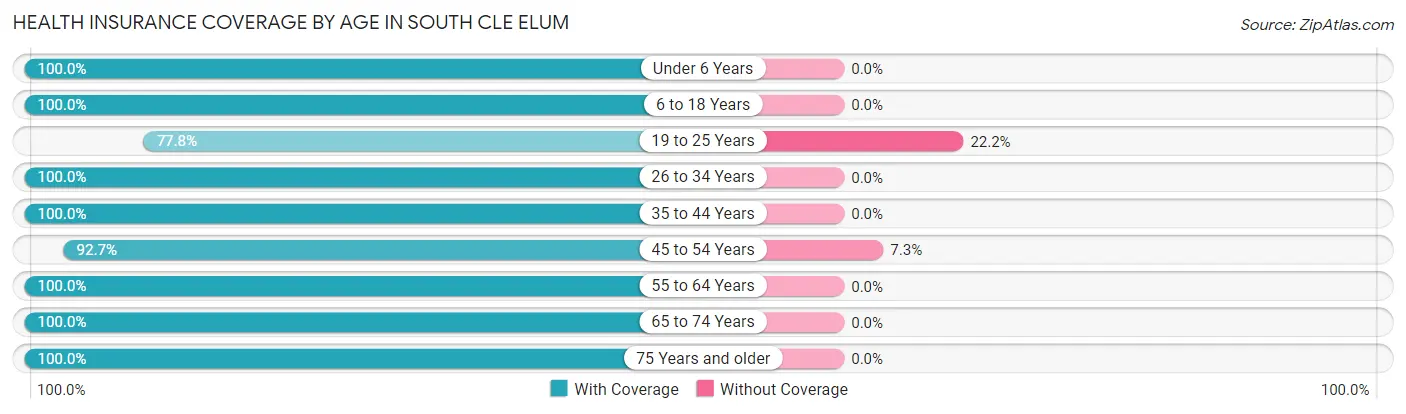
| Age Bracket | With Coverage | Without Coverage |
| Under 6 Years | 93 (100.0%) | 0 (0.0%) |
| 6 to 18 Years | 49 (100.0%) | 0 (0.0%) |
| 19 to 25 Years | 77 (77.8%) | 22 (22.2%) |
| 26 to 34 Years | 113 (100.0%) | 0 (0.0%) |
| 35 to 44 Years | 47 (100.0%) | 0 (0.0%) |
| 45 to 54 Years | 89 (92.7%) | 7 (7.3%) |
| 55 to 64 Years | 97 (100.0%) | 0 (0.0%) |
| 65 to 74 Years | 75 (100.0%) | 0 (0.0%) |
| 75 Years and older | 46 (100.0%) | 0 (0.0%) |
| Total | 686 (95.9%) | 29 (4.1%) |
Health Insurance Coverage by Citizenship Status in South Cle Elum
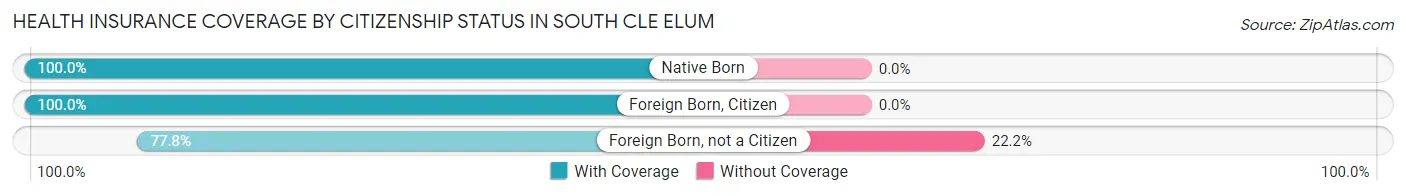
| Citizenship Status | With Coverage | Without Coverage |
| Native Born | 93 (100.0%) | 0 (0.0%) |
| Foreign Born, Citizen | 49 (100.0%) | 0 (0.0%) |
| Foreign Born, not a Citizen | 77 (77.8%) | 22 (22.2%) |
Health Insurance Coverage by Household Income in South Cle Elum
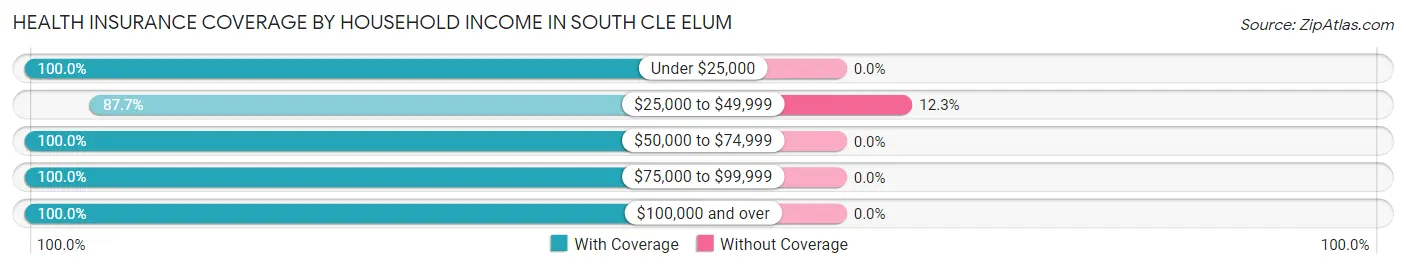
| Household Income | With Coverage | Without Coverage |
| Under $25,000 | 61 (100.0%) | 0 (0.0%) |
| $25,000 to $49,999 | 207 (87.7%) | 29 (12.3%) |
| $50,000 to $74,999 | 118 (100.0%) | 0 (0.0%) |
| $75,000 to $99,999 | 105 (100.0%) | 0 (0.0%) |
| $100,000 and over | 195 (100.0%) | 0 (0.0%) |
Public vs Private Health Insurance Coverage by Age in South Cle Elum
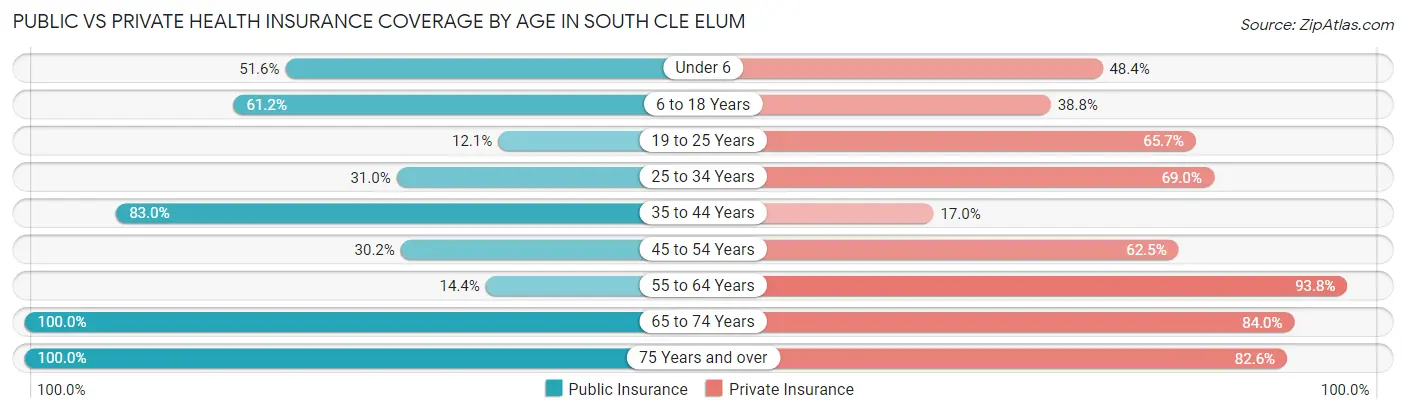
| Age Bracket | Public Insurance | Private Insurance |
| Under 6 | 48 (51.6%) | 45 (48.4%) |
| 6 to 18 Years | 30 (61.2%) | 19 (38.8%) |
| 19 to 25 Years | 12 (12.1%) | 65 (65.7%) |
| 25 to 34 Years | 35 (31.0%) | 78 (69.0%) |
| 35 to 44 Years | 39 (83.0%) | 8 (17.0%) |
| 45 to 54 Years | 29 (30.2%) | 60 (62.5%) |
| 55 to 64 Years | 14 (14.4%) | 91 (93.8%) |
| 65 to 74 Years | 75 (100.0%) | 63 (84.0%) |
| 75 Years and over | 46 (100.0%) | 38 (82.6%) |
| Total | 328 (45.9%) | 467 (65.3%) |
Disability Status by Sex by Age in South Cle Elum
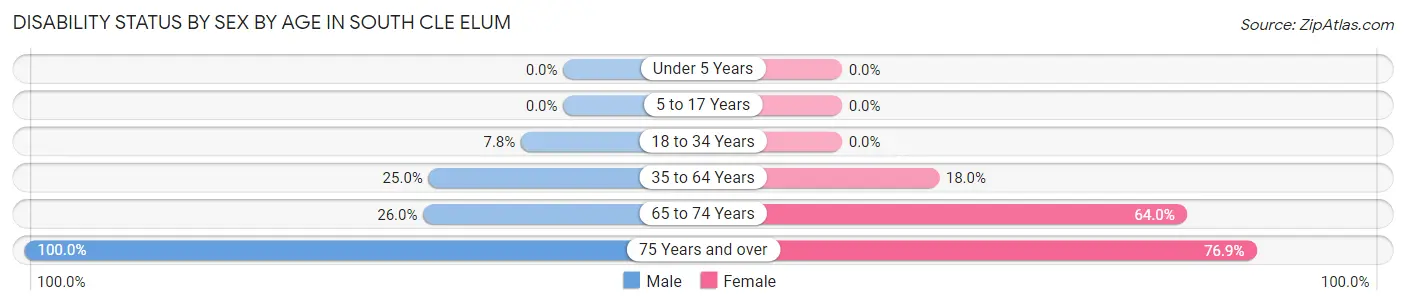
| Age Bracket | Male | Female |
| Under 5 Years | 0 (0.0%) | 0 (0.0%) |
| 5 to 17 Years | 0 (0.0%) | 0 (0.0%) |
| 18 to 34 Years | 8 (7.8%) | 0 (0.0%) |
| 35 to 64 Years | 35 (25.0%) | 18 (18.0%) |
| 65 to 74 Years | 13 (26.0%) | 16 (64.0%) |
| 75 Years and over | 20 (100.0%) | 20 (76.9%) |
Disability Class by Sex by Age in South Cle Elum
Disability Class: Hearing Difficulty
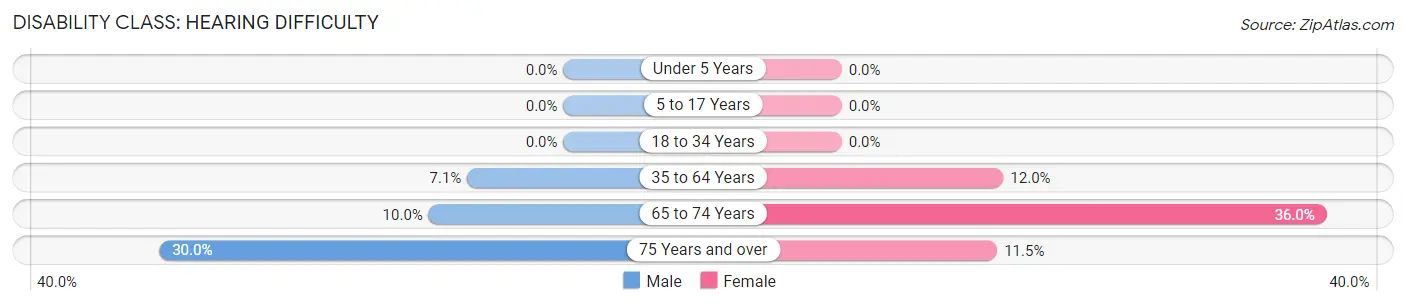
| Age Bracket | Male | Female |
| Under 5 Years | 0 (0.0%) | 0 (0.0%) |
| 5 to 17 Years | 0 (0.0%) | 0 (0.0%) |
| 18 to 34 Years | 0 (0.0%) | 0 (0.0%) |
| 35 to 64 Years | 10 (7.1%) | 12 (12.0%) |
| 65 to 74 Years | 5 (10.0%) | 9 (36.0%) |
| 75 Years and over | 6 (30.0%) | 3 (11.5%) |
Disability Class: Vision Difficulty
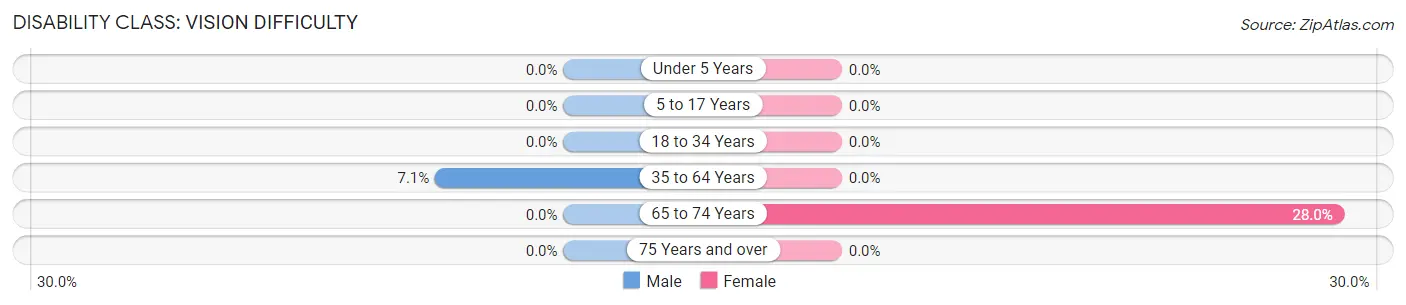
| Age Bracket | Male | Female |
| Under 5 Years | 0 (0.0%) | 0 (0.0%) |
| 5 to 17 Years | 0 (0.0%) | 0 (0.0%) |
| 18 to 34 Years | 0 (0.0%) | 0 (0.0%) |
| 35 to 64 Years | 10 (7.1%) | 0 (0.0%) |
| 65 to 74 Years | 0 (0.0%) | 7 (28.0%) |
| 75 Years and over | 0 (0.0%) | 0 (0.0%) |
Disability Class: Cognitive Difficulty
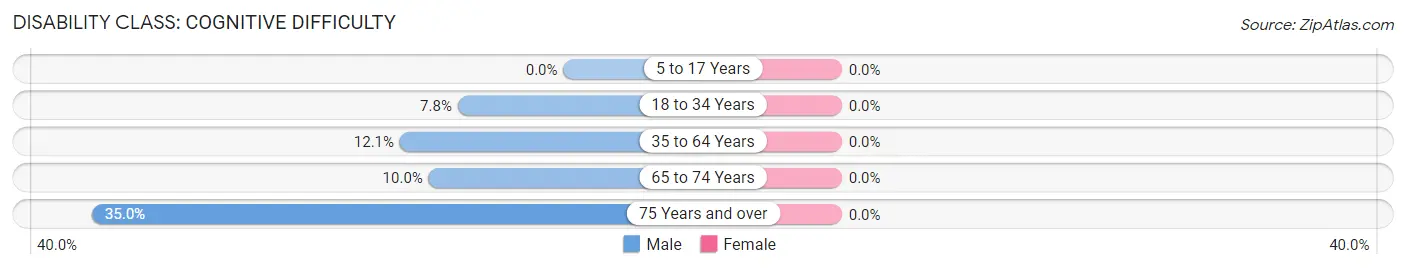
| Age Bracket | Male | Female |
| 5 to 17 Years | 0 (0.0%) | 0 (0.0%) |
| 18 to 34 Years | 8 (7.8%) | 0 (0.0%) |
| 35 to 64 Years | 17 (12.1%) | 0 (0.0%) |
| 65 to 74 Years | 5 (10.0%) | 0 (0.0%) |
| 75 Years and over | 7 (35.0%) | 0 (0.0%) |
Disability Class: Ambulatory Difficulty
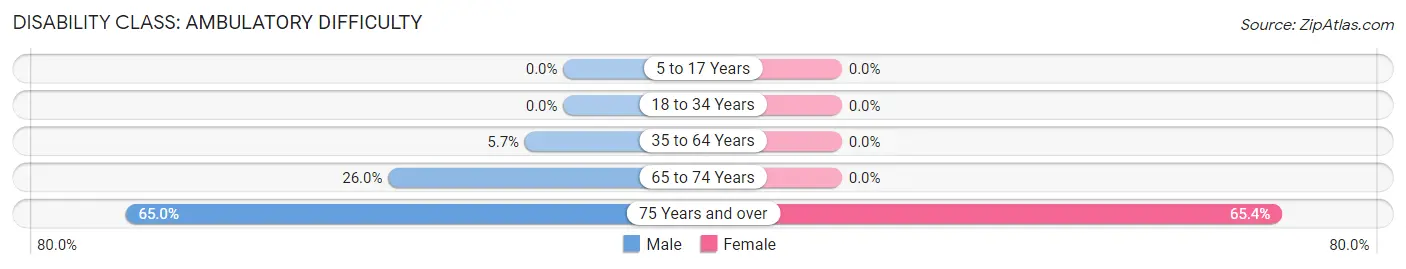
| Age Bracket | Male | Female |
| 5 to 17 Years | 0 (0.0%) | 0 (0.0%) |
| 18 to 34 Years | 0 (0.0%) | 0 (0.0%) |
| 35 to 64 Years | 8 (5.7%) | 0 (0.0%) |
| 65 to 74 Years | 13 (26.0%) | 0 (0.0%) |
| 75 Years and over | 13 (65.0%) | 17 (65.4%) |
Disability Class: Self-Care Difficulty
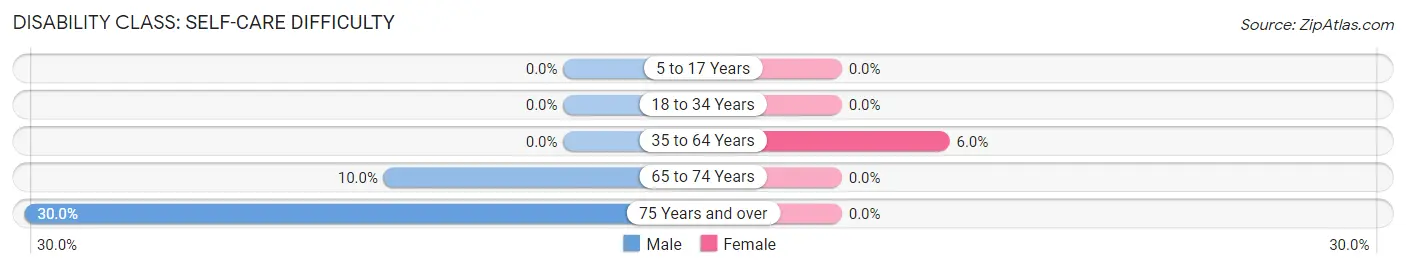
| Age Bracket | Male | Female |
| 5 to 17 Years | 0 (0.0%) | 0 (0.0%) |
| 18 to 34 Years | 0 (0.0%) | 0 (0.0%) |
| 35 to 64 Years | 0 (0.0%) | 6 (6.0%) |
| 65 to 74 Years | 5 (10.0%) | 0 (0.0%) |
| 75 Years and over | 6 (30.0%) | 0 (0.0%) |
Technology Access in South Cle Elum
Computing Device Access in South Cle Elum
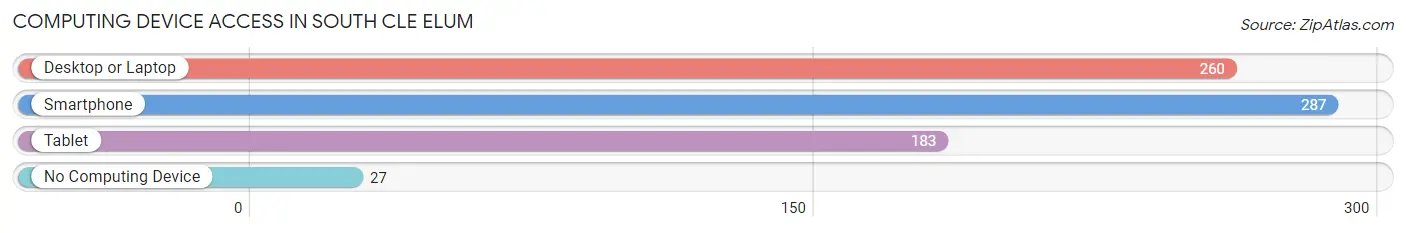
| Device Type | # Households | % Households |
| Desktop or Laptop | 260 | 80.2% |
| Smartphone | 287 | 88.6% |
| Tablet | 183 | 56.5% |
| No Computing Device | 27 | 8.3% |
| Total | 324 | 100.0% |
Internet Access in South Cle Elum
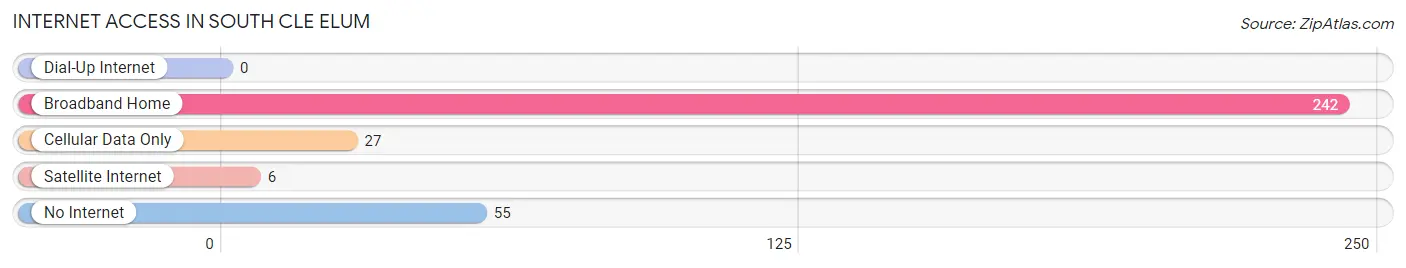
| Internet Type | # Households | % Households |
| Dial-Up Internet | 0 | 0.0% |
| Broadband Home | 242 | 74.7% |
| Cellular Data Only | 27 | 8.3% |
| Satellite Internet | 6 | 1.8% |
| No Internet | 55 | 17.0% |
| Total | 324 | 100.0% |
South Cle Elum Summary
Cle Elum is a small city located in Kittitas County, Washington, United States. It is situated in the Cascade Mountains, approximately 80 miles east of Seattle. The city is located at the confluence of the Cle Elum and Yakima Rivers, and is surrounded by the Wenatchee National Forest. The population of Cle Elum was 1,869 at the 2010 census.
History
The area around Cle Elum was first inhabited by the Kittitas people, a Native American tribe of the Plateau culture. The first European settlers arrived in the area in the late 1800s, and the town of Cle Elum was officially incorporated in 1909. The name “Cle Elum” is derived from the Native American word “tsi-el-lum”, which means “swift water”.
The early economy of Cle Elum was based on logging and mining. The town was home to several large sawmills, and the nearby coal mines provided employment for many of the town’s residents. The railroad also played an important role in the town’s development, as it provided transportation for the lumber and coal that were produced in the area.
In the early 1900s, Cle Elum became a popular tourist destination. The town was home to several resorts, and the nearby mountains provided a variety of recreational activities. The town also became a popular destination for hunters, as the area was home to a variety of game animals.
Geography
Cle Elum is located in the Cascade Mountains of Washington State, approximately 80 miles east of Seattle. The city is situated at the confluence of the Cle Elum and Yakima Rivers, and is surrounded by the Wenatchee National Forest. The city has a total area of 2.2 square miles, all of which is land.
The climate in Cle Elum is generally mild, with warm summers and cold winters. The average annual temperature is 46°F, and the average annual precipitation is 17.5 inches.
Economy
The economy of Cle Elum is largely based on tourism and recreation. The nearby mountains provide a variety of recreational activities, including skiing, snowboarding, hiking, and camping. The town is also home to several resorts, which attract visitors from all over the region.
The town is also home to several businesses, including restaurants, retail stores, and service providers. The nearby coal mines also provide employment for many of the town’s residents.
Demographics
As of the 2010 census, the population of Cle Elum was 1,869. The racial makeup of the city was 91.2% White, 0.7% African American, 0.7% Native American, 0.7% Asian, 0.2% Pacific Islander, 4.2% from other races, and 2.1% from two or more races. Hispanic or Latino of any race were 8.2% of the population.
The median income for a household in Cle Elum was $37,917, and the median income for a family was $45,625. The per capita income for the city was $19,945. About 11.2% of families and 14.2% of the population were below the poverty line, including 19.2% of those under age 18 and 8.3% of those age 65 or over.
Common Questions
What is Per Capita Income in South Cle Elum?
Per Capita income in South Cle Elum is $31,850.
What is the Median Family Income in South Cle Elum?
Median Family Income in South Cle Elum is $53,750.
What is the Median Household income in South Cle Elum?
Median Household Income in South Cle Elum is $56,400.
What is Income or Wage Gap in South Cle Elum?
Income or Wage Gap in South Cle Elum is 47.3%.
Women in South Cle Elum earn 52.7 cents for every dollar earned by a man.
What is Inequality or Gini Index in South Cle Elum?
Inequality or Gini Index in South Cle Elum is 0.42.
What is the Total Population of South Cle Elum?
Total Population of South Cle Elum is 715.
What is the Total Male Population of South Cle Elum?
Total Male Population of South Cle Elum is 372.
What is the Total Female Population of South Cle Elum?
Total Female Population of South Cle Elum is 343.
What is the Ratio of Males per 100 Females in South Cle Elum?
There are 108.45 Males per 100 Females in South Cle Elum.
What is the Ratio of Females per 100 Males in South Cle Elum?
There are 92.20 Females per 100 Males in South Cle Elum.
What is the Median Population Age in South Cle Elum?
Median Population Age in South Cle Elum is 35.2 Years.
What is the Average Family Size in South Cle Elum
Average Family Size in South Cle Elum is 2.6 People.
What is the Average Household Size in South Cle Elum
Average Household Size in South Cle Elum is 2.2 People.
How Large is the Labor Force in South Cle Elum?
There are 390 People in the Labor Forcein in South Cle Elum.
What is the Percentage of People in the Labor Force in South Cle Elum?
65.7% of People are in the Labor Force in South Cle Elum.
What is the Unemployment Rate in South Cle Elum?
Unemployment Rate in South Cle Elum is 7.7%.