Cities with the Highest Per Capita Income in Washington
RELATED REPORTS & OPTIONS
Highest Per Capita Income
Washington
Compare Cities
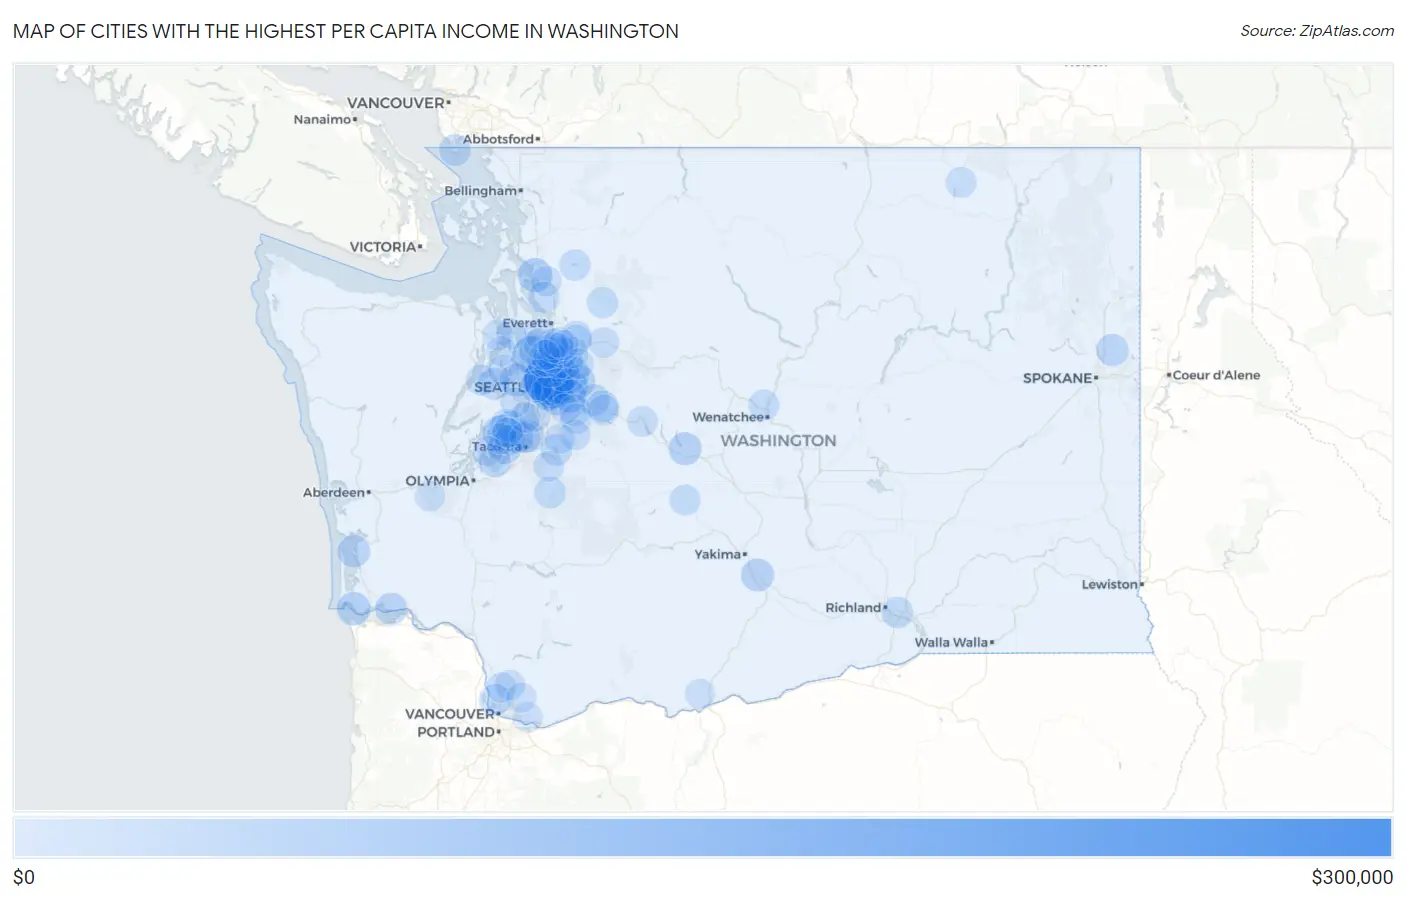
Map of Cities with the Highest Per Capita Income in Washington
$0
$300,000
Cities with the Highest Per Capita Income in Washington
| City | Per Capita Income | vs State | vs National | |
| 1. | Hunts Point | $258,149 | $48,685(+209k)#1 | $41,261(+217k)#8 |
| 2. | Clyde Hill | $179,910 | $48,685(+131k)#2 | $41,261(+139k)#49 |
| 3. | Medina | $156,124 | $48,685(+107k)#3 | $41,261(+115k)#91 |
| 4. | Yarrow Point | $144,164 | $48,685(+95.5k)#4 | $41,261(+103k)#140 |
| 5. | Woodway | $131,771 | $48,685(+83.1k)#5 | $41,261(+90.5k)#190 |
| 6. | Beaux Arts Village | $126,204 | $48,685(+77.5k)#6 | $41,261(+84.9k)#221 |
| 7. | Mercer Island | $113,575 | $48,685(+64.9k)#7 | $41,261(+72.3k)#337 |
| 8. | Northwest Stanwood | $96,958 | $48,685(+48.3k)#8 | $41,261(+55.7k)#565 |
| 9. | Union Hill Novelty Hill | $94,955 | $48,685(+46.3k)#9 | $41,261(+53.7k)#597 |
| 10. | Chinook | $89,261 | $48,685(+40.6k)#10 | $41,261(+48.0k)#723 |
| 11. | Sammamish | $88,476 | $48,685(+39.8k)#11 | $41,261(+47.2k)#740 |
| 12. | Newcastle | $87,898 | $48,685(+39.2k)#12 | $41,261(+46.6k)#760 |
| 13. | Raft Island | $87,791 | $48,685(+39.1k)#13 | $41,261(+46.5k)#762 |
| 14. | Bainbridge Island | $86,747 | $48,685(+38.1k)#14 | $41,261(+45.5k)#790 |
| 15. | Bellevue | $85,845 | $48,685(+37.2k)#15 | $41,261(+44.6k)#810 |
| 16. | Ronald | $85,049 | $48,685(+36.4k)#16 | $41,261(+43.8k)#828 |
| 17. | Fox Island | $84,382 | $48,685(+35.7k)#17 | $41,261(+43.1k)#845 |
| 18. | Ames Lake | $84,311 | $48,685(+35.6k)#18 | $41,261(+43.0k)#850 |
| 19. | Donald | $83,951 | $48,685(+35.3k)#19 | $41,261(+42.7k)#861 |
| 20. | Issaquah | $83,644 | $48,685(+35.0k)#20 | $41,261(+42.4k)#875 |
| 21. | Cottage Lake | $83,277 | $48,685(+34.6k)#21 | $41,261(+42.0k)#886 |
| 22. | Redmond | $82,565 | $48,685(+33.9k)#22 | $41,261(+41.3k)#916 |
| 23. | Sunland Estates | $81,631 | $48,685(+32.9k)#23 | $41,261(+40.4k)#940 |
| 24. | Kirkland | $79,941 | $48,685(+31.3k)#24 | $41,261(+38.7k)#997 |
| 25. | Bay Center | $79,339 | $48,685(+30.7k)#25 | $41,261(+38.1k)#1,021 |
| 26. | Seattle | $77,616 | $48,685(+28.9k)#26 | $41,261(+36.4k)#1,092 |
| 27. | Riverpoint | $77,149 | $48,685(+28.5k)#27 | $41,261(+35.9k)#1,115 |
| 28. | Green Bluff | $77,055 | $48,685(+28.4k)#28 | $41,261(+35.8k)#1,119 |
| 29. | Dash Point | $76,851 | $48,685(+28.2k)#29 | $41,261(+35.6k)#1,128 |
| 30. | Altoona | $75,172 | $48,685(+26.5k)#30 | $41,261(+33.9k)#1,206 |
| 31. | Roche Harbor | $75,064 | $48,685(+26.4k)#31 | $41,261(+33.8k)#1,213 |
| 32. | Ruston | $74,887 | $48,685(+26.2k)#32 | $41,261(+33.6k)#1,220 |
| 33. | Woodinville | $74,866 | $48,685(+26.2k)#33 | $41,261(+33.6k)#1,223 |
| 34. | Snoqualmie | $74,487 | $48,685(+25.8k)#34 | $41,261(+33.2k)#1,245 |
| 35. | Anderson Island | $73,851 | $48,685(+25.2k)#35 | $41,261(+32.6k)#1,281 |
| 36. | Point Roberts | $73,318 | $48,685(+24.6k)#36 | $41,261(+32.1k)#1,301 |
| 37. | Lake Forest Park | $72,992 | $48,685(+24.3k)#37 | $41,261(+31.7k)#1,328 |
| 38. | Felida | $72,889 | $48,685(+24.2k)#38 | $41,261(+31.6k)#1,332 |
| 39. | North Bend | $72,456 | $48,685(+23.8k)#39 | $41,261(+31.2k)#1,355 |
| 40. | Chico | $72,086 | $48,685(+23.4k)#40 | $41,261(+30.8k)#1,377 |
| 41. | Canterwood | $71,541 | $48,685(+22.9k)#41 | $41,261(+30.3k)#1,408 |
| 42. | Lake Goodwin | $71,482 | $48,685(+22.8k)#42 | $41,261(+30.2k)#1,420 |
| 43. | Lake Tapps | $71,461 | $48,685(+22.8k)#43 | $41,261(+30.2k)#1,423 |
| 44. | Kapowsin | $71,185 | $48,685(+22.5k)#44 | $41,261(+29.9k)#1,448 |
| 45. | Maplewood | $70,798 | $48,685(+22.1k)#45 | $41,261(+29.5k)#1,469 |
| 46. | West Pasco | $68,834 | $48,685(+20.1k)#46 | $41,261(+27.6k)#1,581 |
| 47. | Edmonds | $68,793 | $48,685(+20.1k)#47 | $41,261(+27.5k)#1,585 |
| 48. | Lake Cavanaugh | $67,632 | $48,685(+18.9k)#48 | $41,261(+26.4k)#1,688 |
| 49. | Bothell East | $67,615 | $48,685(+18.9k)#49 | $41,261(+26.4k)#1,692 |
| 50. | Mirrormont | $67,416 | $48,685(+18.7k)#50 | $41,261(+26.2k)#1,703 |
| 51. | Kenmore | $67,261 | $48,685(+18.6k)#51 | $41,261(+26.0k)#1,718 |
| 52. | High Bridge | $66,736 | $48,685(+18.1k)#52 | $41,261(+25.5k)#1,759 |
| 53. | Rosedale | $66,604 | $48,685(+17.9k)#53 | $41,261(+25.3k)#1,774 |
| 54. | Chain Lake | $65,916 | $48,685(+17.2k)#54 | $41,261(+24.7k)#1,837 |
| 55. | Wollochet | $65,602 | $48,685(+16.9k)#55 | $41,261(+24.3k)#1,859 |
| 56. | Artondale | $65,599 | $48,685(+16.9k)#56 | $41,261(+24.3k)#1,860 |
| 57. | Verlot | $65,440 | $48,685(+16.8k)#57 | $41,261(+24.2k)#1,872 |
| 58. | Sunnyslope | $65,194 | $48,685(+16.5k)#58 | $41,261(+23.9k)#1,901 |
| 59. | Cliffdell | $65,080 | $48,685(+16.4k)#59 | $41,261(+23.8k)#1,907 |
| 60. | Maltby | $64,910 | $48,685(+16.2k)#60 | $41,261(+23.6k)#1,927 |
| 61. | Monroe North | $64,844 | $48,685(+16.2k)#61 | $41,261(+23.6k)#1,931 |
| 62. | Seabeck | $64,457 | $48,685(+15.8k)#62 | $41,261(+23.2k)#1,966 |
| 63. | Browns Point | $64,340 | $48,685(+15.7k)#63 | $41,261(+23.1k)#1,976 |
| 64. | Bothell West | $64,056 | $48,685(+15.4k)#64 | $41,261(+22.8k)#2,000 |
| 65. | Startup | $64,038 | $48,685(+15.4k)#65 | $41,261(+22.8k)#2,003 |
| 66. | Hobart | $63,562 | $48,685(+14.9k)#66 | $41,261(+22.3k)#2,059 |
| 67. | Keyport | $63,531 | $48,685(+14.8k)#67 | $41,261(+22.3k)#2,062 |
| 68. | Normandy Park | $63,421 | $48,685(+14.7k)#68 | $41,261(+22.2k)#2,071 |
| 69. | Riverbend | $63,213 | $48,685(+14.5k)#69 | $41,261(+22.0k)#2,096 |
| 70. | Black Diamond | $62,896 | $48,685(+14.2k)#70 | $41,261(+21.6k)#2,119 |
| 71. | Mukilteo | $62,514 | $48,685(+13.8k)#71 | $41,261(+21.3k)#2,152 |
| 72. | Snoqualmie Pass | $62,398 | $48,685(+13.7k)#72 | $41,261(+21.1k)#2,166 |
| 73. | Malo | $62,359 | $48,685(+13.7k)#73 | $41,261(+21.1k)#2,171 |
| 74. | Bothell | $61,857 | $48,685(+13.2k)#74 | $41,261(+20.6k)#2,239 |
| 75. | Vashon | $61,597 | $48,685(+12.9k)#75 | $41,261(+20.3k)#2,264 |
| 76. | Meadowdale | $61,576 | $48,685(+12.9k)#76 | $41,261(+20.3k)#2,266 |
| 77. | Crescent Bar | $61,505 | $48,685(+12.8k)#77 | $41,261(+20.2k)#2,277 |
| 78. | Mill Creek | $61,422 | $48,685(+12.7k)#78 | $41,261(+20.2k)#2,291 |
| 79. | Lake Holm | $61,341 | $48,685(+12.7k)#79 | $41,261(+20.1k)#2,302 |
| 80. | Clearview | $61,198 | $48,685(+12.5k)#80 | $41,261(+19.9k)#2,316 |
| 81. | Mcmillin | $61,094 | $48,685(+12.4k)#81 | $41,261(+19.8k)#2,331 |
| 82. | Port Ludlow | $60,741 | $48,685(+12.1k)#82 | $41,261(+19.5k)#2,382 |
| 83. | Duvall | $60,634 | $48,685(+11.9k)#83 | $41,261(+19.4k)#2,392 |
| 84. | Mill Creek East | $60,595 | $48,685(+11.9k)#84 | $41,261(+19.3k)#2,400 |
| 85. | Hansville | $59,754 | $48,685(+11.1k)#85 | $41,261(+18.5k)#2,521 |
| 86. | Gig Harbor | $59,742 | $48,685(+11.1k)#86 | $41,261(+18.5k)#2,524 |
| 87. | Longbranch | $59,476 | $48,685(+10.8k)#87 | $41,261(+18.2k)#2,556 |
| 88. | Sunday Lake | $59,338 | $48,685(+10.7k)#88 | $41,261(+18.1k)#2,575 |
| 89. | Silver Firs | $58,733 | $48,685(+10.0k)#89 | $41,261(+17.5k)#2,664 |
| 90. | Cherry Grove | $58,388 | $48,685(+9.70k)#90 | $41,261(+17.1k)#2,711 |
| 91. | Porter | $58,286 | $48,685(+9.60k)#91 | $41,261(+17.0k)#2,725 |
| 92. | East Renton Highlands | $57,996 | $48,685(+9.31k)#92 | $41,261(+16.7k)#2,771 |
| 93. | Camas | $57,841 | $48,685(+9.16k)#93 | $41,261(+16.6k)#2,796 |
| 94. | Cathcart | $57,742 | $48,685(+9.06k)#94 | $41,261(+16.5k)#2,811 |
| 95. | Brier | $57,268 | $48,685(+8.58k)#95 | $41,261(+16.0k)#2,876 |
| 96. | Duluth | $57,260 | $48,685(+8.57k)#96 | $41,261(+16.0k)#2,878 |
| 97. | Hockinson | $56,948 | $48,685(+8.26k)#97 | $41,261(+15.7k)#2,917 |
| 98. | Centerville | $56,666 | $48,685(+7.98k)#98 | $41,261(+15.4k)#2,955 |
| 99. | Lofall | $56,532 | $48,685(+7.85k)#99 | $41,261(+15.3k)#2,974 |
| 100. | Southworth | $56,428 | $48,685(+7.74k)#100 | $41,261(+15.2k)#2,993 |
Common Questions
What are the Top 10 Cities with the Highest Per Capita Income in Washington?
Top 10 Cities with the Highest Per Capita Income in Washington are:
#1
$258,149
#2
$179,910
#3
$156,124
#4
$144,164
#5
$131,771
#6
$126,204
#7
$113,575
#8
$96,958
#9
$94,955
#10
$89,261
What city has the Highest Per Capita Income in Washington?
Hunts Point has the Highest Per Capita Income in Washington with $258,149.
What is the Per Capita Income in the State of Washington?
Per Capita Income in Washington is $48,685.
What is the Per Capita Income in the United States?
Per Capita Income in the United States is $41,261.