Cities with the Highest Percentage of Tlingit-Haida Population in Washington
RELATED REPORTS & OPTIONS
Tlingit-Haida
Washington
Compare Cities
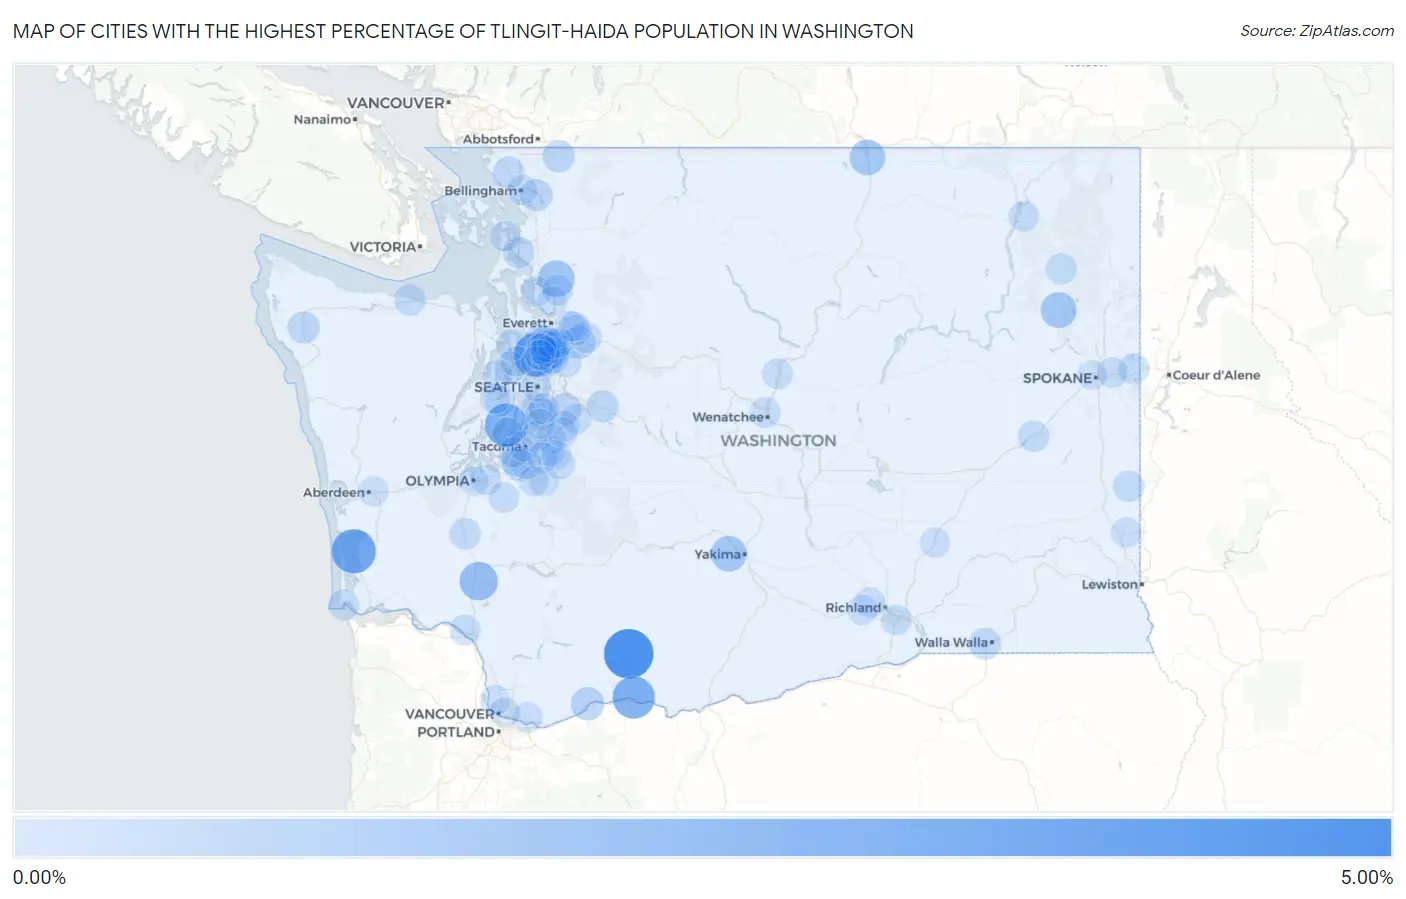
Map of Cities with the Highest Percentage of Tlingit-Haida Population in Washington
0.00%
5.00%
Cities with the Highest Percentage of Tlingit-Haida Population in Washington
| City | Tlingit-Haida | vs State | vs National | |
| 1. | Trout Lake | 4.62% | 0.082%(+4.54)#1 | 0.0082%(+4.61)#24 |
| 2. | Esperance | 3.42% | 0.082%(+3.34)#2 | 0.0082%(+3.41)#28 |
| 3. | Bay Center | 3.33% | 0.082%(+3.25)#3 | 0.0082%(+3.33)#29 |
| 4. | Canterwood | 2.98% | 0.082%(+2.89)#4 | 0.0082%(+2.97)#31 |
| 5. | White Salmon | 2.87% | 0.082%(+2.79)#5 | 0.0082%(+2.87)#32 |
| 6. | Toledo | 1.91% | 0.082%(+1.83)#6 | 0.0082%(+1.90)#41 |
| 7. | Bryant | 1.57% | 0.082%(+1.49)#7 | 0.0082%(+1.56)#51 |
| 8. | Springdale | 1.36% | 0.082%(+1.28)#8 | 0.0082%(+1.36)#56 |
| 9. | Oroville | 1.31% | 0.082%(+1.23)#9 | 0.0082%(+1.30)#58 |
| 10. | Summitview | 1.31% | 0.082%(+1.23)#10 | 0.0082%(+1.30)#59 |
| 11. | Martha Lake | 0.82% | 0.082%(+0.735)#11 | 0.0082%(+0.809)#79 |
| 12. | Stevenson | 0.77% | 0.082%(+0.684)#12 | 0.0082%(+0.758)#82 |
| 13. | Monroe | 0.74% | 0.082%(+0.656)#13 | 0.0082%(+0.730)#83 |
| 14. | Bothell West | 0.61% | 0.082%(+0.532)#14 | 0.0082%(+0.606)#91 |
| 15. | Bothell | 0.60% | 0.082%(+0.521)#15 | 0.0082%(+0.595)#92 |
| 16. | Peaceful Valley | 0.55% | 0.082%(+0.470)#16 | 0.0082%(+0.544)#97 |
| 17. | Sudden Valley | 0.55% | 0.082%(+0.467)#17 | 0.0082%(+0.541)#98 |
| 18. | East Renton Highlands | 0.52% | 0.082%(+0.439)#18 | 0.0082%(+0.513)#101 |
| 19. | Forks | 0.50% | 0.082%(+0.421)#19 | 0.0082%(+0.495)#108 |
| 20. | North Bend | 0.45% | 0.082%(+0.368)#20 | 0.0082%(+0.442)#116 |
| 21. | Ferndale | 0.45% | 0.082%(+0.367)#21 | 0.0082%(+0.441)#118 |
| 22. | Picnic Point | 0.43% | 0.082%(+0.350)#22 | 0.0082%(+0.424)#122 |
| 23. | Garrett | 0.43% | 0.082%(+0.345)#23 | 0.0082%(+0.419)#123 |
| 24. | Mcchord Afb | 0.41% | 0.082%(+0.332)#24 | 0.0082%(+0.406)#125 |
| 25. | Larch Way | 0.41% | 0.082%(+0.327)#25 | 0.0082%(+0.401)#126 |
| 26. | La Conner | 0.40% | 0.082%(+0.318)#26 | 0.0082%(+0.392)#128 |
| 27. | Suquamish | 0.39% | 0.082%(+0.310)#27 | 0.0082%(+0.384)#130 |
| 28. | Burien | 0.38% | 0.082%(+0.300)#28 | 0.0082%(+0.374)#134 |
| 29. | Mill Creek East | 0.37% | 0.082%(+0.289)#29 | 0.0082%(+0.363)#136 |
| 30. | Port Angeles | 0.35% | 0.082%(+0.268)#30 | 0.0082%(+0.342)#142 |
| 31. | Garfield | 0.34% | 0.082%(+0.259)#31 | 0.0082%(+0.333)#143 |
| 32. | Fairwood Cdp King County | 0.34% | 0.082%(+0.256)#32 | 0.0082%(+0.330)#144 |
| 33. | Centralia | 0.32% | 0.082%(+0.236)#33 | 0.0082%(+0.310)#147 |
| 34. | Sprague | 0.32% | 0.082%(+0.234)#34 | 0.0082%(+0.308)#148 |
| 35. | Woods Creek | 0.30% | 0.082%(+0.216)#35 | 0.0082%(+0.290)#150 |
| 36. | Sumner | 0.28% | 0.082%(+0.201)#36 | 0.0082%(+0.275)#156 |
| 37. | Ilwaco | 0.28% | 0.082%(+0.197)#37 | 0.0082%(+0.271)#157 |
| 38. | Chewelah | 0.28% | 0.082%(+0.197)#38 | 0.0082%(+0.271)#158 |
| 39. | Lake Stickney | 0.25% | 0.082%(+0.170)#39 | 0.0082%(+0.244)#163 |
| 40. | Seatac | 0.25% | 0.082%(+0.167)#40 | 0.0082%(+0.241)#166 |
| 41. | Port Gamble Tribal Community | 0.24% | 0.082%(+0.153)#41 | 0.0082%(+0.227)#171 |
| 42. | Longview | 0.23% | 0.082%(+0.148)#42 | 0.0082%(+0.222)#174 |
| 43. | Covington | 0.23% | 0.082%(+0.148)#43 | 0.0082%(+0.222)#175 |
| 44. | Otis Orchards East Farms | 0.23% | 0.082%(+0.146)#44 | 0.0082%(+0.220)#178 |
| 45. | Wenatchee | 0.22% | 0.082%(+0.138)#45 | 0.0082%(+0.212)#182 |
| 46. | Federal Way | 0.22% | 0.082%(+0.138)#46 | 0.0082%(+0.212)#183 |
| 47. | Prairie Ridge | 0.22% | 0.082%(+0.135)#47 | 0.0082%(+0.209)#185 |
| 48. | Bothell East | 0.22% | 0.082%(+0.133)#48 | 0.0082%(+0.207)#186 |
| 49. | Entiat | 0.19% | 0.082%(+0.110)#49 | 0.0082%(+0.184)#195 |
| 50. | Warm Beach | 0.19% | 0.082%(+0.108)#50 | 0.0082%(+0.182)#197 |
| 51. | Kettle Falls | 0.19% | 0.082%(+0.106)#51 | 0.0082%(+0.180)#198 |
| 52. | Tukwila | 0.19% | 0.082%(+0.103)#52 | 0.0082%(+0.177)#201 |
| 53. | Arlington | 0.18% | 0.082%(+0.100)#53 | 0.0082%(+0.174)#204 |
| 54. | Auburn | 0.18% | 0.082%(+0.099)#54 | 0.0082%(+0.173)#206 |
| 55. | Parkland | 0.18% | 0.082%(+0.095)#55 | 0.0082%(+0.169)#211 |
| 56. | Tanglewilde | 0.17% | 0.082%(+0.089)#56 | 0.0082%(+0.163)#213 |
| 57. | Three Lakes | 0.17% | 0.082%(+0.086)#57 | 0.0082%(+0.160)#216 |
| 58. | Kennewick | 0.16% | 0.082%(+0.082)#58 | 0.0082%(+0.156)#217 |
| 59. | Millwood | 0.16% | 0.082%(+0.073)#59 | 0.0082%(+0.147)#223 |
| 60. | Lakewood | 0.15% | 0.082%(+0.071)#60 | 0.0082%(+0.145)#225 |
| 61. | Yelm | 0.15% | 0.082%(+0.071)#61 | 0.0082%(+0.145)#226 |
| 62. | University Place | 0.15% | 0.082%(+0.068)#62 | 0.0082%(+0.142)#227 |
| 63. | Everett | 0.15% | 0.082%(+0.064)#63 | 0.0082%(+0.138)#230 |
| 64. | Tacoma | 0.14% | 0.082%(+0.061)#64 | 0.0082%(+0.135)#232 |
| 65. | Hobart | 0.14% | 0.082%(+0.058)#65 | 0.0082%(+0.132)#235 |
| 66. | Silverdale | 0.13% | 0.082%(+0.051)#66 | 0.0082%(+0.125)#240 |
| 67. | West Richland | 0.13% | 0.082%(+0.051)#67 | 0.0082%(+0.125)#241 |
| 68. | Camas | 0.13% | 0.082%(+0.050)#68 | 0.0082%(+0.124)#242 |
| 69. | Mill Creek | 0.12% | 0.082%(+0.038)#69 | 0.0082%(+0.112)#247 |
| 70. | Port Orchard | 0.12% | 0.082%(+0.038)#70 | 0.0082%(+0.112)#248 |
| 71. | Benton City | 0.11% | 0.082%(+0.032)#71 | 0.0082%(+0.106)#252 |
| 72. | Puyallup | 0.11% | 0.082%(+0.026)#72 | 0.0082%(+0.100)#258 |
| 73. | Bellingham | 0.11% | 0.082%(+0.023)#73 | 0.0082%(+0.097)#261 |
| 74. | Pullman | 0.10% | 0.082%(+0.018)#74 | 0.0082%(+0.092)#263 |
| 75. | Kenmore | 0.097% | 0.082%(+0.015)#75 | 0.0082%(+0.089)#265 |
| 76. | Bremerton | 0.095% | 0.082%(+0.013)#76 | 0.0082%(+0.087)#266 |
| 77. | Seattle | 0.095% | 0.082%(+0.013)#77 | 0.0082%(+0.087)#267 |
| 78. | Graham | 0.086% | 0.082%(+0.004)#78 | 0.0082%(+0.078)#270 |
| 79. | Anacortes | 0.085% | 0.082%(+0.003)#79 | 0.0082%(+0.077)#273 |
| 80. | Indianola | 0.084% | 0.082%(+0.002)#80 | 0.0082%(+0.076)#274 |
| 81. | Elk Plain | 0.084% | 0.082%(+0.002)#81 | 0.0082%(+0.076)#275 |
| 82. | Fairwood Cdp Spokane County | 0.078% | 0.082%(-0.004)#82 | 0.0082%(+0.070)#279 |
| 83. | Connell | 0.077% | 0.082%(-0.005)#83 | 0.0082%(+0.069)#282 |
| 84. | Snohomish | 0.059% | 0.082%(-0.023)#84 | 0.0082%(+0.051)#298 |
| 85. | Gig Harbor | 0.059% | 0.082%(-0.023)#85 | 0.0082%(+0.051)#299 |
| 86. | Lake Morton Berrydale | 0.057% | 0.082%(-0.025)#86 | 0.0082%(+0.049)#300 |
| 87. | Felida | 0.057% | 0.082%(-0.025)#87 | 0.0082%(+0.049)#301 |
| 88. | Bonney Lake | 0.053% | 0.082%(-0.029)#88 | 0.0082%(+0.045)#306 |
| 89. | Aberdeen | 0.053% | 0.082%(-0.029)#89 | 0.0082%(+0.045)#307 |
| 90. | Des Moines | 0.052% | 0.082%(-0.030)#90 | 0.0082%(+0.044)#313 |
| 91. | Cottage Lake | 0.052% | 0.082%(-0.031)#91 | 0.0082%(+0.043)#315 |
| 92. | Shoreline | 0.051% | 0.082%(-0.031)#92 | 0.0082%(+0.043)#316 |
| 93. | Marysville | 0.041% | 0.082%(-0.041)#93 | 0.0082%(+0.033)#329 |
| 94. | Silver Firs | 0.040% | 0.082%(-0.042)#94 | 0.0082%(+0.032)#331 |
| 95. | Vancouver | 0.040% | 0.082%(-0.042)#95 | 0.0082%(+0.032)#333 |
| 96. | Spokane | 0.039% | 0.082%(-0.044)#96 | 0.0082%(+0.030)#337 |
| 97. | Alderwood Manor | 0.038% | 0.082%(-0.044)#97 | 0.0082%(+0.030)#339 |
| 98. | Lynnwood | 0.038% | 0.082%(-0.045)#98 | 0.0082%(+0.029)#340 |
| 99. | Mountlake Terrace | 0.037% | 0.082%(-0.045)#99 | 0.0082%(+0.029)#341 |
| 100. | Olympia | 0.036% | 0.082%(-0.046)#100 | 0.0082%(+0.028)#345 |
Common Questions
What are the Top 10 Cities with the Highest Percentage of Tlingit-Haida Population in Washington?
Top 10 Cities with the Highest Percentage of Tlingit-Haida Population in Washington are:
#1
4.62%
#2
3.42%
#3
3.33%
#4
2.98%
#5
2.87%
#6
1.91%
#7
1.57%
#8
1.36%
#9
1.31%
#10
1.31%
What city has the Highest Percentage of Tlingit-Haida Population in Washington?
Trout Lake has the Highest Percentage of Tlingit-Haida Population in Washington with 4.62%.
What is the Percentage of Tlingit-Haida Population in the State of Washington?
Percentage of Tlingit-Haida Population in Washington is 0.082%.
What is the Percentage of Tlingit-Haida Population in the United States?
Percentage of Tlingit-Haida Population in the United States is 0.0082%.