Tampico, WA Map & Demographics
Tampico Map
Tampico Overview
$24,190
PER CAPITA INCOME
$108,750
AVG FAMILY INCOME
$103,889
AVG HOUSEHOLD INCOME
76.9%
WAGE / INCOME GAP [ % ]
23.1¢/ $1
WAGE / INCOME GAP [ $ ]
0.21
INEQUALITY / GINI INDEX
455
TOTAL POPULATION
213
MALE POPULATION
242
FEMALE POPULATION
88.02
MALES / 100 FEMALES
113.62
FEMALES / 100 MALES
29.6
MEDIAN AGE
3.7
AVG FAMILY SIZE
3.5
AVG HOUSEHOLD SIZE
185
LABOR FORCE [ PEOPLE ]
74.0%
PERCENT IN LABOR FORCE
14.6%
UNEMPLOYMENT RATE
Income in Tampico
Income Overview in Tampico
Per Capita Income in Tampico is $24,190, while median incomes of families and households are $108,750 and $103,889 respectively.
| Characteristic | Number | Measure |
| Per Capita Income | 455 | $24,190 |
| Median Family Income | 110 | $108,750 |
| Mean Family Income | 110 | $91,287 |
| Median Household Income | 130 | $103,889 |
| Mean Household Income | 130 | $87,481 |
| Income Deficit | 110 | $0 |
| Wage / Income Gap (%) | 455 | 76.88% |
| Wage / Income Gap ($) | 455 | 23.12¢ per $1 |
| Gini / Inequality Index | 455 | 0.21 |
Earnings by Sex in Tampico
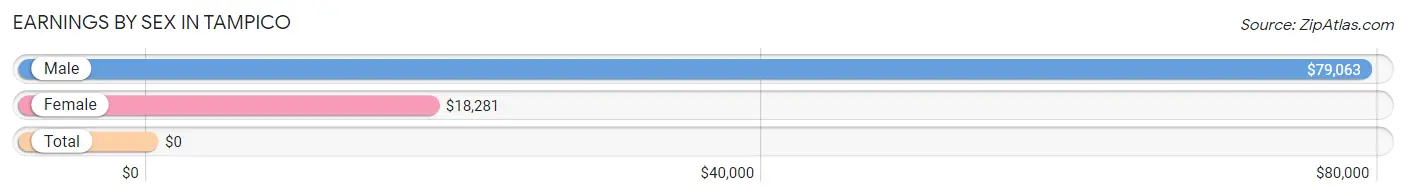
| Sex | Number | Average Earnings |
| Male | 122 (62.2%) | $79,063 |
| Female | 74 (37.8%) | $18,281 |
| Total | 196 (100.0%) | $0 |
Earnings by Sex by Income Bracket in Tampico
The most common earnings brackets in Tampico are $75,000 to $99,999 for men (71 | 58.2%) and $17,500 to $19,999 for women (32 | 43.2%).
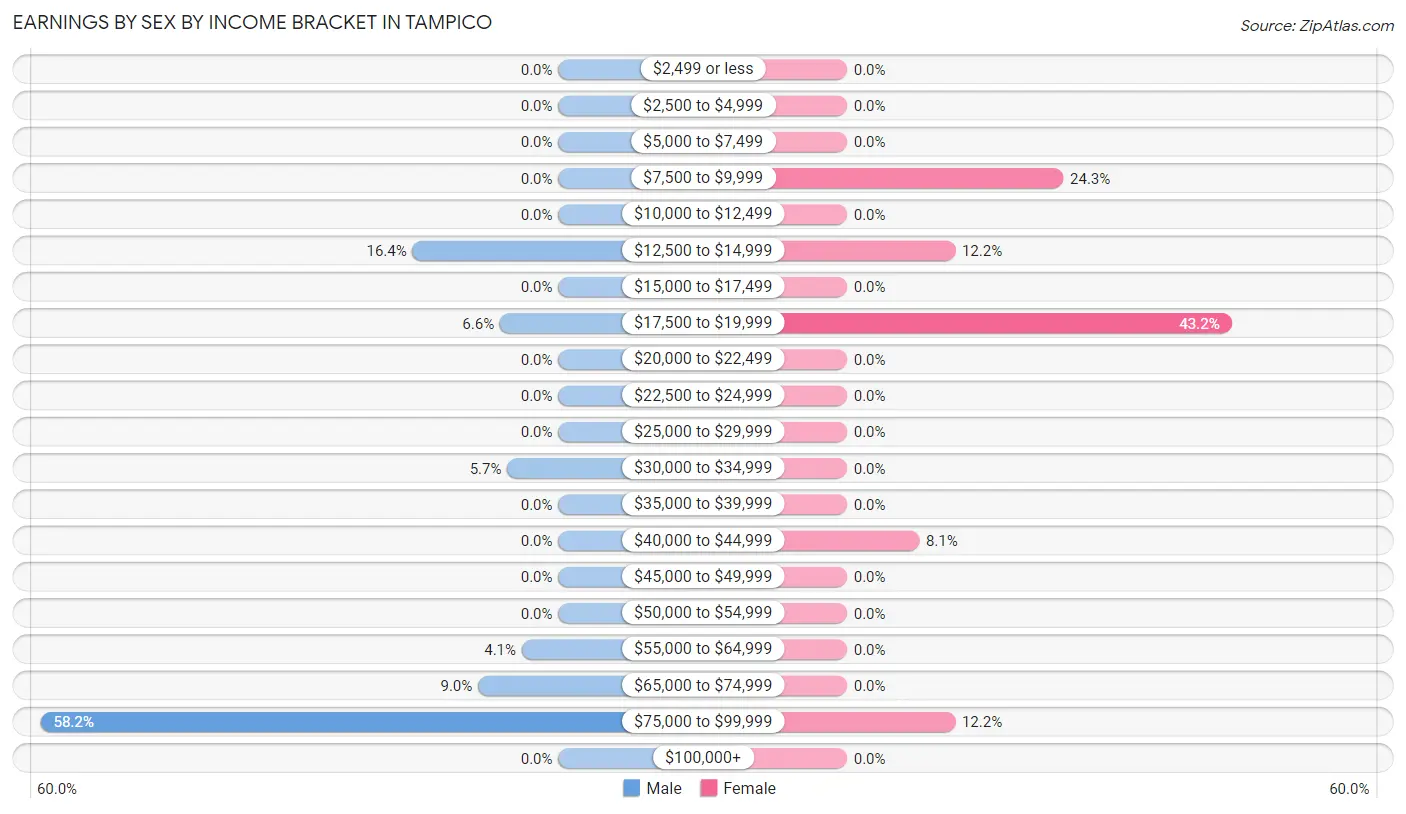
| Income | Male | Female |
| $2,499 or less | 0 (0.0%) | 0 (0.0%) |
| $2,500 to $4,999 | 0 (0.0%) | 0 (0.0%) |
| $5,000 to $7,499 | 0 (0.0%) | 0 (0.0%) |
| $7,500 to $9,999 | 0 (0.0%) | 18 (24.3%) |
| $10,000 to $12,499 | 0 (0.0%) | 0 (0.0%) |
| $12,500 to $14,999 | 20 (16.4%) | 9 (12.2%) |
| $15,000 to $17,499 | 0 (0.0%) | 0 (0.0%) |
| $17,500 to $19,999 | 8 (6.6%) | 32 (43.2%) |
| $20,000 to $22,499 | 0 (0.0%) | 0 (0.0%) |
| $22,500 to $24,999 | 0 (0.0%) | 0 (0.0%) |
| $25,000 to $29,999 | 0 (0.0%) | 0 (0.0%) |
| $30,000 to $34,999 | 7 (5.7%) | 0 (0.0%) |
| $35,000 to $39,999 | 0 (0.0%) | 0 (0.0%) |
| $40,000 to $44,999 | 0 (0.0%) | 6 (8.1%) |
| $45,000 to $49,999 | 0 (0.0%) | 0 (0.0%) |
| $50,000 to $54,999 | 0 (0.0%) | 0 (0.0%) |
| $55,000 to $64,999 | 5 (4.1%) | 0 (0.0%) |
| $65,000 to $74,999 | 11 (9.0%) | 0 (0.0%) |
| $75,000 to $99,999 | 71 (58.2%) | 9 (12.2%) |
| $100,000+ | 0 (0.0%) | 0 (0.0%) |
| Total | 122 (100.0%) | 74 (100.0%) |
Earnings by Sex by Educational Attainment in Tampico
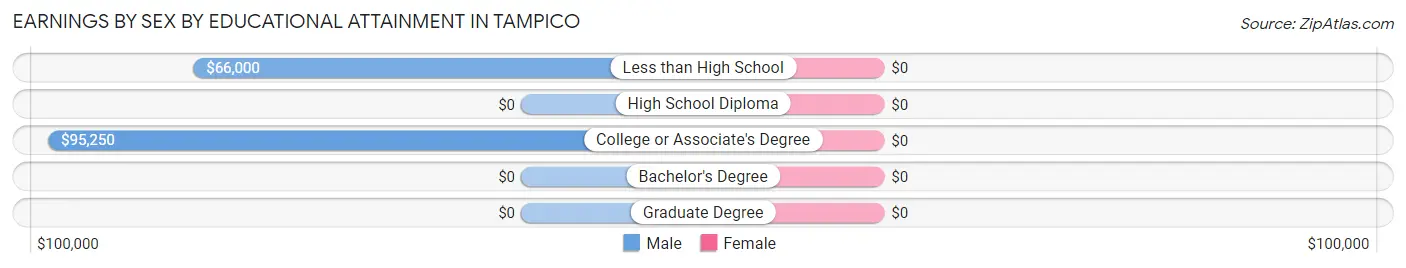
| Educational Attainment | Male Income | Female Income |
| Less than High School | $66,000 | $0 |
| High School Diploma | - | - |
| College or Associate's Degree | $95,250 | $0 |
| Bachelor's Degree | - | - |
| Graduate Degree | - | - |
| Total | $79,063 | $18,281 |
Family Income in Tampico
Family Income Brackets in Tampico
According to the Tampico family income data, there are 70 families falling into the $100,000 to $149,999 income range, which is the most common income bracket and makes up 63.6% of all families.
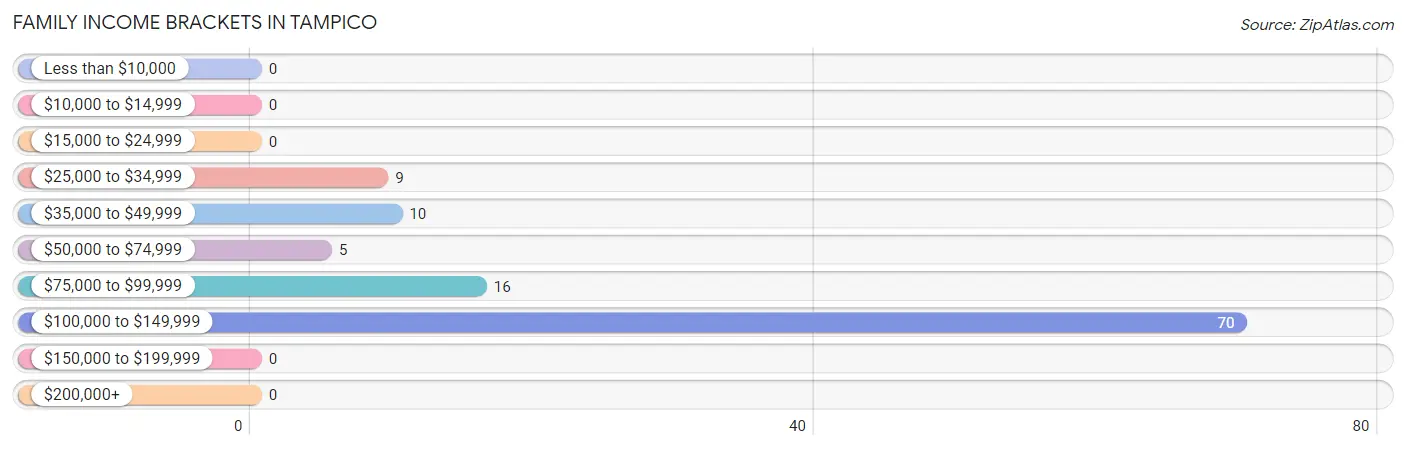
| Income Bracket | # Families | % Families |
| Less than $10,000 | 0 | 0.0% |
| $10,000 to $14,999 | 0 | 0.0% |
| $15,000 to $24,999 | 0 | 0.0% |
| $25,000 to $34,999 | 9 | 8.2% |
| $35,000 to $49,999 | 10 | 9.1% |
| $50,000 to $74,999 | 5 | 4.5% |
| $75,000 to $99,999 | 16 | 14.5% |
| $100,000 to $149,999 | 70 | 63.6% |
| $150,000 to $199,999 | 0 | 0.0% |
| $200,000+ | 0 | 0.0% |
Family Income by Famaliy Size in Tampico
5-person families (80 | 72.7%) account for the highest median family income in Tampico with $113,182 per family, while 5-person families (80 | 72.7%) have the highest median income of $22,636 per family member.
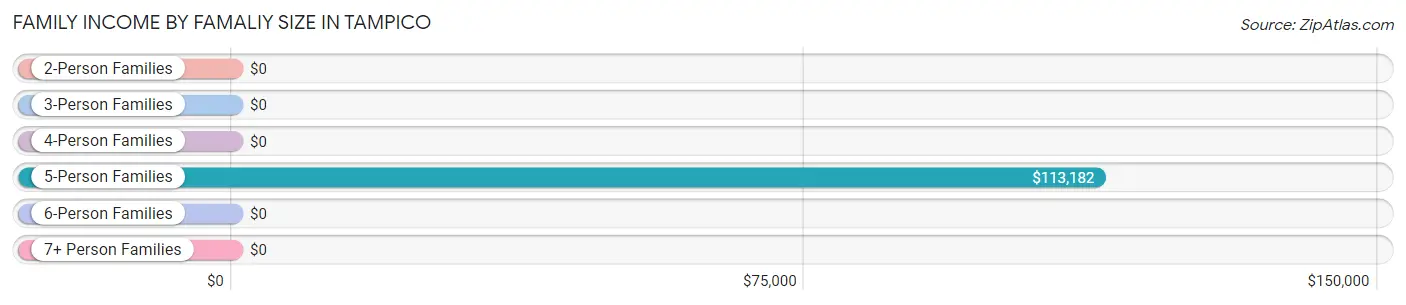
| Income Bracket | # Families | Median Income |
| 2-Person Families | 5 (4.5%) | $0 |
| 3-Person Families | 9 (8.2%) | $0 |
| 4-Person Families | 16 (14.5%) | $0 |
| 5-Person Families | 80 (72.7%) | $113,182 |
| 6-Person Families | 0 (0.0%) | $0 |
| 7+ Person Families | 0 (0.0%) | $0 |
| Total | 110 (100.0%) | $108,750 |
Family Income by Number of Earners in Tampico
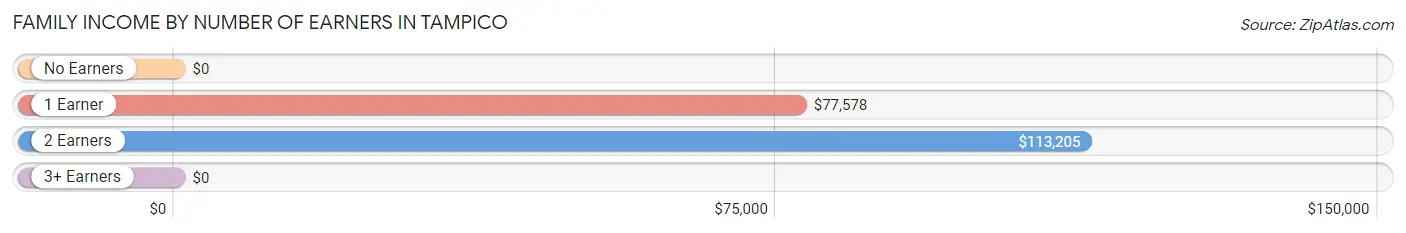
| Number of Earners | # Families | Median Income |
| No Earners | 0 (0.0%) | $0 |
| 1 Earner | 31 (28.2%) | $77,578 |
| 2 Earners | 79 (71.8%) | $113,205 |
| 3+ Earners | 0 (0.0%) | $0 |
| Total | 110 (100.0%) | $108,750 |
Household Income in Tampico
Household Income Brackets in Tampico
With 70 households falling in the category, the $100,000 to $149,999 income range is the most frequent in Tampico, accounting for 53.8% of all households.
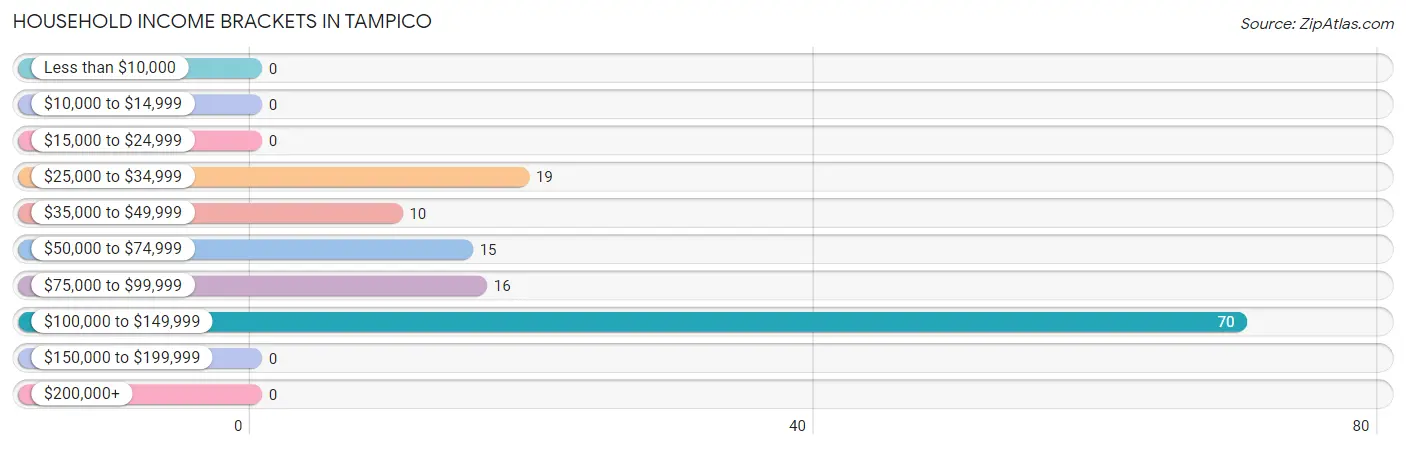
| Income Bracket | # Households | % Households |
| Less than $10,000 | 0 | 0.0% |
| $10,000 to $14,999 | 0 | 0.0% |
| $15,000 to $24,999 | 0 | 0.0% |
| $25,000 to $34,999 | 19 | 14.6% |
| $35,000 to $49,999 | 10 | 7.7% |
| $50,000 to $74,999 | 15 | 11.5% |
| $75,000 to $99,999 | 16 | 12.3% |
| $100,000 to $149,999 | 70 | 53.8% |
| $150,000 to $199,999 | 0 | 0.0% |
| $200,000+ | 0 | 0.0% |
Household Income by Householder Age in Tampico
The median household income in Tampico is $103,889, with the highest median household income of $113,182 found in the 25 to 44 years age bracket for the primary householder. A total of 80 households (61.5%) fall into this category.
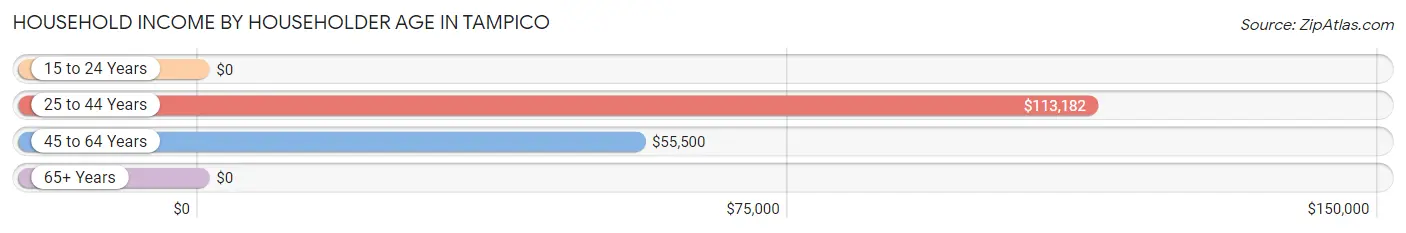
| Income Bracket | # Households | Median Income |
| 15 to 24 Years | 0 (0.0%) | $0 |
| 25 to 44 Years | 80 (61.5%) | $113,182 |
| 45 to 64 Years | 40 (30.8%) | $55,500 |
| 65+ Years | 10 (7.7%) | $0 |
| Total | 130 (100.0%) | $103,889 |
Poverty in Tampico
Income Below Poverty by Sex and Age in Tampico
With 12.2% poverty level for males and 15.3% for females among the residents of Tampico, under 5 year old males and 18 to 24 year old females are the most vulnerable to poverty, with 9 males (100.0%) and 10 females (100.0%) in their respective age groups living below the poverty level.
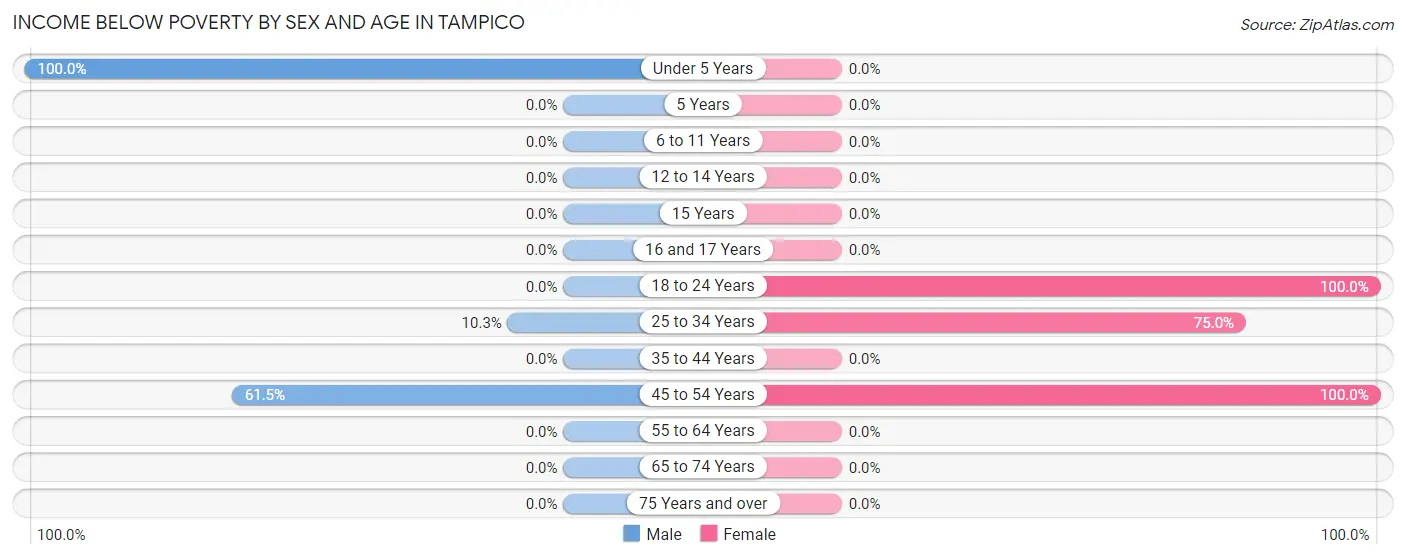
| Age Bracket | Male | Female |
| Under 5 Years | 9 (100.0%) | 0 (0.0%) |
| 5 Years | 0 (0.0%) | 0 (0.0%) |
| 6 to 11 Years | 0 (0.0%) | 0 (0.0%) |
| 12 to 14 Years | 0 (0.0%) | 0 (0.0%) |
| 15 Years | 0 (0.0%) | 0 (0.0%) |
| 16 and 17 Years | 0 (0.0%) | 0 (0.0%) |
| 18 to 24 Years | 0 (0.0%) | 10 (100.0%) |
| 25 to 34 Years | 9 (10.3%) | 18 (75.0%) |
| 35 to 44 Years | 0 (0.0%) | 0 (0.0%) |
| 45 to 54 Years | 8 (61.5%) | 9 (100.0%) |
| 55 to 64 Years | 0 (0.0%) | 0 (0.0%) |
| 65 to 74 Years | 0 (0.0%) | 0 (0.0%) |
| 75 Years and over | 0 (0.0%) | 0 (0.0%) |
| Total | 26 (12.2%) | 37 (15.3%) |
Income Above Poverty by Sex and Age in Tampico
According to the poverty statistics in Tampico, males aged 6 to 11 years and females aged under 5 years are the age groups that are most secure financially, with 100.0% of males and 100.0% of females in these age groups living above the poverty line.
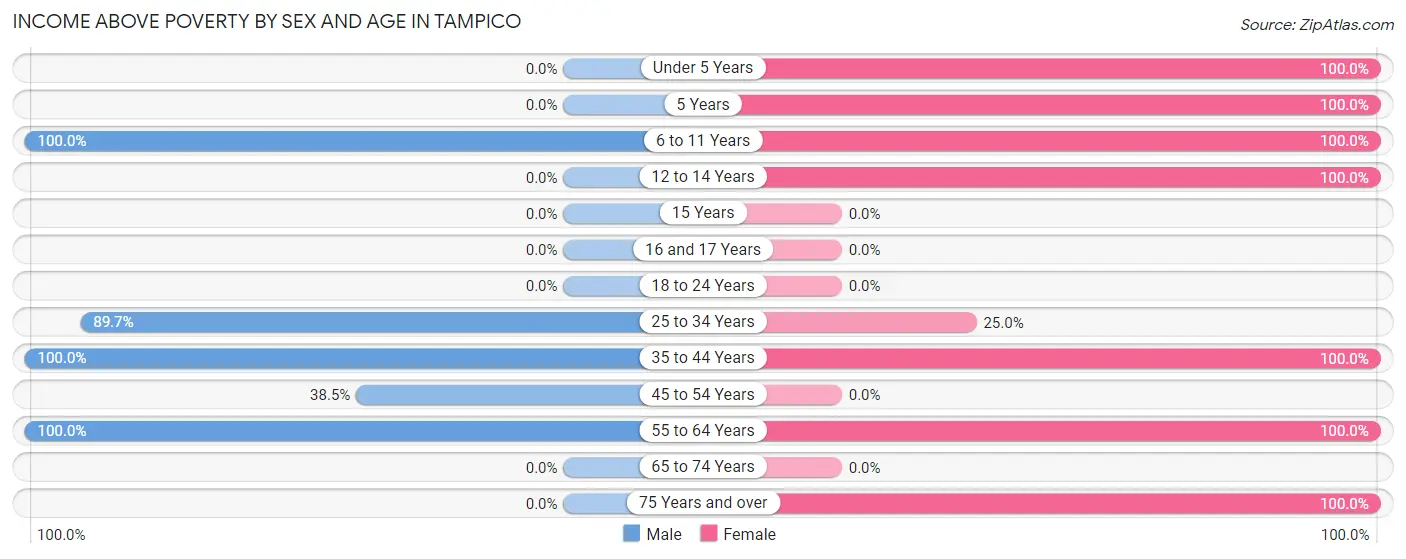
| Age Bracket | Male | Female |
| Under 5 Years | 0 (0.0%) | 9 (100.0%) |
| 5 Years | 0 (0.0%) | 7 (100.0%) |
| 6 to 11 Years | 67 (100.0%) | 97 (100.0%) |
| 12 to 14 Years | 0 (0.0%) | 16 (100.0%) |
| 15 Years | 0 (0.0%) | 0 (0.0%) |
| 16 and 17 Years | 0 (0.0%) | 0 (0.0%) |
| 18 to 24 Years | 0 (0.0%) | 0 (0.0%) |
| 25 to 34 Years | 78 (89.7%) | 6 (25.0%) |
| 35 to 44 Years | 11 (100.0%) | 41 (100.0%) |
| 45 to 54 Years | 5 (38.5%) | 0 (0.0%) |
| 55 to 64 Years | 26 (100.0%) | 19 (100.0%) |
| 65 to 74 Years | 0 (0.0%) | 0 (0.0%) |
| 75 Years and over | 0 (0.0%) | 10 (100.0%) |
| Total | 187 (87.8%) | 205 (84.7%) |
Income Below Poverty Among Married-Couple Families in Tampico
The poverty statistics for married-couple families in Tampico show that 9.6% or 9 of the total 94 families live below the poverty line. Families with 1 or 2 children have the highest poverty rate of 26.5%, comprising of 9 families. On the other hand, families with no children have the lowest poverty rate of 0.0%, which includes 0 families.
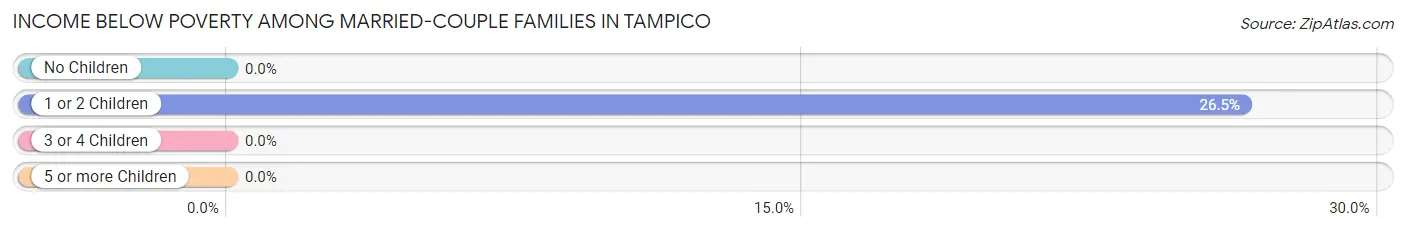
| Children | Above Poverty | Below Poverty |
| No Children | 5 (100.0%) | 0 (0.0%) |
| 1 or 2 Children | 25 (73.5%) | 9 (26.5%) |
| 3 or 4 Children | 55 (100.0%) | 0 (0.0%) |
| 5 or more Children | 0 (0.0%) | 0 (0.0%) |
| Total | 85 (90.4%) | 9 (9.6%) |
Income Below Poverty Among Single-Parent Households in Tampico
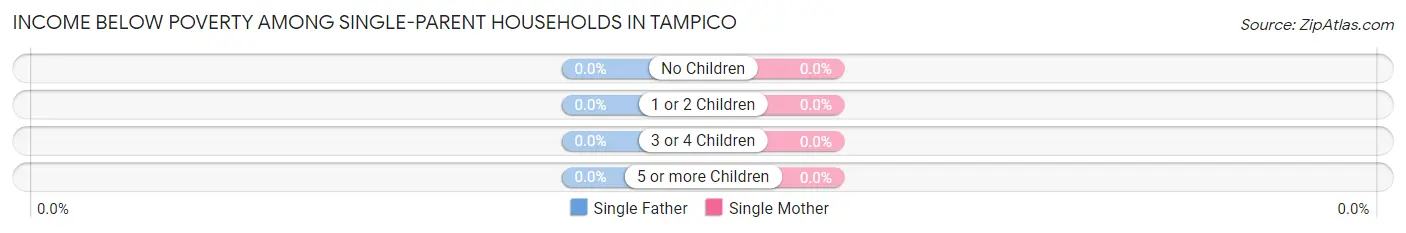
| Children | Single Father | Single Mother |
| No Children | 0 (0.0%) | 0 (0.0%) |
| 1 or 2 Children | 0 (0.0%) | 0 (0.0%) |
| 3 or 4 Children | 0 (0.0%) | 0 (0.0%) |
| 5 or more Children | 0 (0.0%) | 0 (0.0%) |
| Total | 0 (0.0%) | 0 (0.0%) |
Income Below Poverty Among Married-Couple vs Single-Parent Households in Tampico
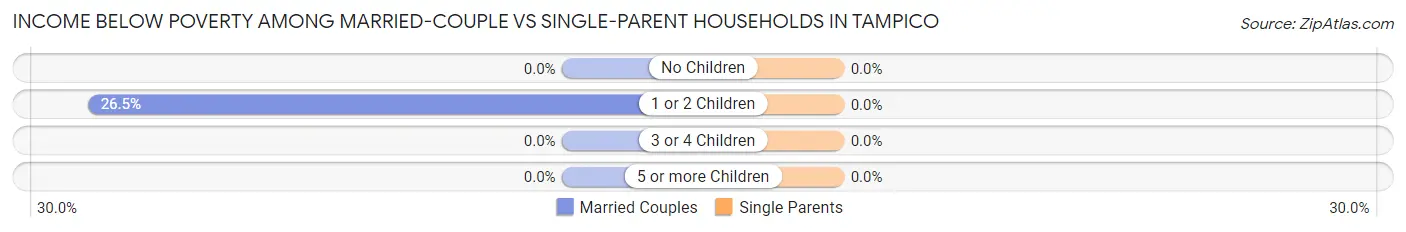
| Children | Married-Couple Families | Single-Parent Households |
| No Children | 0 (0.0%) | 0 (0.0%) |
| 1 or 2 Children | 9 (26.5%) | 0 (0.0%) |
| 3 or 4 Children | 0 (0.0%) | 0 (0.0%) |
| 5 or more Children | 0 (0.0%) | 0 (0.0%) |
| Total | 9 (9.6%) | 0 (0.0%) |
Race in Tampico
The most populous races in Tampico are White / Caucasian (422 | 92.7%), Hispanic or Latino (111 | 24.4%), and Hawaiian / Pacific (17 | 3.7%).
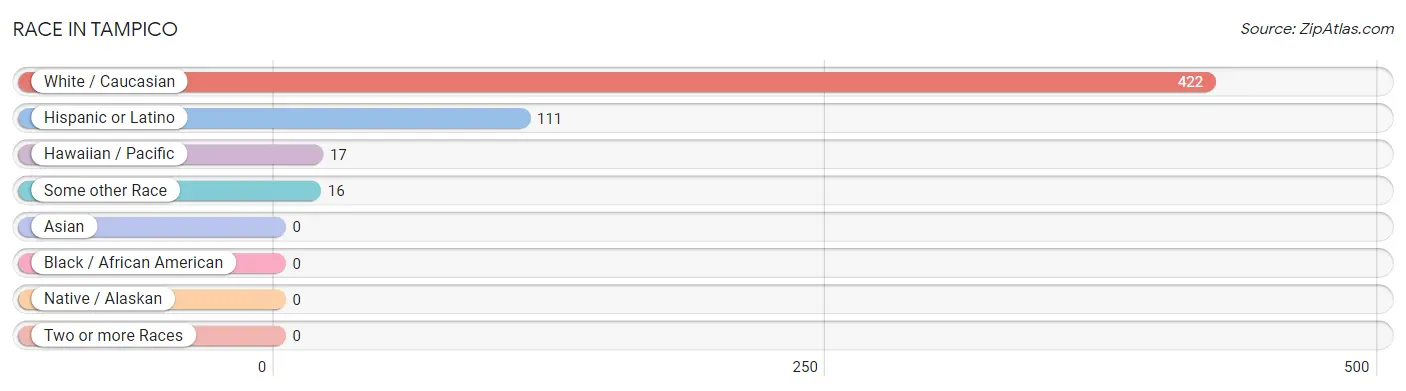
| Race | # Population | % Population |
| Asian | 0 | 0.0% |
| Black / African American | 0 | 0.0% |
| Hawaiian / Pacific | 17 | 3.7% |
| Hispanic or Latino | 111 | 24.4% |
| Native / Alaskan | 0 | 0.0% |
| White / Caucasian | 422 | 92.7% |
| Two or more Races | 0 | 0.0% |
| Some other Race | 16 | 3.5% |
| Total | 455 | 100.0% |
Ancestry in Tampico
The most populous ancestries reported in Tampico are Norwegian (161 | 35.4%), British (127 | 27.9%), Mexican (111 | 24.4%), English (41 | 9.0%), and German (26 | 5.7%), together accounting for 102.4% of all Tampico residents.
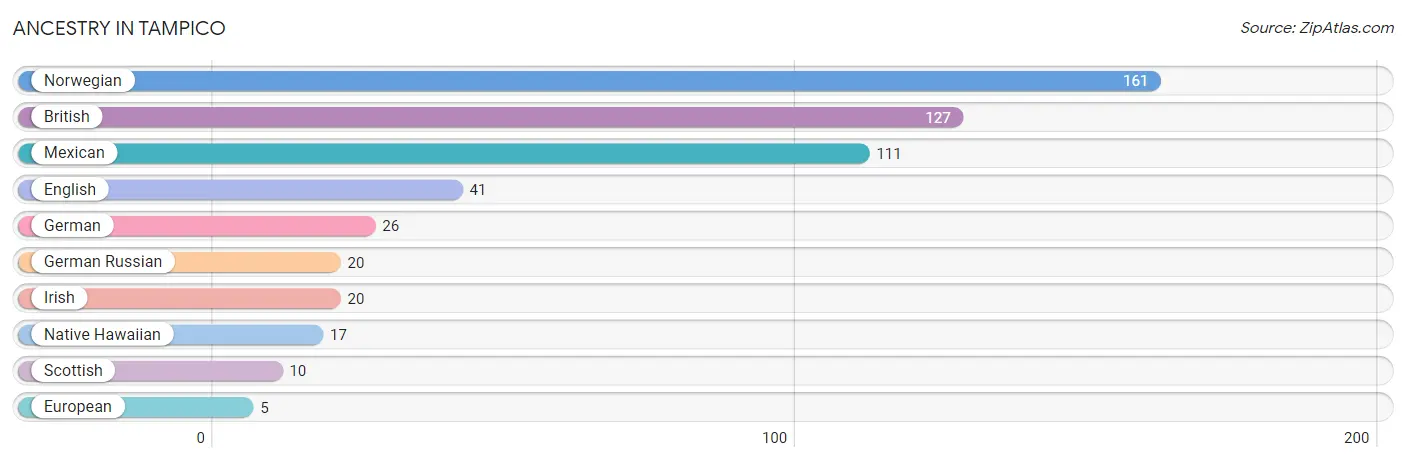
| Ancestry | # Population | % Population |
| British | 127 | 27.9% |
| English | 41 | 9.0% |
| European | 5 | 1.1% |
| German | 26 | 5.7% |
| German Russian | 20 | 4.4% |
| Irish | 20 | 4.4% |
| Mexican | 111 | 24.4% |
| Native Hawaiian | 17 | 3.7% |
| Norwegian | 161 | 35.4% |
| Scottish | 10 | 2.2% | View All 10 Rows |
Immigrants in Tampico
The most numerous immigrant groups reported in Tampico came from Central America (26 | 5.7%), Latin America (26 | 5.7%), and Mexico (26 | 5.7%), together accounting for 17.1% of all Tampico residents.
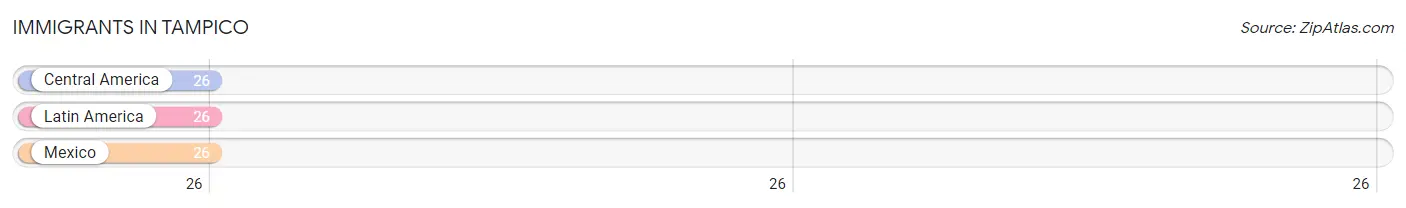
| Immigration Origin | # Population | % Population |
| Central America | 26 | 5.7% |
| Latin America | 26 | 5.7% |
| Mexico | 26 | 5.7% | View All 3 Rows |
Sex and Age in Tampico
Sex and Age in Tampico
The most populous age groups in Tampico are 30 to 34 Years (78 | 36.6%) for men and 5 to 9 Years (86 | 35.5%) for women.
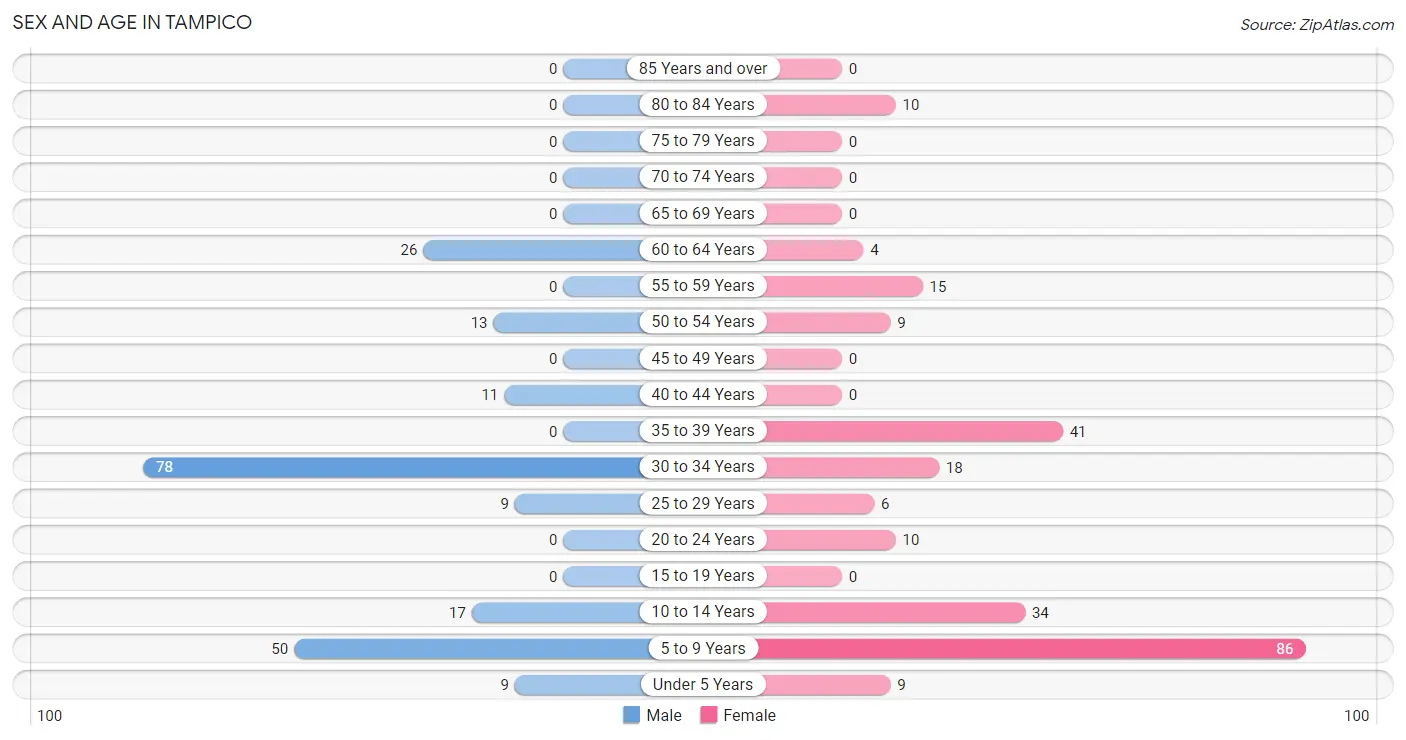
| Age Bracket | Male | Female |
| Under 5 Years | 9 (4.2%) | 9 (3.7%) |
| 5 to 9 Years | 50 (23.5%) | 86 (35.5%) |
| 10 to 14 Years | 17 (8.0%) | 34 (14.1%) |
| 15 to 19 Years | 0 (0.0%) | 0 (0.0%) |
| 20 to 24 Years | 0 (0.0%) | 10 (4.1%) |
| 25 to 29 Years | 9 (4.2%) | 6 (2.5%) |
| 30 to 34 Years | 78 (36.6%) | 18 (7.4%) |
| 35 to 39 Years | 0 (0.0%) | 41 (16.9%) |
| 40 to 44 Years | 11 (5.2%) | 0 (0.0%) |
| 45 to 49 Years | 0 (0.0%) | 0 (0.0%) |
| 50 to 54 Years | 13 (6.1%) | 9 (3.7%) |
| 55 to 59 Years | 0 (0.0%) | 15 (6.2%) |
| 60 to 64 Years | 26 (12.2%) | 4 (1.7%) |
| 65 to 69 Years | 0 (0.0%) | 0 (0.0%) |
| 70 to 74 Years | 0 (0.0%) | 0 (0.0%) |
| 75 to 79 Years | 0 (0.0%) | 0 (0.0%) |
| 80 to 84 Years | 0 (0.0%) | 10 (4.1%) |
| 85 Years and over | 0 (0.0%) | 0 (0.0%) |
| Total | 213 (100.0%) | 242 (100.0%) |
Families and Households in Tampico
Median Family Size in Tampico
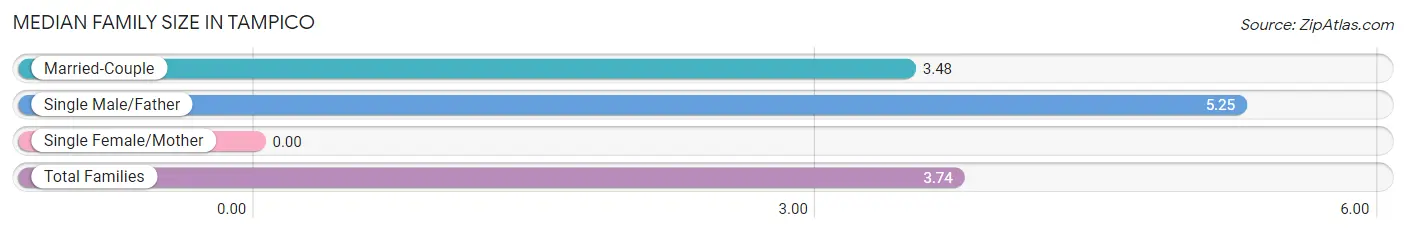
| Family Type | # Families | Family Size |
| Married-Couple | 94 (85.5%) | 3.48 |
| Single Male/Father | 16 (14.5%) | 5.25 |
| Single Female/Mother | 0 (0.0%) | - |
| Total Families | 110 (100.0%) | 3.74 |
Median Household Size in Tampico
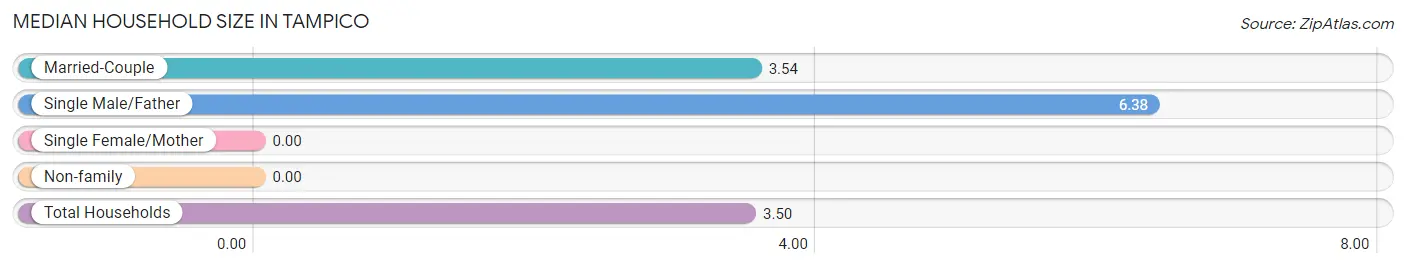
| Household Type | # Households | Household Size |
| Married-Couple | 94 (72.3%) | 3.54 |
| Single Male/Father | 16 (12.3%) | 6.38 |
| Single Female/Mother | 0 (0.0%) | - |
| Non-family | 20 (15.4%) | - |
| Total Households | 130 (100.0%) | 3.50 |
Household Size by Marriage Status in Tampico
Out of a total of 130 households in Tampico, 110 (84.6%) are family households, while 20 (15.4%) are nonfamily households. The most numerous type of family households are 5-person households, comprising 70, and the most common type of nonfamily households are 1-person households, comprising 20.
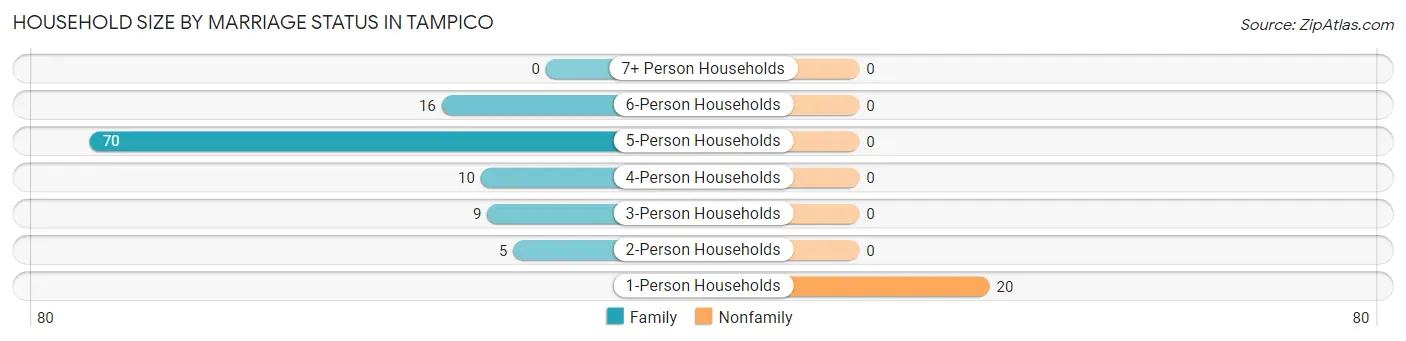
| Household Size | Family Households | Nonfamily Households |
| 1-Person Households | - | 20 (15.4%) |
| 2-Person Households | 5 (3.8%) | 0 (0.0%) |
| 3-Person Households | 9 (6.9%) | 0 (0.0%) |
| 4-Person Households | 10 (7.7%) | 0 (0.0%) |
| 5-Person Households | 70 (53.8%) | 0 (0.0%) |
| 6-Person Households | 16 (12.3%) | 0 (0.0%) |
| 7+ Person Households | 0 (0.0%) | 0 (0.0%) |
| Total | 110 (84.6%) | 20 (15.4%) |
Female Fertility in Tampico
Fertility by Age in Tampico
Average fertility rate in Tampico is 120.0 births per 1,000 women. Women in the age bracket of 35 to 50 years have the highest fertility rate with 220.0 births per 1,000 women. Women in the age bracket of 35 to 50 years acount for 100.0% of all women with births.
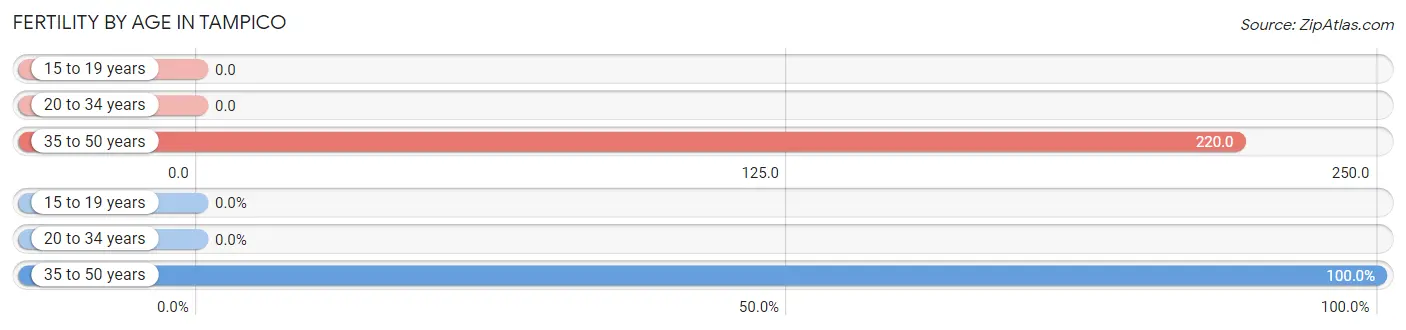
| Age Bracket | Women with Births | Births / 1,000 Women |
| 15 to 19 years | 0 (0.0%) | 0.0 |
| 20 to 34 years | 0 (0.0%) | 0.0 |
| 35 to 50 years | 9 (100.0%) | 220.0 |
| Total | 9 (100.0%) | 120.0 |
Fertility by Age by Marriage Status in Tampico
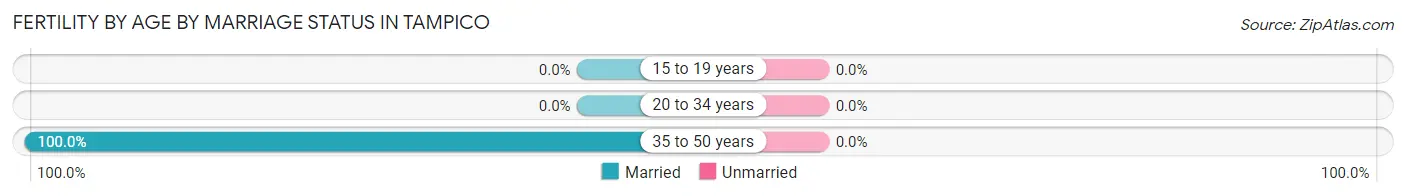
| Age Bracket | Married | Unmarried |
| 15 to 19 years | 0 (0.0%) | 0 (0.0%) |
| 20 to 34 years | 0 (0.0%) | 0 (0.0%) |
| 35 to 50 years | 9 (100.0%) | 0 (0.0%) |
| Total | 9 (100.0%) | 0 (0.0%) |
Fertility by Education in Tampico
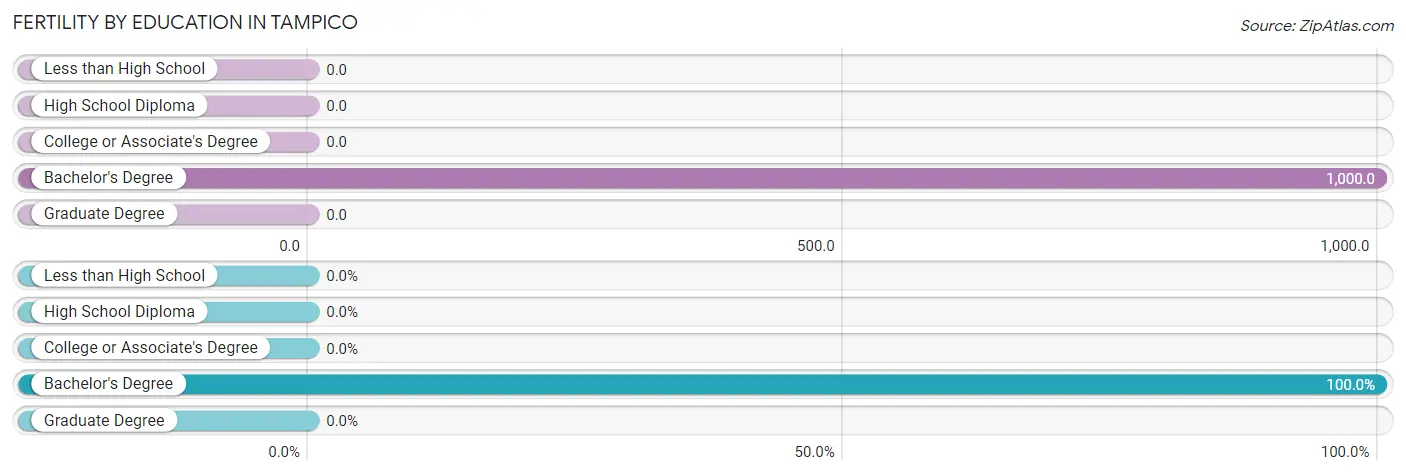
| Educational Attainment | Women with Births | Births / 1,000 Women |
| Less than High School | 0 (0.0%) | 0.0 |
| High School Diploma | 0 (0.0%) | 0.0 |
| College or Associate's Degree | 0 (0.0%) | 0.0 |
| Bachelor's Degree | 9 (100.0%) | 1,000.0 |
| Graduate Degree | 0 (0.0%) | 0.0 |
| Total | 9 (100.0%) | 120.0 |
Fertility by Education by Marriage Status in Tampico
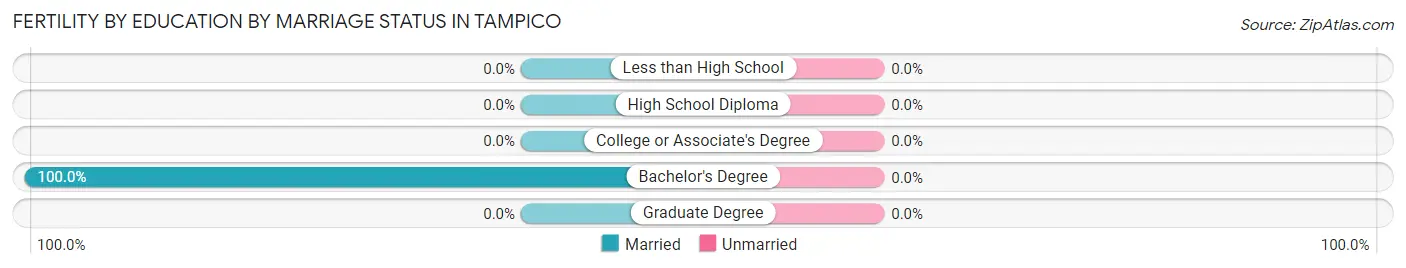
| Educational Attainment | Married | Unmarried |
| Less than High School | 0 (0.0%) | 0 (0.0%) |
| High School Diploma | 0 (0.0%) | 0 (0.0%) |
| College or Associate's Degree | 0 (0.0%) | 0 (0.0%) |
| Bachelor's Degree | 9 (100.0%) | 0 (0.0%) |
| Graduate Degree | 0 (0.0%) | 0 (0.0%) |
| Total | 9 (100.0%) | 0 (0.0%) |
Employment Characteristics in Tampico
Employment by Class of Employer in Tampico
Among the 158 employed individuals in Tampico, private company employees (132 | 83.5%), not-for-profit organizations (9 | 5.7%), and local government employees (9 | 5.7%) make up the most common classes of employment.
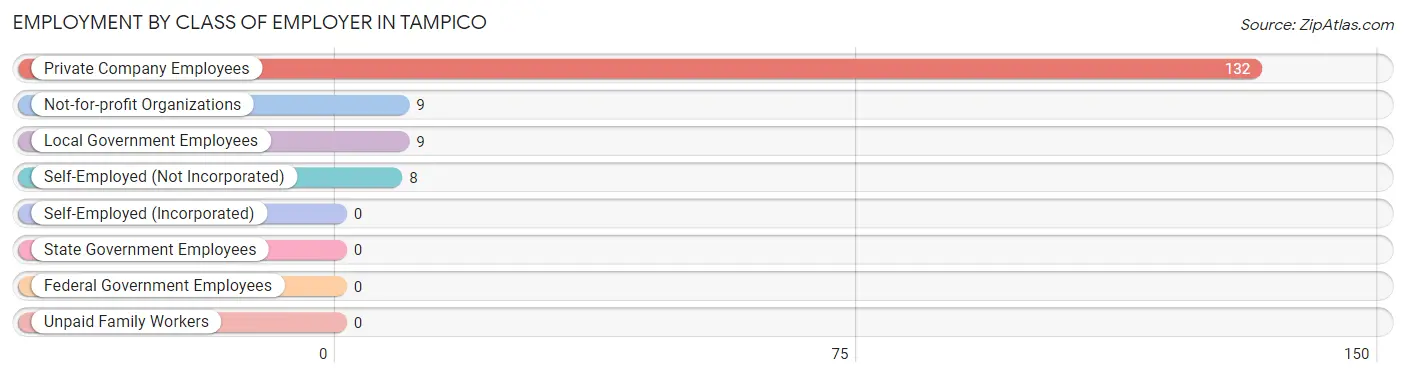
| Employer Class | # Employees | % Employees |
| Private Company Employees | 132 | 83.5% |
| Self-Employed (Incorporated) | 0 | 0.0% |
| Self-Employed (Not Incorporated) | 8 | 5.1% |
| Not-for-profit Organizations | 9 | 5.7% |
| Local Government Employees | 9 | 5.7% |
| State Government Employees | 0 | 0.0% |
| Federal Government Employees | 0 | 0.0% |
| Unpaid Family Workers | 0 | 0.0% |
| Total | 158 | 100.0% |
Employment Status by Age in Tampico
According to the labor force statistics for Tampico, out of the total population over 16 years of age (250), 74.0% or 185 individuals are in the labor force, with 14.6% or 27 of them unemployed. The age group with the highest labor force participation rate is 25 to 29 years, with 100.0% or 15 individuals in the labor force. Within the labor force, the 25 to 29 years age range has the highest percentage of unemployed individuals, with 60.0% or 9 of them being unemployed.
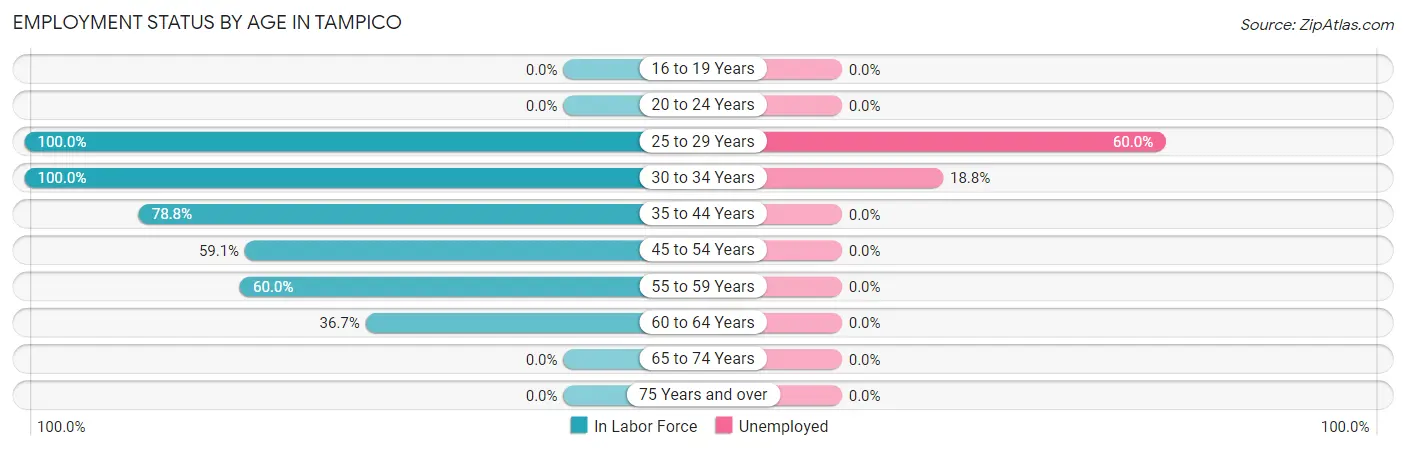
| Age Bracket | In Labor Force | Unemployed |
| 16 to 19 Years | 0 (0.0%) | 0 (0.0%) |
| 20 to 24 Years | 0 (0.0%) | 0 (0.0%) |
| 25 to 29 Years | 15 (100.0%) | 9 (60.0%) |
| 30 to 34 Years | 96 (100.0%) | 18 (18.8%) |
| 35 to 44 Years | 41 (78.8%) | 0 (0.0%) |
| 45 to 54 Years | 13 (59.1%) | 0 (0.0%) |
| 55 to 59 Years | 9 (60.0%) | 0 (0.0%) |
| 60 to 64 Years | 11 (36.7%) | 0 (0.0%) |
| 65 to 74 Years | 0 (0.0%) | 0 (0.0%) |
| 75 Years and over | 0 (0.0%) | 0 (0.0%) |
| Total | 185 (74.0%) | 27 (14.6%) |
Employment Status by Educational Attainment in Tampico
According to labor force statistics for Tampico, 80.4% of individuals (185) out of the total population between 25 and 64 years of age (230) are in the labor force, with 14.6% or 27 of them being unemployed. The group with the highest labor force participation rate are those with the educational attainment of college / associate degree, with 86.3% or 138 individuals in the labor force. Within the labor force, individuals with college / associate degree education have the highest percentage of unemployment, with 19.6% or 27 of them being unemployed.
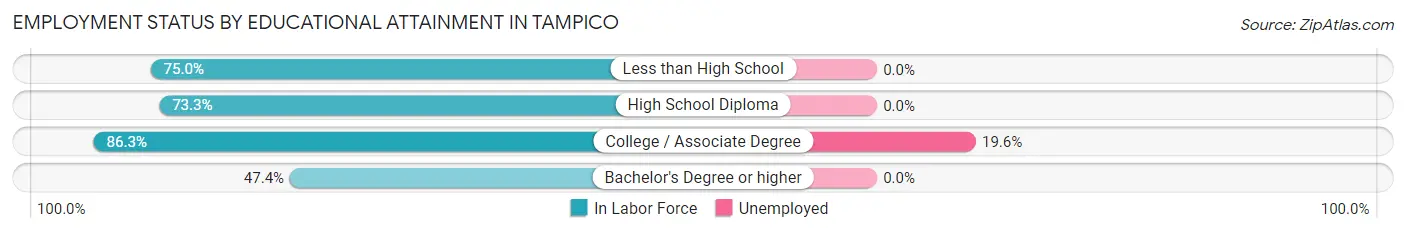
| Educational Attainment | In Labor Force | Unemployed |
| Less than High School | 27 (75.0%) | 0 (0.0%) |
| High School Diploma | 11 (73.3%) | 0 (0.0%) |
| College / Associate Degree | 138 (86.3%) | 31 (19.6%) |
| Bachelor's Degree or higher | 9 (47.4%) | 0 (0.0%) |
| Total | 185 (80.4%) | 34 (14.6%) |
Employment Occupations by Sex in Tampico
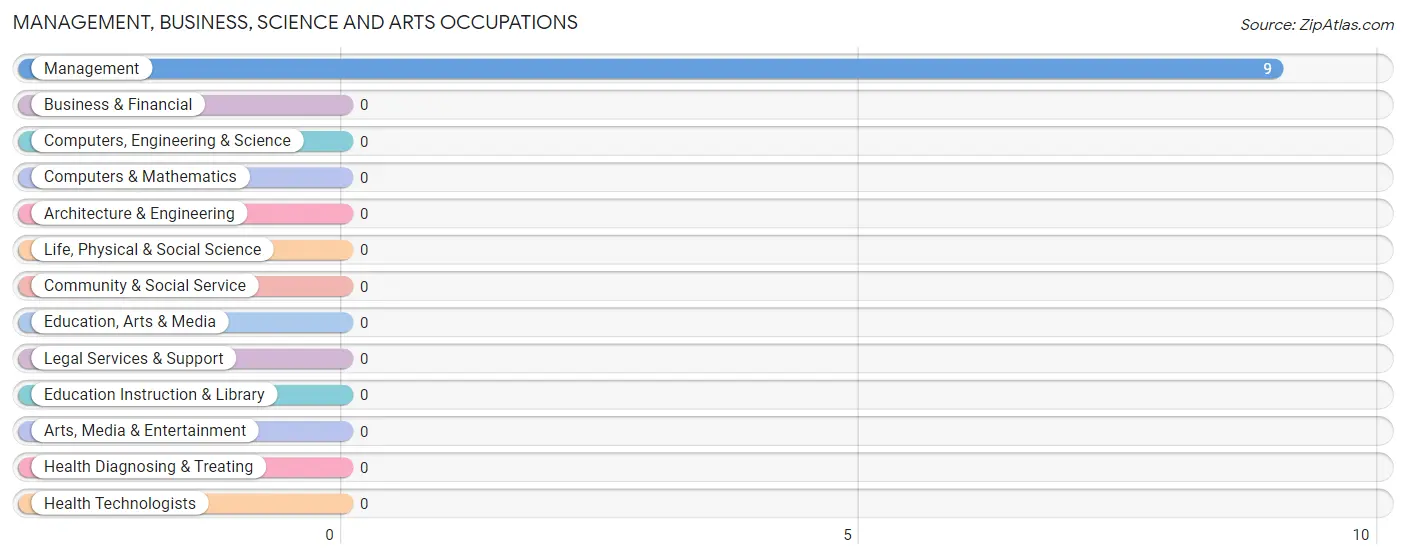
Management, Business, Science and Arts Occupations
The most common Management, Business, Science and Arts occupations in Tampico are , and Management (9 | 5.7%).
Management, Business, Science and Arts Occupations by Sex
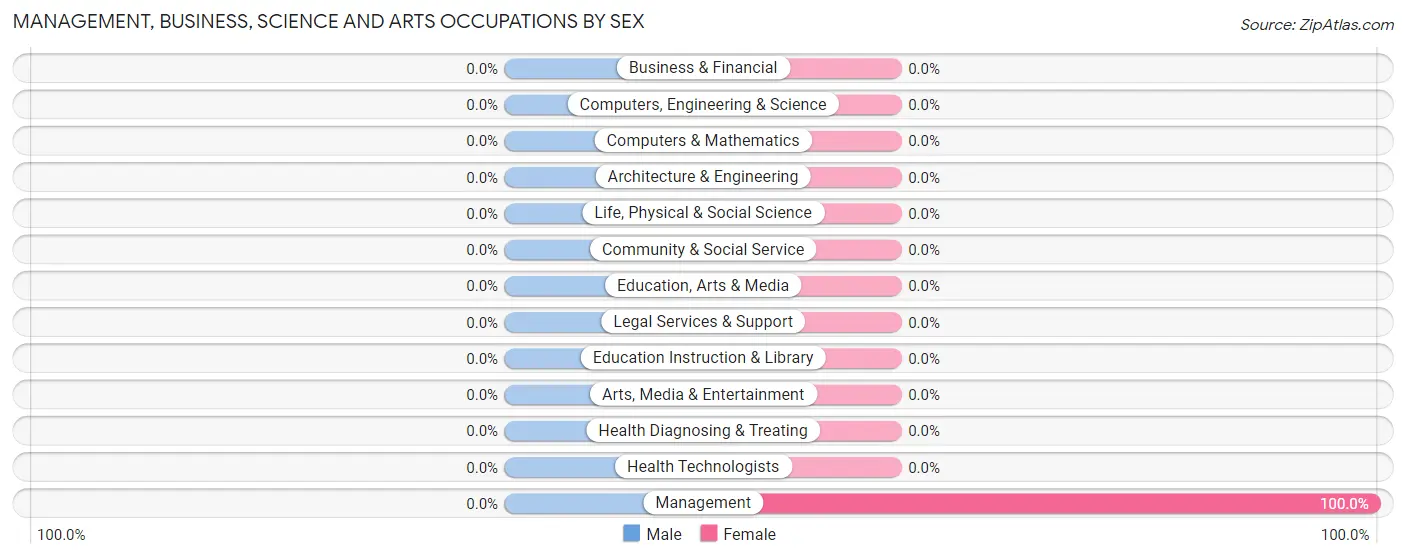
| Occupation | Male | Female |
| Management | 0 (0.0%) | 9 (100.0%) |
| Business & Financial | 0 (0.0%) | 0 (0.0%) |
| Computers, Engineering & Science | 0 (0.0%) | 0 (0.0%) |
| Computers & Mathematics | 0 (0.0%) | 0 (0.0%) |
| Architecture & Engineering | 0 (0.0%) | 0 (0.0%) |
| Life, Physical & Social Science | 0 (0.0%) | 0 (0.0%) |
| Community & Social Service | 0 (0.0%) | 0 (0.0%) |
| Education, Arts & Media | 0 (0.0%) | 0 (0.0%) |
| Legal Services & Support | 0 (0.0%) | 0 (0.0%) |
| Education Instruction & Library | 0 (0.0%) | 0 (0.0%) |
| Arts, Media & Entertainment | 0 (0.0%) | 0 (0.0%) |
| Health Diagnosing & Treating | 0 (0.0%) | 0 (0.0%) |
| Health Technologists | 0 (0.0%) | 0 (0.0%) |
| Total (Category) | 0 (0.0%) | 9 (100.0%) |
| Total (Overall) | 102 (64.6%) | 56 (35.4%) |
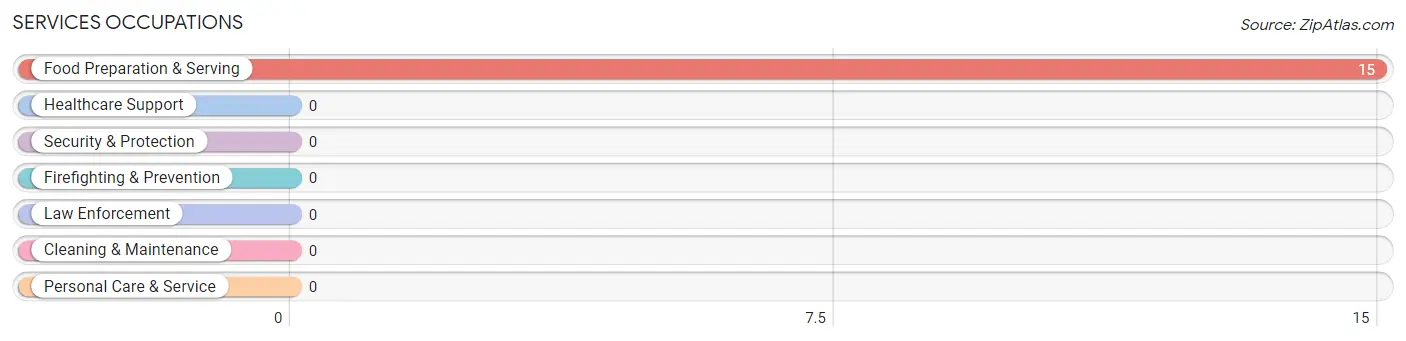
Services Occupations
The most common Services occupations in Tampico are , and Food Preparation & Serving (15 | 9.5%).
Services Occupations by Sex
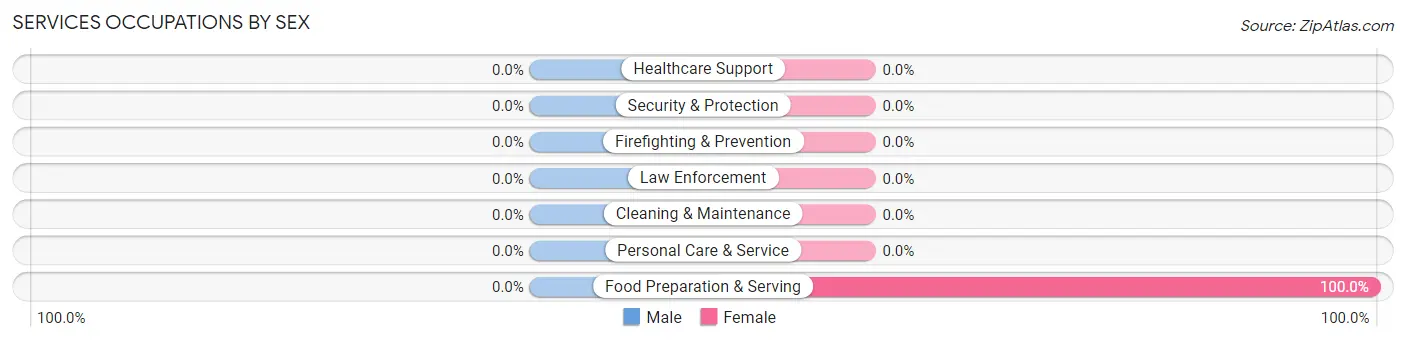
| Occupation | Male | Female |
| Healthcare Support | 0 (0.0%) | 0 (0.0%) |
| Security & Protection | 0 (0.0%) | 0 (0.0%) |
| Firefighting & Prevention | 0 (0.0%) | 0 (0.0%) |
| Law Enforcement | 0 (0.0%) | 0 (0.0%) |
| Food Preparation & Serving | 0 (0.0%) | 15 (100.0%) |
| Cleaning & Maintenance | 0 (0.0%) | 0 (0.0%) |
| Personal Care & Service | 0 (0.0%) | 0 (0.0%) |
| Total (Category) | 0 (0.0%) | 15 (100.0%) |
| Total (Overall) | 102 (64.6%) | 56 (35.4%) |
Sales and Office Occupations
The most common Sales and Office occupations in Tampico are , and Office & Administration (32 | 20.3%).

Sales and Office Occupations by Sex

| Occupation | Male | Female |
| Sales & Related | 0 (0.0%) | 0 (0.0%) |
| Office & Administration | 0 (0.0%) | 32 (100.0%) |
| Total (Category) | 0 (0.0%) | 32 (100.0%) |
| Total (Overall) | 102 (64.6%) | 56 (35.4%) |
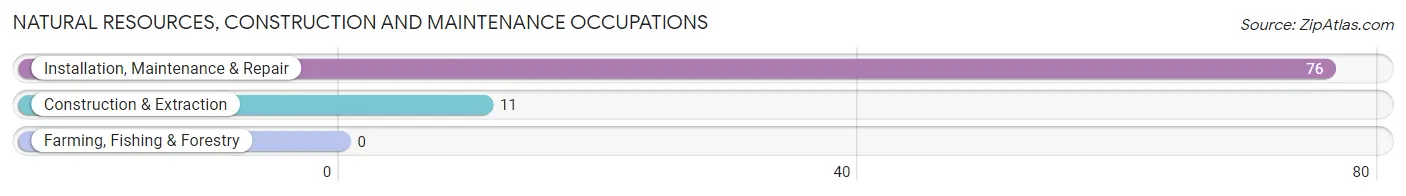
Natural Resources, Construction and Maintenance Occupations
The most common Natural Resources, Construction and Maintenance occupations in Tampico are Installation, Maintenance & Repair (76 | 48.1%), and Construction & Extraction (11 | 7.0%).
Natural Resources, Construction and Maintenance Occupations by Sex
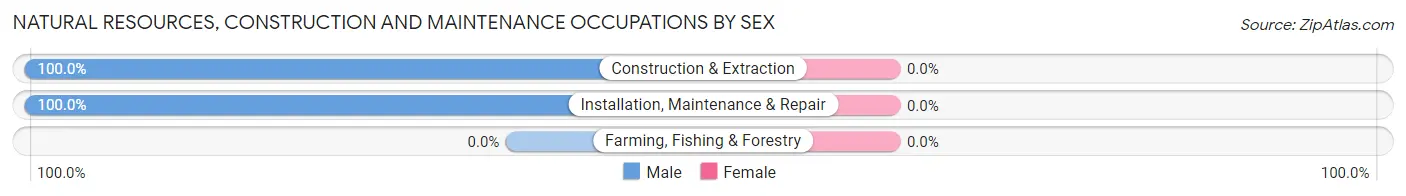
| Occupation | Male | Female |
| Farming, Fishing & Forestry | 0 (0.0%) | 0 (0.0%) |
| Construction & Extraction | 11 (100.0%) | 0 (0.0%) |
| Installation, Maintenance & Repair | 76 (100.0%) | 0 (0.0%) |
| Total (Category) | 87 (100.0%) | 0 (0.0%) |
| Total (Overall) | 102 (64.6%) | 56 (35.4%) |
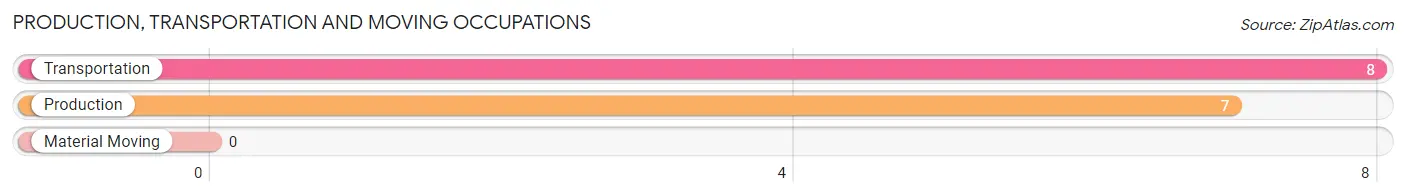
Production, Transportation and Moving Occupations
The most common Production, Transportation and Moving occupations in Tampico are Transportation (8 | 5.1%), and Production (7 | 4.4%).
Production, Transportation and Moving Occupations by Sex
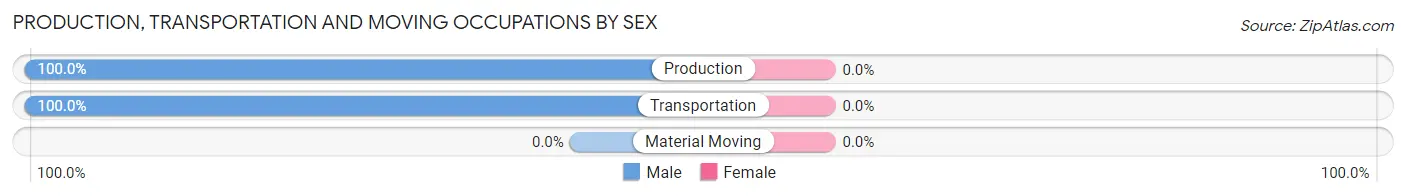
| Occupation | Male | Female |
| Production | 7 (100.0%) | 0 (0.0%) |
| Transportation | 8 (100.0%) | 0 (0.0%) |
| Material Moving | 0 (0.0%) | 0 (0.0%) |
| Total (Category) | 15 (100.0%) | 0 (0.0%) |
| Total (Overall) | 102 (64.6%) | 56 (35.4%) |
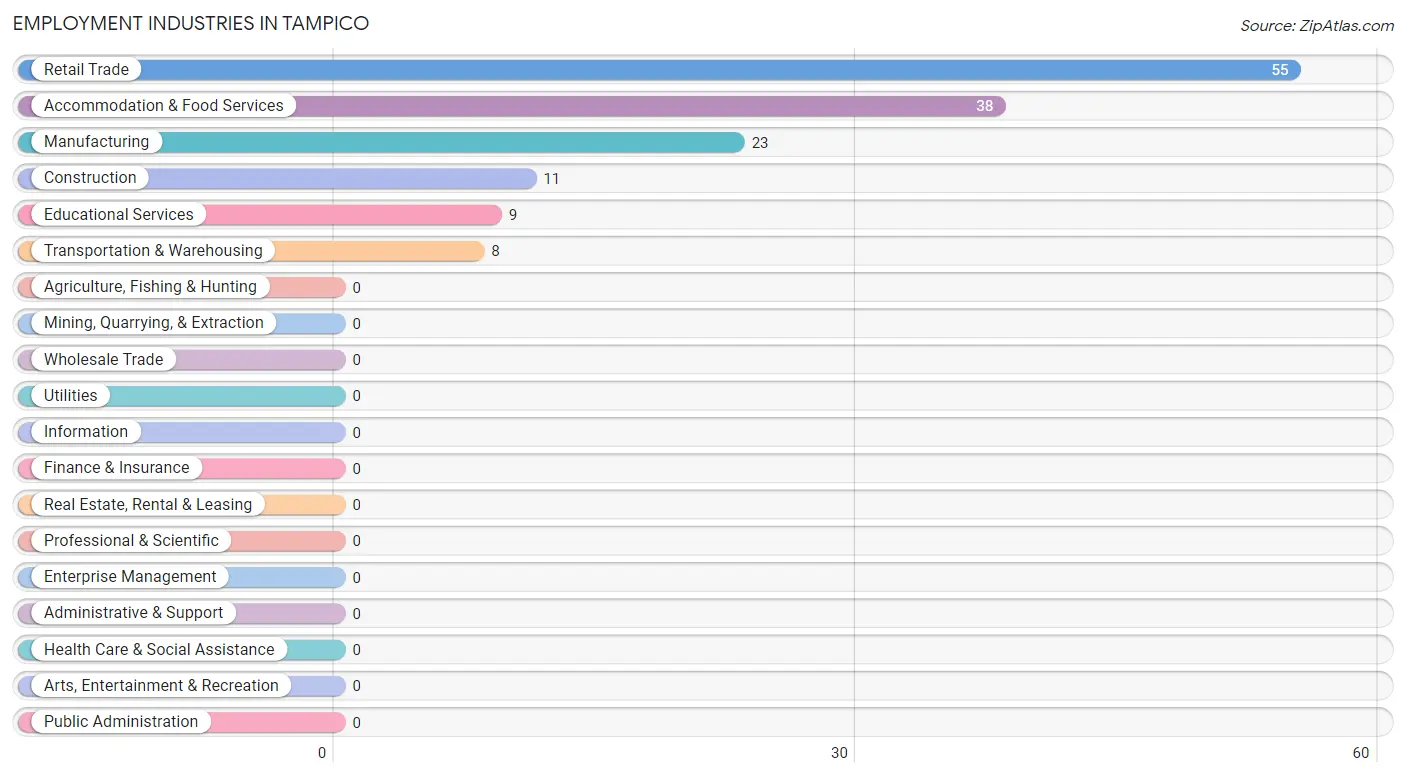
Employment Industries by Sex in Tampico
Employment Industries in Tampico
The major employment industries in Tampico include Retail Trade (55 | 34.8%), Accommodation & Food Services (38 | 24.0%), Manufacturing (23 | 14.6%), Construction (11 | 7.0%), and Educational Services (9 | 5.7%).
Employment Industries by Sex in Tampico
The Tampico industries that see more men than women are Construction (100.0%), Manufacturing (100.0%), and Retail Trade (100.0%), whereas the industries that tend to have a higher number of women are Educational Services (100.0%), and Accommodation & Food Services (100.0%).
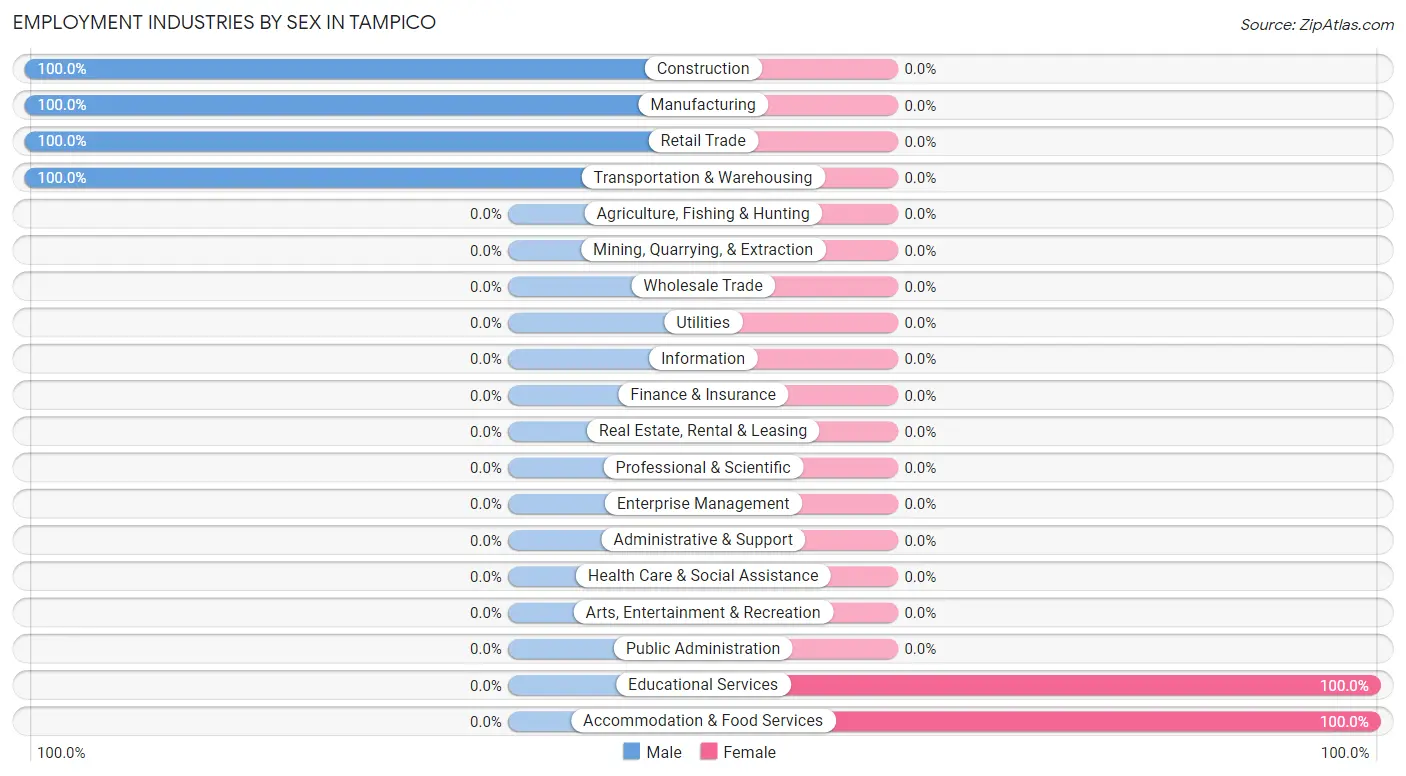
| Industry | Male | Female |
| Agriculture, Fishing & Hunting | 0 (0.0%) | 0 (0.0%) |
| Mining, Quarrying, & Extraction | 0 (0.0%) | 0 (0.0%) |
| Construction | 11 (100.0%) | 0 (0.0%) |
| Manufacturing | 23 (100.0%) | 0 (0.0%) |
| Wholesale Trade | 0 (0.0%) | 0 (0.0%) |
| Retail Trade | 55 (100.0%) | 0 (0.0%) |
| Transportation & Warehousing | 8 (100.0%) | 0 (0.0%) |
| Utilities | 0 (0.0%) | 0 (0.0%) |
| Information | 0 (0.0%) | 0 (0.0%) |
| Finance & Insurance | 0 (0.0%) | 0 (0.0%) |
| Real Estate, Rental & Leasing | 0 (0.0%) | 0 (0.0%) |
| Professional & Scientific | 0 (0.0%) | 0 (0.0%) |
| Enterprise Management | 0 (0.0%) | 0 (0.0%) |
| Administrative & Support | 0 (0.0%) | 0 (0.0%) |
| Educational Services | 0 (0.0%) | 9 (100.0%) |
| Health Care & Social Assistance | 0 (0.0%) | 0 (0.0%) |
| Arts, Entertainment & Recreation | 0 (0.0%) | 0 (0.0%) |
| Accommodation & Food Services | 0 (0.0%) | 38 (100.0%) |
| Public Administration | 0 (0.0%) | 0 (0.0%) |
| Total | 102 (64.6%) | 56 (35.4%) |
Education in Tampico
School Enrollment in Tampico
The most common levels of schooling among the 85 students in Tampico are elementary school (51 | 60.0%), and middle school (34 | 40.0%).
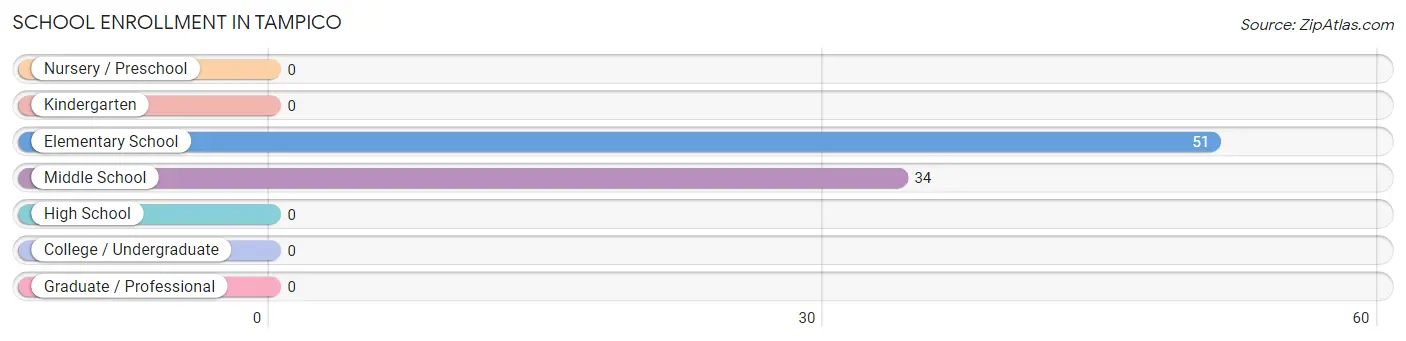
| School Level | # Students | % Students |
| Nursery / Preschool | 0 | 0.0% |
| Kindergarten | 0 | 0.0% |
| Elementary School | 51 | 60.0% |
| Middle School | 34 | 40.0% |
| High School | 0 | 0.0% |
| College / Undergraduate | 0 | 0.0% |
| Graduate / Professional | 0 | 0.0% |
| Total | 85 | 100.0% |
School Enrollment by Age by Funding Source in Tampico
Out of a total of 85 students who are enrolled in schools in Tampico, 51 (60.0%) attend a private institution, while the remaining 34 (40.0%) are enrolled in public schools. The age group of 10 to 14 year olds has the highest likelihood of being enrolled in private schools, with 34 (66.7% in the age bracket) enrolled. Conversely, the age group of 5 to 9 year old has the lowest likelihood of being enrolled in a private school, with 17 (50.0% in the age bracket) attending a public institution.
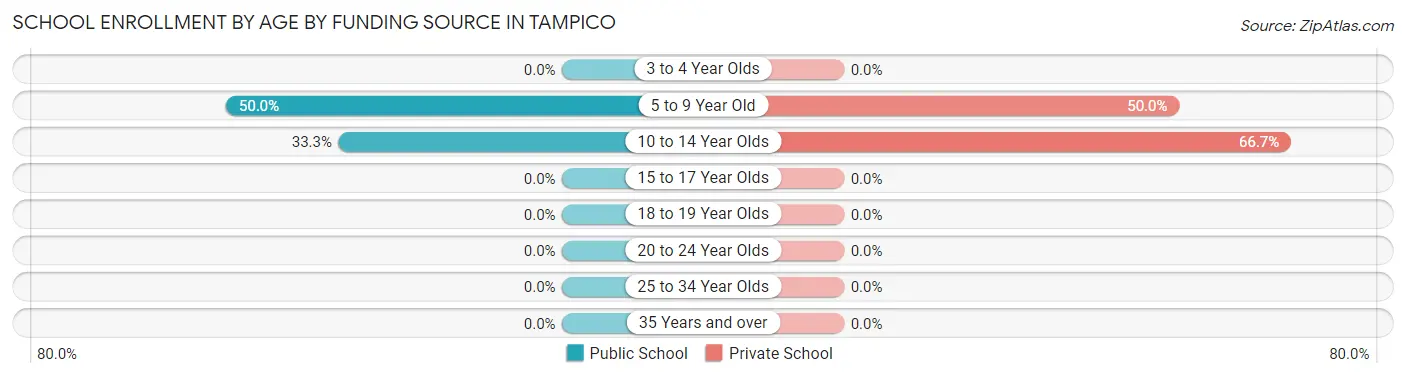
| Age Bracket | Public School | Private School |
| 3 to 4 Year Olds | 0 (0.0%) | 0 (0.0%) |
| 5 to 9 Year Old | 17 (50.0%) | 17 (50.0%) |
| 10 to 14 Year Olds | 17 (33.3%) | 34 (66.7%) |
| 15 to 17 Year Olds | 0 (0.0%) | 0 (0.0%) |
| 18 to 19 Year Olds | 0 (0.0%) | 0 (0.0%) |
| 20 to 24 Year Olds | 0 (0.0%) | 0 (0.0%) |
| 25 to 34 Year Olds | 0 (0.0%) | 0 (0.0%) |
| 35 Years and over | 0 (0.0%) | 0 (0.0%) |
| Total | 34 (40.0%) | 51 (60.0%) |
Educational Attainment by Field of Study in Tampico
Visual & performing arts (10 | 52.6%), and arts & humanities (9 | 47.4%) are the most common fields of study among 19 individuals in Tampico who have obtained a bachelor's degree or higher.
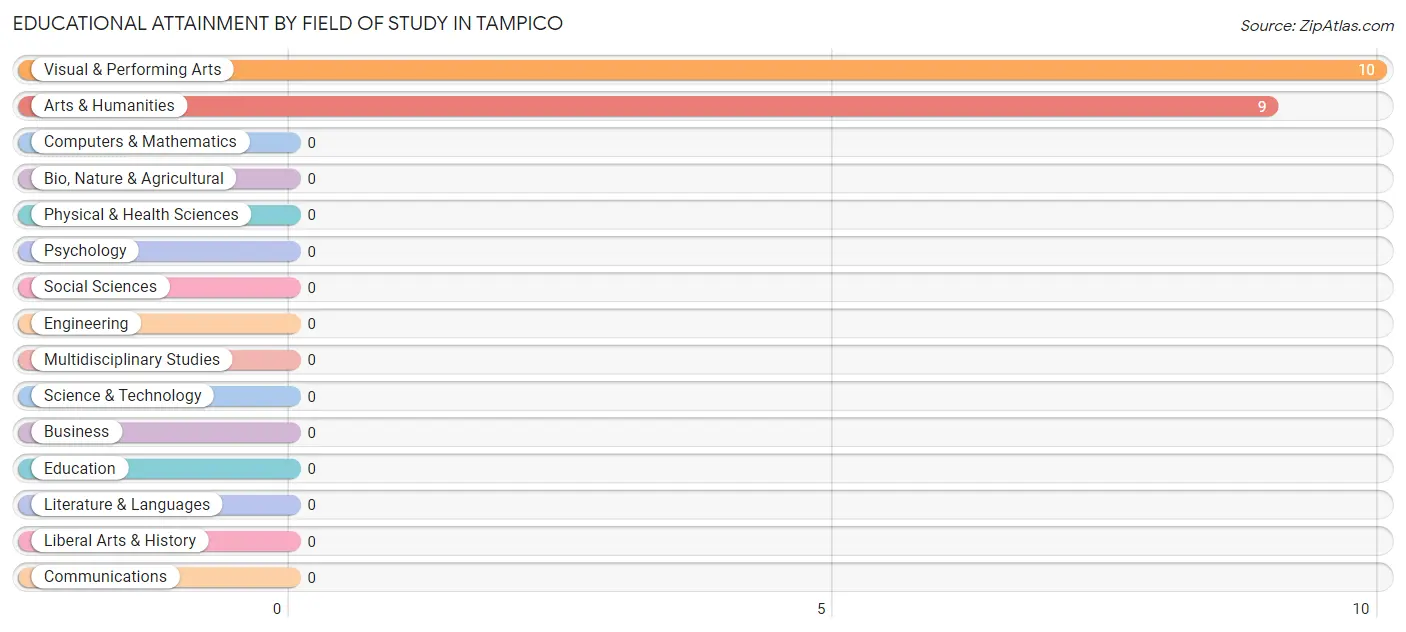
| Field of Study | # Graduates | % Graduates |
| Computers & Mathematics | 0 | 0.0% |
| Bio, Nature & Agricultural | 0 | 0.0% |
| Physical & Health Sciences | 0 | 0.0% |
| Psychology | 0 | 0.0% |
| Social Sciences | 0 | 0.0% |
| Engineering | 0 | 0.0% |
| Multidisciplinary Studies | 0 | 0.0% |
| Science & Technology | 0 | 0.0% |
| Business | 0 | 0.0% |
| Education | 0 | 0.0% |
| Literature & Languages | 0 | 0.0% |
| Liberal Arts & History | 0 | 0.0% |
| Visual & Performing Arts | 10 | 52.6% |
| Communications | 0 | 0.0% |
| Arts & Humanities | 9 | 47.4% |
| Total | 19 | 100.0% |
Transportation & Commute in Tampico
Vehicle Availability by Sex in Tampico
The most prevalent vehicle ownership categories in Tampico are males with 3 vehicles (68, accounting for 66.7%) and females with 3 vehicles (32, making up 121.4%).
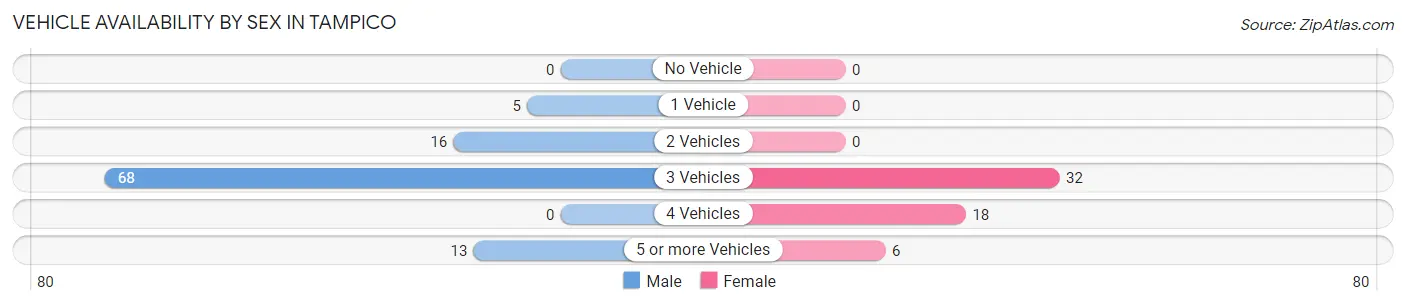
| Vehicles Available | Male | Female |
| No Vehicle | 0 (0.0%) | 0 (0.0%) |
| 1 Vehicle | 5 (4.9%) | 0 (0.0%) |
| 2 Vehicles | 16 (15.7%) | 0 (0.0%) |
| 3 Vehicles | 68 (66.7%) | 32 (57.1%) |
| 4 Vehicles | 0 (0.0%) | 18 (32.1%) |
| 5 or more Vehicles | 13 (12.8%) | 6 (10.7%) |
| Total | 102 (100.0%) | 56 (100.0%) |
Commute Time in Tampico
The most frequently occuring commute durations in Tampico are 45 to 59 minutes (73 commuters, 46.2%), 40 to 44 minutes (37 commuters, 23.4%), and 30 to 34 minutes (29 commuters, 18.3%).
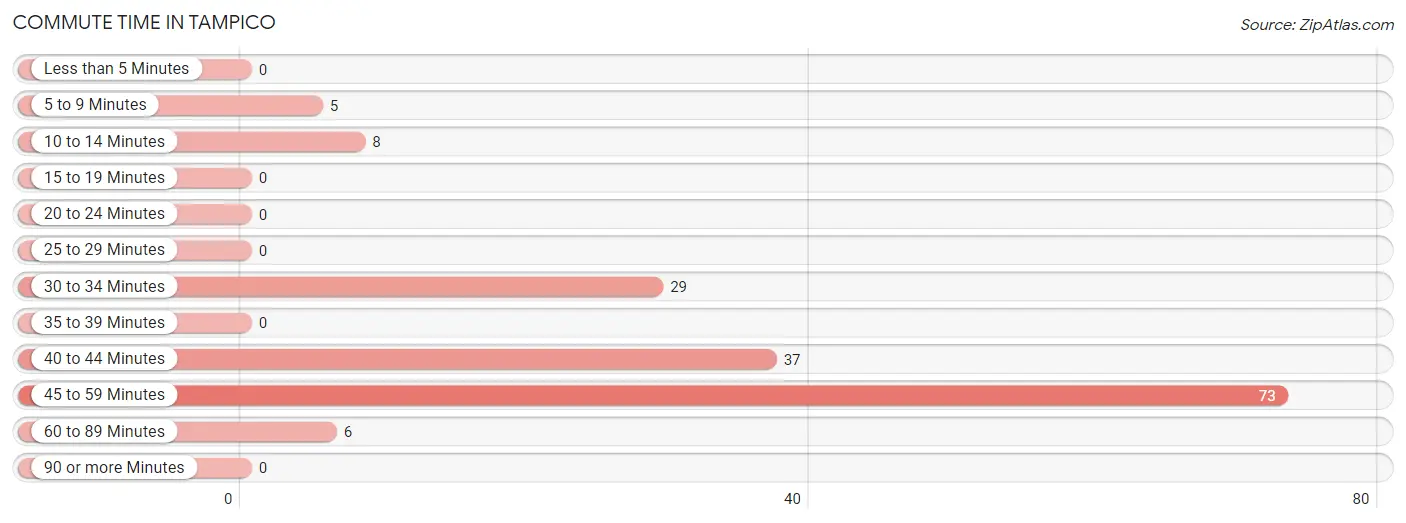
| Commute Time | # Commuters | % Commuters |
| Less than 5 Minutes | 0 | 0.0% |
| 5 to 9 Minutes | 5 | 3.2% |
| 10 to 14 Minutes | 8 | 5.1% |
| 15 to 19 Minutes | 0 | 0.0% |
| 20 to 24 Minutes | 0 | 0.0% |
| 25 to 29 Minutes | 0 | 0.0% |
| 30 to 34 Minutes | 29 | 18.3% |
| 35 to 39 Minutes | 0 | 0.0% |
| 40 to 44 Minutes | 37 | 23.4% |
| 45 to 59 Minutes | 73 | 46.2% |
| 60 to 89 Minutes | 6 | 3.8% |
| 90 or more Minutes | 0 | 0.0% |
Commute Time by Sex in Tampico
The most common commute times in Tampico are 45 to 59 minutes (55 commuters, 53.9%) for males and 40 to 44 minutes (32 commuters, 57.1%) for females.
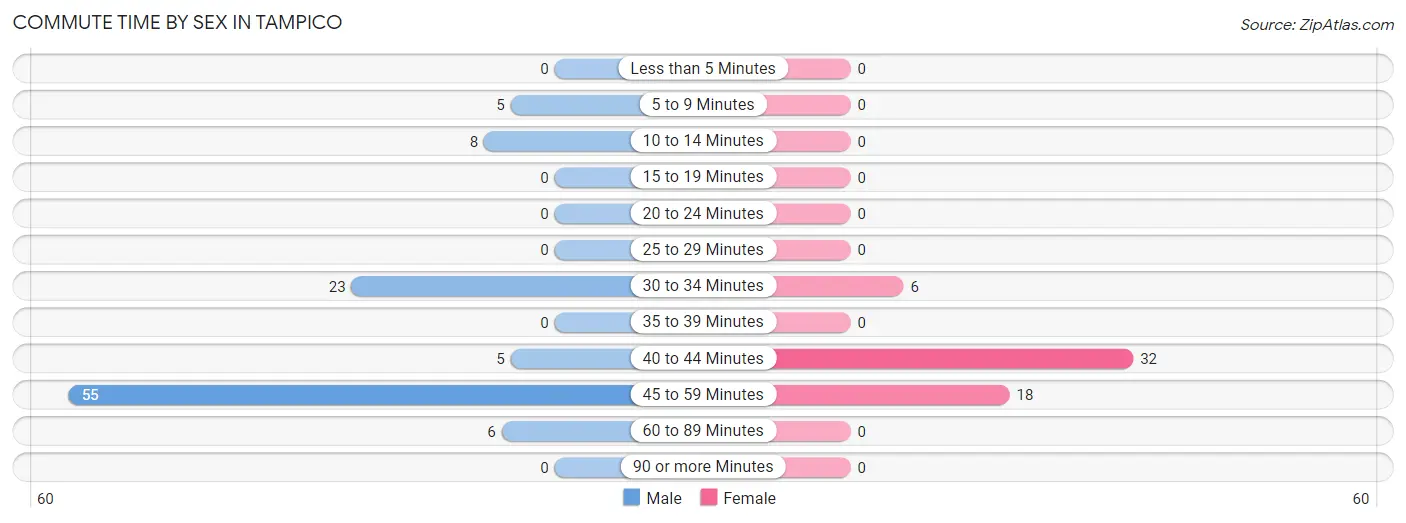
| Commute Time | Male | Female |
| Less than 5 Minutes | 0 (0.0%) | 0 (0.0%) |
| 5 to 9 Minutes | 5 (4.9%) | 0 (0.0%) |
| 10 to 14 Minutes | 8 (7.8%) | 0 (0.0%) |
| 15 to 19 Minutes | 0 (0.0%) | 0 (0.0%) |
| 20 to 24 Minutes | 0 (0.0%) | 0 (0.0%) |
| 25 to 29 Minutes | 0 (0.0%) | 0 (0.0%) |
| 30 to 34 Minutes | 23 (22.6%) | 6 (10.7%) |
| 35 to 39 Minutes | 0 (0.0%) | 0 (0.0%) |
| 40 to 44 Minutes | 5 (4.9%) | 32 (57.1%) |
| 45 to 59 Minutes | 55 (53.9%) | 18 (32.1%) |
| 60 to 89 Minutes | 6 (5.9%) | 0 (0.0%) |
| 90 or more Minutes | 0 (0.0%) | 0 (0.0%) |
Time of Departure to Work by Sex in Tampico
The most frequent times of departure to work in Tampico are 7:00 AM to 7:29 AM (55, 53.9%) for males and 12:00 AM to 4:59 AM (32, 57.1%) for females.
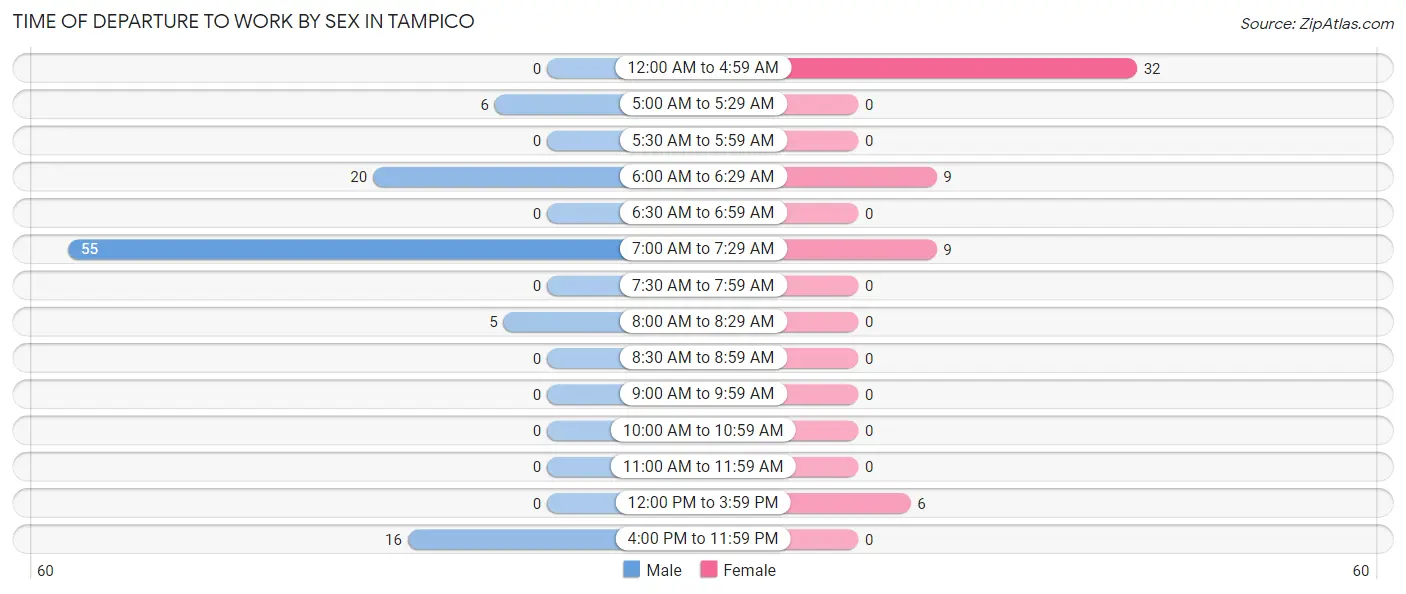
| Time of Departure | Male | Female |
| 12:00 AM to 4:59 AM | 0 (0.0%) | 32 (57.1%) |
| 5:00 AM to 5:29 AM | 6 (5.9%) | 0 (0.0%) |
| 5:30 AM to 5:59 AM | 0 (0.0%) | 0 (0.0%) |
| 6:00 AM to 6:29 AM | 20 (19.6%) | 9 (16.1%) |
| 6:30 AM to 6:59 AM | 0 (0.0%) | 0 (0.0%) |
| 7:00 AM to 7:29 AM | 55 (53.9%) | 9 (16.1%) |
| 7:30 AM to 7:59 AM | 0 (0.0%) | 0 (0.0%) |
| 8:00 AM to 8:29 AM | 5 (4.9%) | 0 (0.0%) |
| 8:30 AM to 8:59 AM | 0 (0.0%) | 0 (0.0%) |
| 9:00 AM to 9:59 AM | 0 (0.0%) | 0 (0.0%) |
| 10:00 AM to 10:59 AM | 0 (0.0%) | 0 (0.0%) |
| 11:00 AM to 11:59 AM | 0 (0.0%) | 0 (0.0%) |
| 12:00 PM to 3:59 PM | 0 (0.0%) | 6 (10.7%) |
| 4:00 PM to 11:59 PM | 16 (15.7%) | 0 (0.0%) |
| Total | 102 (100.0%) | 56 (100.0%) |
Housing Occupancy in Tampico
Occupancy by Ownership in Tampico
Of the total 130 dwellings in Tampico, owner-occupied units account for 125 (96.2%), while renter-occupied units make up 5 (3.8%).
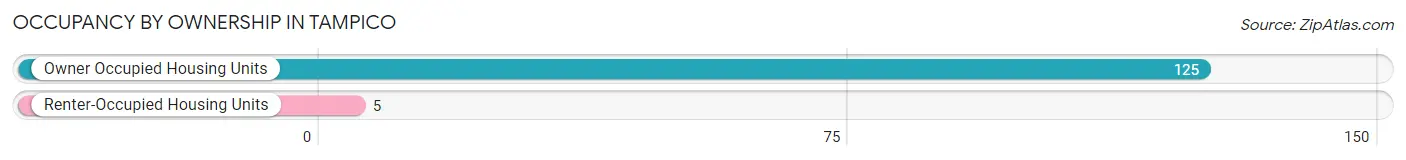
| Occupancy | # Housing Units | % Housing Units |
| Owner Occupied Housing Units | 125 | 96.2% |
| Renter-Occupied Housing Units | 5 | 3.8% |
| Total Occupied Housing Units | 130 | 100.0% |
Occupancy by Household Size in Tampico
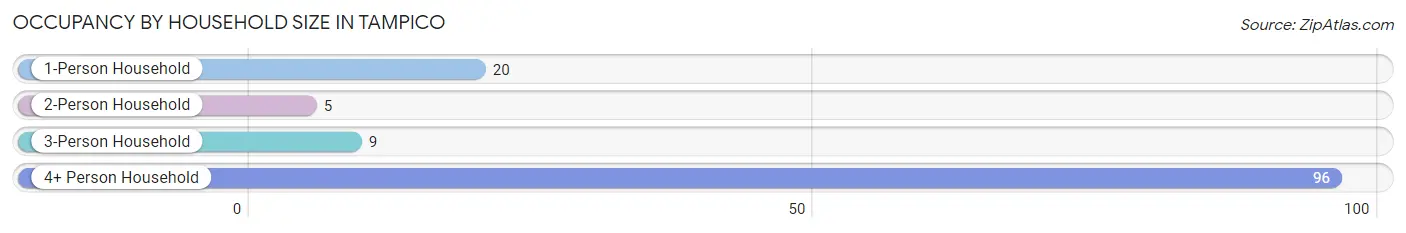
| Household Size | # Housing Units | % Housing Units |
| 1-Person Household | 20 | 15.4% |
| 2-Person Household | 5 | 3.8% |
| 3-Person Household | 9 | 6.9% |
| 4+ Person Household | 96 | 73.9% |
| Total Housing Units | 130 | 100.0% |
Occupancy by Ownership by Household Size in Tampico
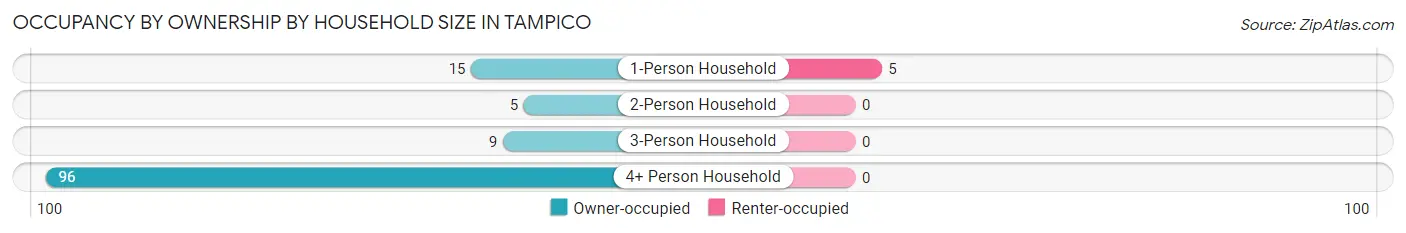
| Household Size | Owner-occupied | Renter-occupied |
| 1-Person Household | 15 (75.0%) | 5 (25.0%) |
| 2-Person Household | 5 (100.0%) | 0 (0.0%) |
| 3-Person Household | 9 (100.0%) | 0 (0.0%) |
| 4+ Person Household | 96 (100.0%) | 0 (0.0%) |
| Total Housing Units | 125 (96.2%) | 5 (3.8%) |
Occupancy by Educational Attainment in Tampico
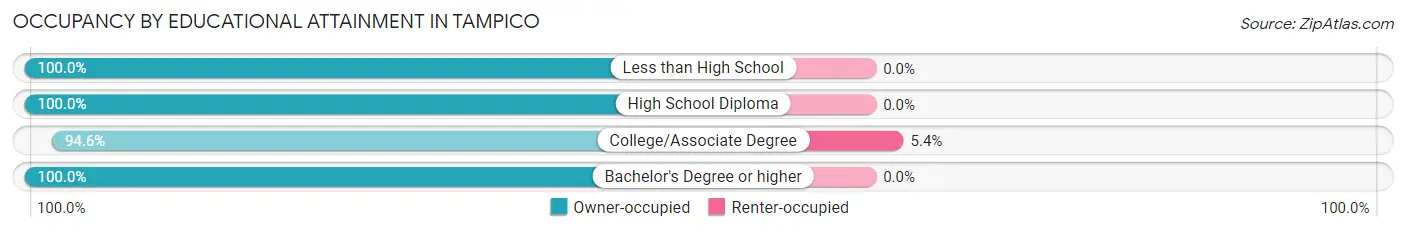
| Household Size | Owner-occupied | Renter-occupied |
| Less than High School | 14 (100.0%) | 0 (0.0%) |
| High School Diploma | 5 (100.0%) | 0 (0.0%) |
| College/Associate Degree | 87 (94.6%) | 5 (5.4%) |
| Bachelor's Degree or higher | 19 (100.0%) | 0 (0.0%) |
Occupancy by Age of Householder in Tampico

| Age Bracket | # Households | % Households |
| Under 35 Years | 71 | 54.6% |
| 35 to 44 Years | 9 | 6.9% |
| 45 to 54 Years | 14 | 10.8% |
| 55 to 64 Years | 26 | 20.0% |
| 65 to 74 Years | 0 | 0.0% |
| 75 to 84 Years | 10 | 7.7% |
| 85 Years and Over | 0 | 0.0% |
| Total | 130 | 100.0% |
Housing Finances in Tampico
Median Income by Occupancy in Tampico
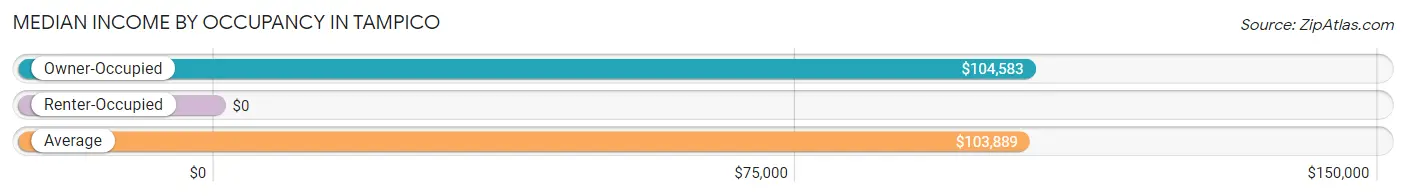
| Occupancy Type | # Households | Median Income |
| Owner-Occupied | 125 (96.2%) | $104,583 |
| Renter-Occupied | 5 (3.8%) | $0 |
| Average | 130 (100.0%) | $103,889 |
Occupancy by Householder Income Bracket in Tampico
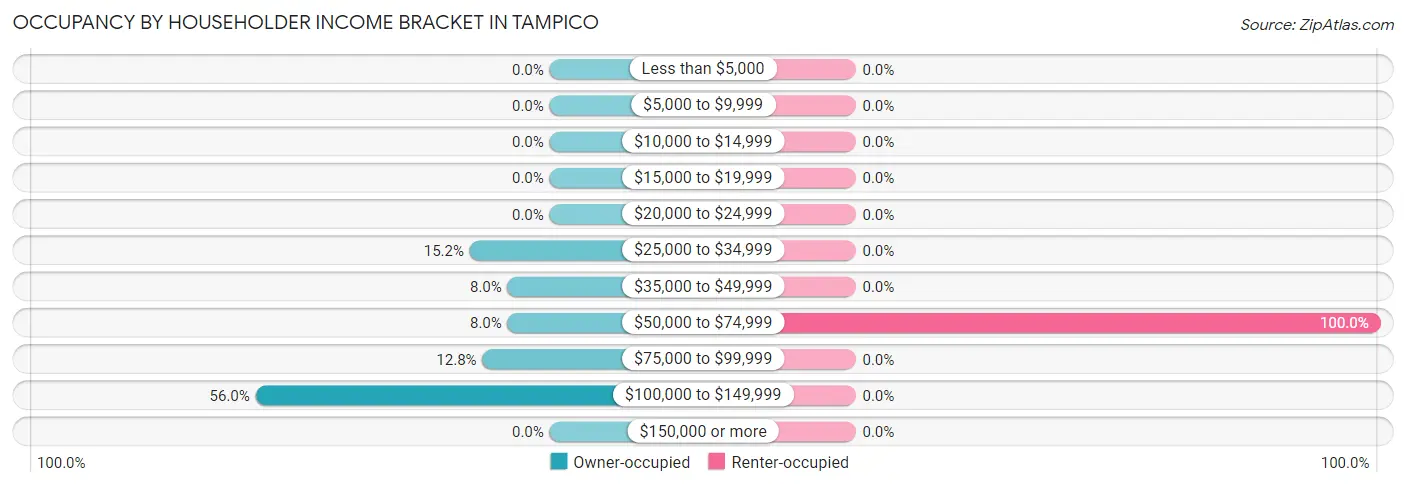
| Income Bracket | Owner-occupied | Renter-occupied |
| Less than $5,000 | 0 (0.0%) | 0 (0.0%) |
| $5,000 to $9,999 | 0 (0.0%) | 0 (0.0%) |
| $10,000 to $14,999 | 0 (0.0%) | 0 (0.0%) |
| $15,000 to $19,999 | 0 (0.0%) | 0 (0.0%) |
| $20,000 to $24,999 | 0 (0.0%) | 0 (0.0%) |
| $25,000 to $34,999 | 19 (15.2%) | 0 (0.0%) |
| $35,000 to $49,999 | 10 (8.0%) | 0 (0.0%) |
| $50,000 to $74,999 | 10 (8.0%) | 5 (100.0%) |
| $75,000 to $99,999 | 16 (12.8%) | 0 (0.0%) |
| $100,000 to $149,999 | 70 (56.0%) | 0 (0.0%) |
| $150,000 or more | 0 (0.0%) | 0 (0.0%) |
| Total | 125 (100.0%) | 5 (100.0%) |
Monthly Housing Cost Tiers in Tampico
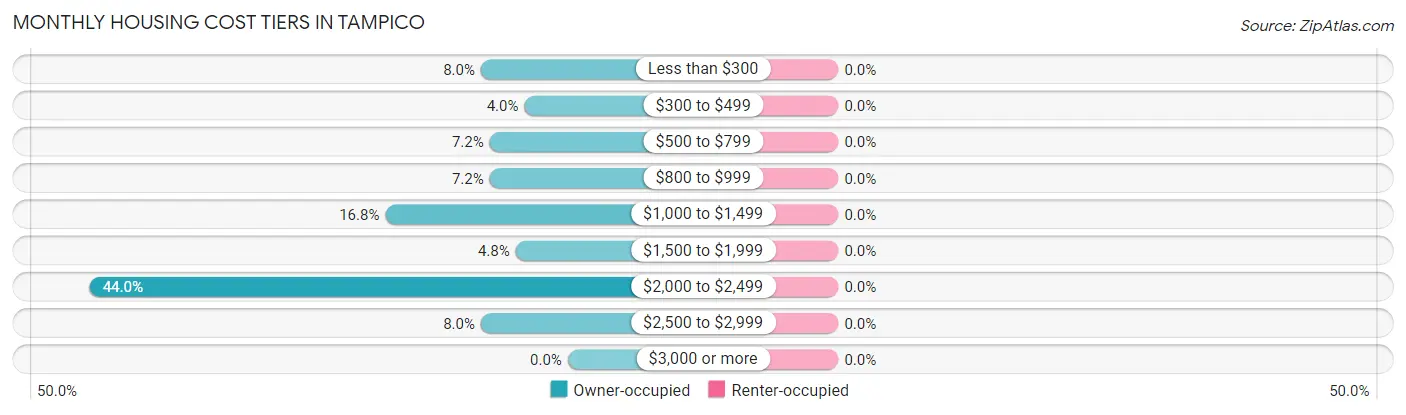
| Monthly Cost | Owner-occupied | Renter-occupied |
| Less than $300 | 10 (8.0%) | 0 (0.0%) |
| $300 to $499 | 5 (4.0%) | 0 (0.0%) |
| $500 to $799 | 9 (7.2%) | 0 (0.0%) |
| $800 to $999 | 9 (7.2%) | 0 (0.0%) |
| $1,000 to $1,499 | 21 (16.8%) | 0 (0.0%) |
| $1,500 to $1,999 | 6 (4.8%) | 0 (0.0%) |
| $2,000 to $2,499 | 55 (44.0%) | 0 (0.0%) |
| $2,500 to $2,999 | 10 (8.0%) | 0 (0.0%) |
| $3,000 or more | 0 (0.0%) | 0 (0.0%) |
| Total | 125 (100.0%) | 5 (100.0%) |
Physical Housing Characteristics in Tampico
Housing Structures in Tampico
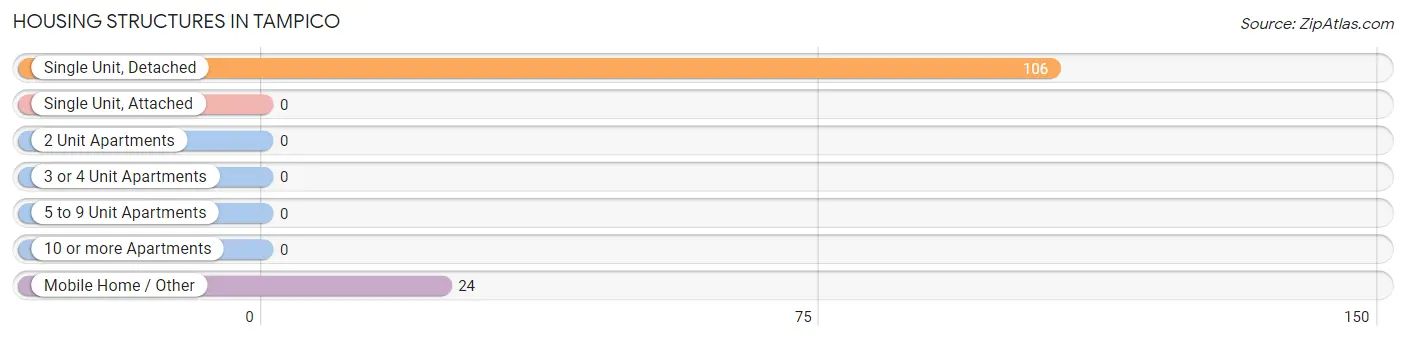
| Structure Type | # Housing Units | % Housing Units |
| Single Unit, Detached | 106 | 81.5% |
| Single Unit, Attached | 0 | 0.0% |
| 2 Unit Apartments | 0 | 0.0% |
| 3 or 4 Unit Apartments | 0 | 0.0% |
| 5 to 9 Unit Apartments | 0 | 0.0% |
| 10 or more Apartments | 0 | 0.0% |
| Mobile Home / Other | 24 | 18.5% |
| Total | 130 | 100.0% |
Housing Structures by Occupancy in Tampico
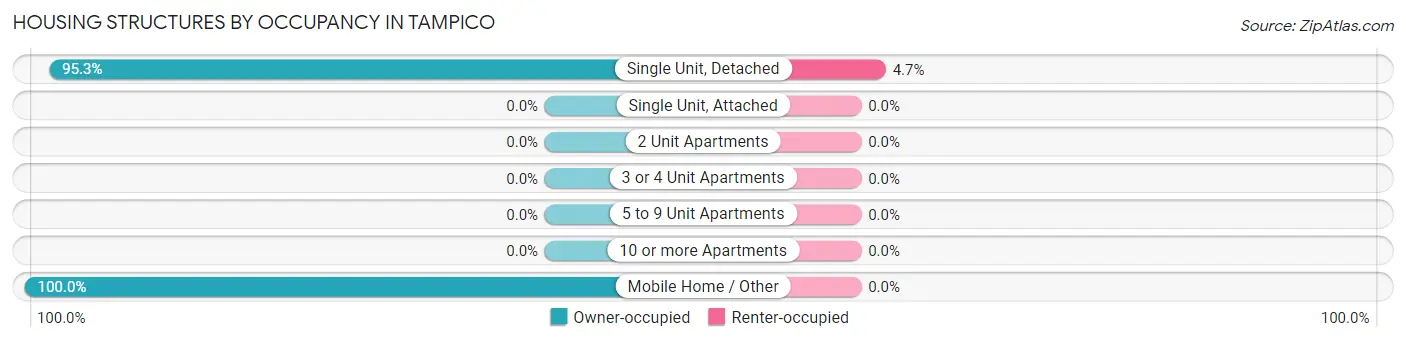
| Structure Type | Owner-occupied | Renter-occupied |
| Single Unit, Detached | 101 (95.3%) | 5 (4.7%) |
| Single Unit, Attached | 0 (0.0%) | 0 (0.0%) |
| 2 Unit Apartments | 0 (0.0%) | 0 (0.0%) |
| 3 or 4 Unit Apartments | 0 (0.0%) | 0 (0.0%) |
| 5 to 9 Unit Apartments | 0 (0.0%) | 0 (0.0%) |
| 10 or more Apartments | 0 (0.0%) | 0 (0.0%) |
| Mobile Home / Other | 24 (100.0%) | 0 (0.0%) |
| Total | 125 (96.2%) | 5 (3.8%) |
Housing Structures by Number of Rooms in Tampico
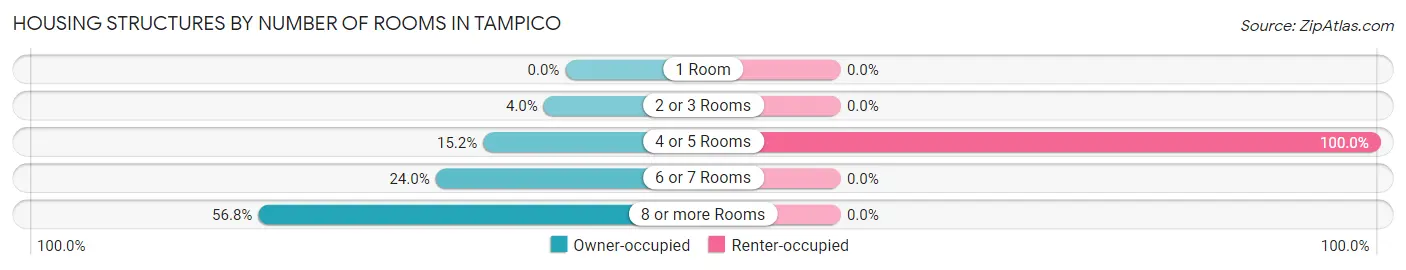
| Number of Rooms | Owner-occupied | Renter-occupied |
| 1 Room | 0 (0.0%) | 0 (0.0%) |
| 2 or 3 Rooms | 5 (4.0%) | 0 (0.0%) |
| 4 or 5 Rooms | 19 (15.2%) | 5 (100.0%) |
| 6 or 7 Rooms | 30 (24.0%) | 0 (0.0%) |
| 8 or more Rooms | 71 (56.8%) | 0 (0.0%) |
| Total | 125 (100.0%) | 5 (100.0%) |
Housing Structure by Heating Type in Tampico
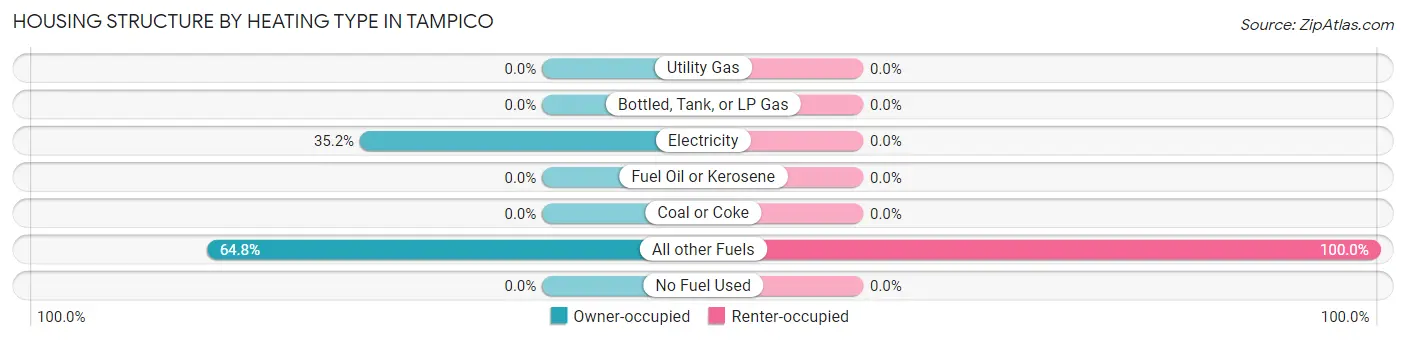
| Heating Type | Owner-occupied | Renter-occupied |
| Utility Gas | 0 (0.0%) | 0 (0.0%) |
| Bottled, Tank, or LP Gas | 0 (0.0%) | 0 (0.0%) |
| Electricity | 44 (35.2%) | 0 (0.0%) |
| Fuel Oil or Kerosene | 0 (0.0%) | 0 (0.0%) |
| Coal or Coke | 0 (0.0%) | 0 (0.0%) |
| All other Fuels | 81 (64.8%) | 5 (100.0%) |
| No Fuel Used | 0 (0.0%) | 0 (0.0%) |
| Total | 125 (100.0%) | 5 (100.0%) |
Household Vehicle Usage in Tampico
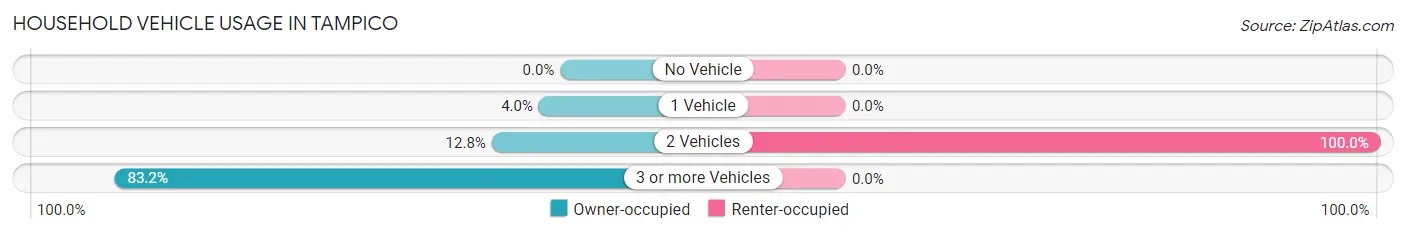
| Vehicles per Household | Owner-occupied | Renter-occupied |
| No Vehicle | 0 (0.0%) | 0 (0.0%) |
| 1 Vehicle | 5 (4.0%) | 0 (0.0%) |
| 2 Vehicles | 16 (12.8%) | 5 (100.0%) |
| 3 or more Vehicles | 104 (83.2%) | 0 (0.0%) |
| Total | 125 (100.0%) | 5 (100.0%) |
Real Estate & Mortgages in Tampico
Real Estate and Mortgage Overview in Tampico
| Characteristic | Without Mortgage | With Mortgage |
| Housing Units | 15 | 110 |
| Median Property Value | - | - |
| Median Household Income | - | - |
| Monthly Housing Costs | - | - |
| Real Estate Taxes | - | - |
Property Value by Mortgage Status in Tampico
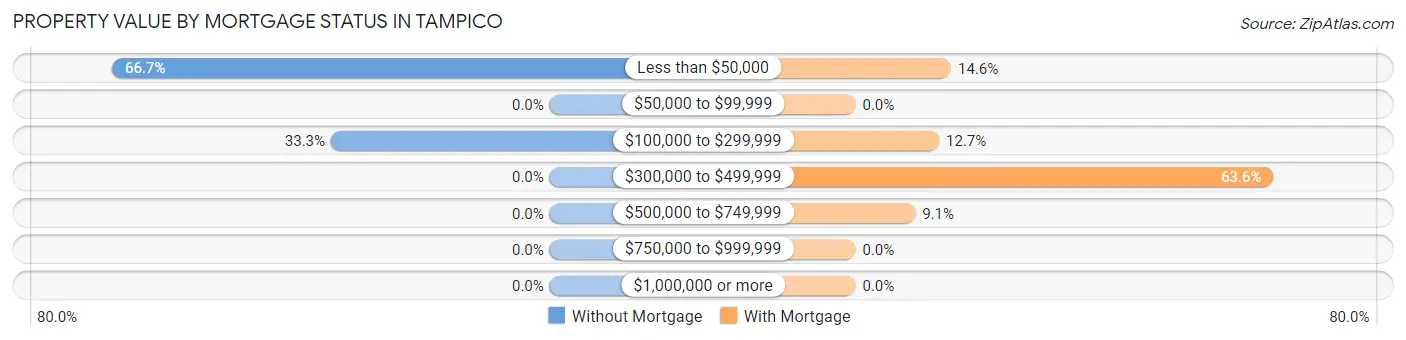
| Property Value | Without Mortgage | With Mortgage |
| Less than $50,000 | 10 (66.7%) | 16 (14.5%) |
| $50,000 to $99,999 | 0 (0.0%) | 0 (0.0%) |
| $100,000 to $299,999 | 5 (33.3%) | 14 (12.7%) |
| $300,000 to $499,999 | 0 (0.0%) | 70 (63.6%) |
| $500,000 to $749,999 | 0 (0.0%) | 10 (9.1%) |
| $750,000 to $999,999 | 0 (0.0%) | 0 (0.0%) |
| $1,000,000 or more | 0 (0.0%) | 0 (0.0%) |
| Total | 15 (100.0%) | 110 (100.0%) |
Household Income by Mortgage Status in Tampico
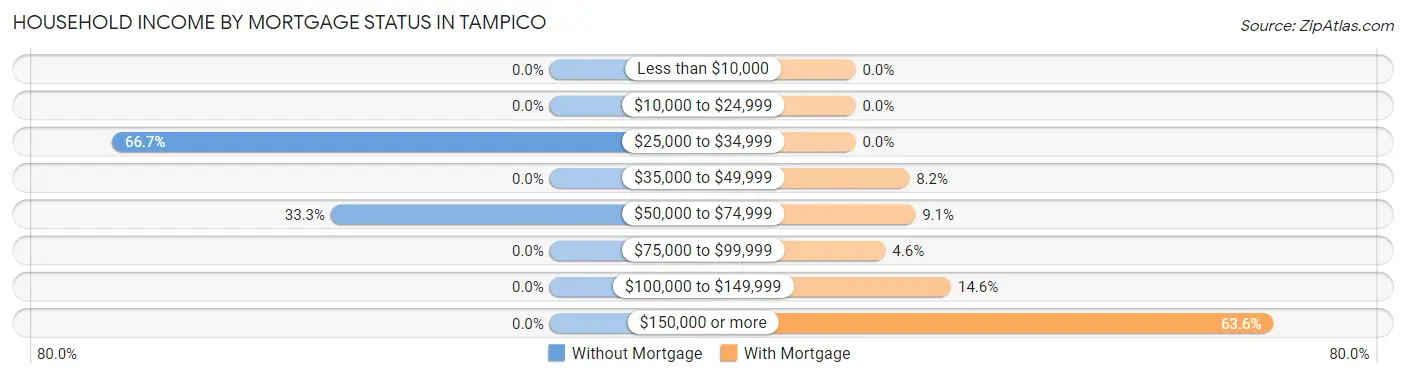
| Household Income | Without Mortgage | With Mortgage |
| Less than $10,000 | 0 (0.0%) | 0 (0.0%) |
| $10,000 to $24,999 | 0 (0.0%) | 0 (0.0%) |
| $25,000 to $34,999 | 10 (66.7%) | 0 (0.0%) |
| $35,000 to $49,999 | 0 (0.0%) | 9 (8.2%) |
| $50,000 to $74,999 | 5 (33.3%) | 10 (9.1%) |
| $75,000 to $99,999 | 0 (0.0%) | 5 (4.5%) |
| $100,000 to $149,999 | 0 (0.0%) | 16 (14.5%) |
| $150,000 or more | 0 (0.0%) | 70 (63.6%) |
| Total | 15 (100.0%) | 110 (100.0%) |
Property Value to Household Income Ratio in Tampico
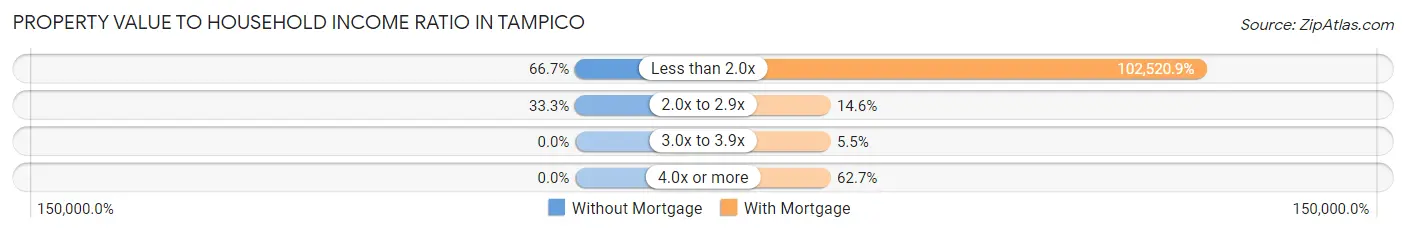
| Value-to-Income Ratio | Without Mortgage | With Mortgage |
| Less than 2.0x | 10 (66.7%) | 112,773 (102,520.9%) |
| 2.0x to 2.9x | 5 (33.3%) | 16 (14.5%) |
| 3.0x to 3.9x | 0 (0.0%) | 6 (5.4%) |
| 4.0x or more | 0 (0.0%) | 69 (62.7%) |
| Total | 15 (100.0%) | 110 (100.0%) |
Real Estate Taxes by Mortgage Status in Tampico
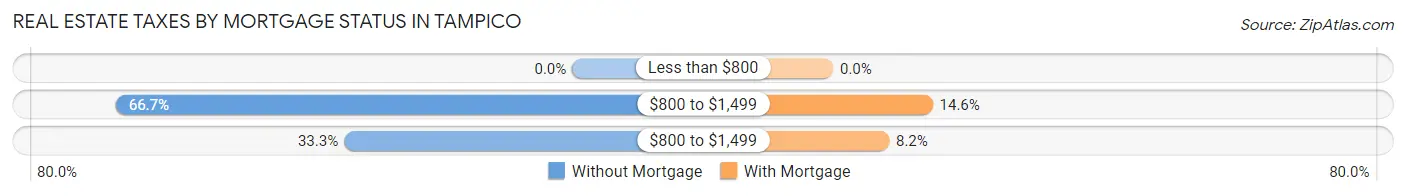
| Property Taxes | Without Mortgage | With Mortgage |
| Less than $800 | 0 (0.0%) | 0 (0.0%) |
| $800 to $1,499 | 10 (66.7%) | 16 (14.5%) |
| $800 to $1,499 | 5 (33.3%) | 9 (8.2%) |
| Total | 15 (100.0%) | 110 (100.0%) |
Health & Disability in Tampico
Health Insurance Coverage by Age in Tampico
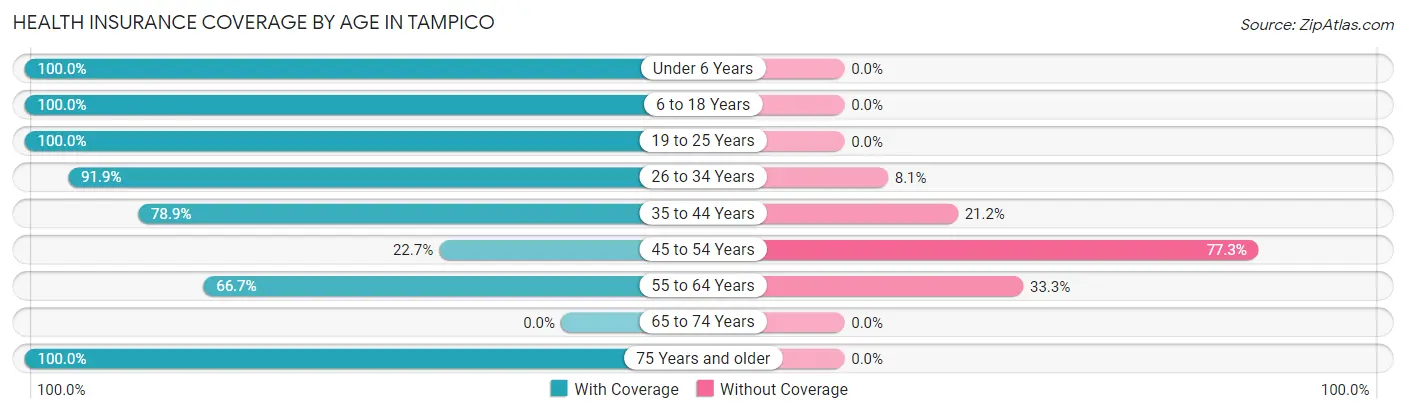
| Age Bracket | With Coverage | Without Coverage |
| Under 6 Years | 25 (100.0%) | 0 (0.0%) |
| 6 to 18 Years | 180 (100.0%) | 0 (0.0%) |
| 19 to 25 Years | 10 (100.0%) | 0 (0.0%) |
| 26 to 34 Years | 102 (91.9%) | 9 (8.1%) |
| 35 to 44 Years | 41 (78.8%) | 11 (21.1%) |
| 45 to 54 Years | 5 (22.7%) | 17 (77.3%) |
| 55 to 64 Years | 30 (66.7%) | 15 (33.3%) |
| 65 to 74 Years | 0 (0.0%) | 0 (0.0%) |
| 75 Years and older | 10 (100.0%) | 0 (0.0%) |
| Total | 403 (88.6%) | 52 (11.4%) |
Health Insurance Coverage by Citizenship Status in Tampico

| Citizenship Status | With Coverage | Without Coverage |
| Native Born | 25 (100.0%) | 0 (0.0%) |
| Foreign Born, Citizen | 180 (100.0%) | 0 (0.0%) |
| Foreign Born, not a Citizen | 10 (100.0%) | 0 (0.0%) |
Health Insurance Coverage by Household Income in Tampico
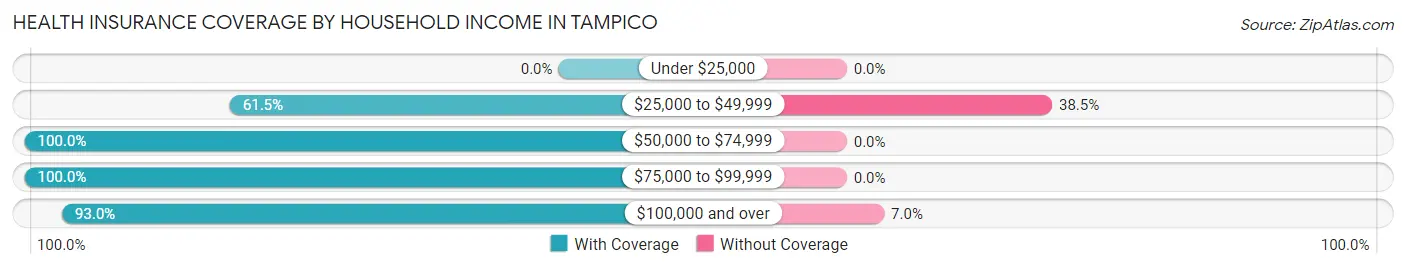
| Household Income | With Coverage | Without Coverage |
| Under $25,000 | 0 (0.0%) | 0 (0.0%) |
| $25,000 to $49,999 | 56 (61.5%) | 35 (38.5%) |
| $50,000 to $74,999 | 19 (100.0%) | 0 (0.0%) |
| $75,000 to $99,999 | 102 (100.0%) | 0 (0.0%) |
| $100,000 and over | 226 (93.0%) | 17 (7.0%) |
Public vs Private Health Insurance Coverage by Age in Tampico
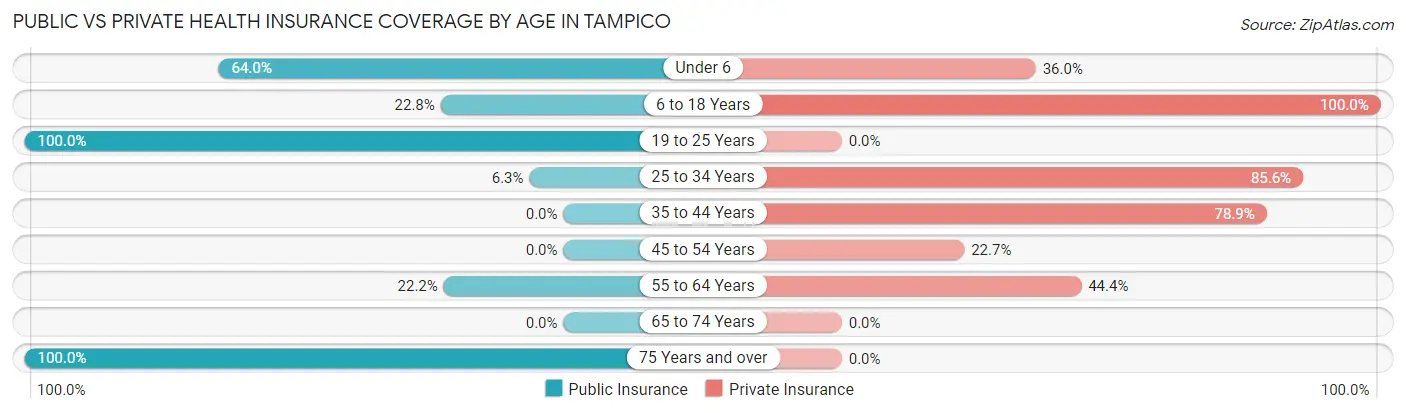
| Age Bracket | Public Insurance | Private Insurance |
| Under 6 | 16 (64.0%) | 9 (36.0%) |
| 6 to 18 Years | 41 (22.8%) | 180 (100.0%) |
| 19 to 25 Years | 10 (100.0%) | 0 (0.0%) |
| 25 to 34 Years | 7 (6.3%) | 95 (85.6%) |
| 35 to 44 Years | 0 (0.0%) | 41 (78.8%) |
| 45 to 54 Years | 0 (0.0%) | 5 (22.7%) |
| 55 to 64 Years | 10 (22.2%) | 20 (44.4%) |
| 65 to 74 Years | 0 (0.0%) | 0 (0.0%) |
| 75 Years and over | 10 (100.0%) | 0 (0.0%) |
| Total | 94 (20.7%) | 350 (76.9%) |
Disability Status by Sex by Age in Tampico
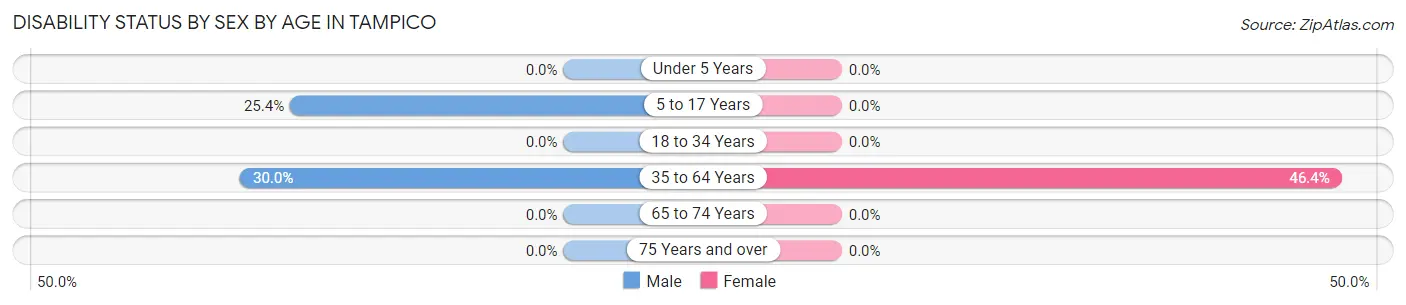
| Age Bracket | Male | Female |
| Under 5 Years | 0 (0.0%) | 0 (0.0%) |
| 5 to 17 Years | 17 (25.4%) | 0 (0.0%) |
| 18 to 34 Years | 0 (0.0%) | 0 (0.0%) |
| 35 to 64 Years | 15 (30.0%) | 32 (46.4%) |
| 65 to 74 Years | 0 (0.0%) | 0 (0.0%) |
| 75 Years and over | 0 (0.0%) | 0 (0.0%) |
Disability Class by Sex by Age in Tampico
Disability Class: Hearing Difficulty
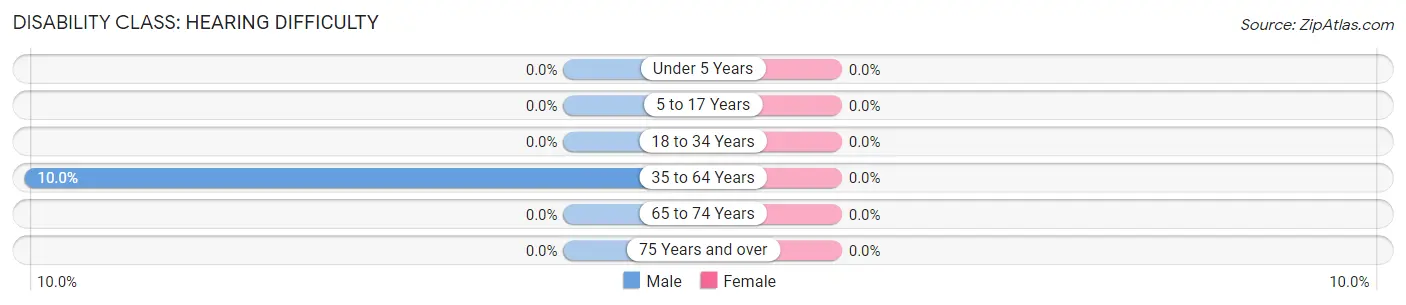
| Age Bracket | Male | Female |
| Under 5 Years | 0 (0.0%) | 0 (0.0%) |
| 5 to 17 Years | 0 (0.0%) | 0 (0.0%) |
| 18 to 34 Years | 0 (0.0%) | 0 (0.0%) |
| 35 to 64 Years | 5 (10.0%) | 0 (0.0%) |
| 65 to 74 Years | 0 (0.0%) | 0 (0.0%) |
| 75 Years and over | 0 (0.0%) | 0 (0.0%) |
Disability Class: Vision Difficulty
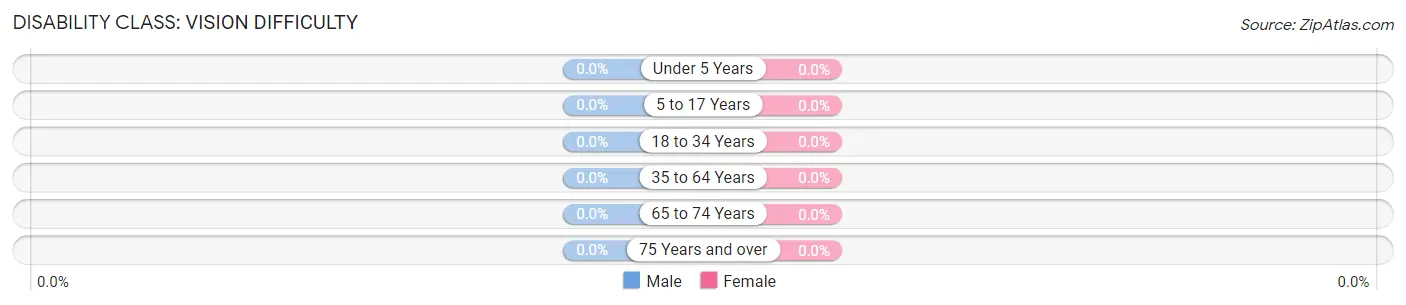
| Age Bracket | Male | Female |
| Under 5 Years | 0 (0.0%) | 0 (0.0%) |
| 5 to 17 Years | 0 (0.0%) | 0 (0.0%) |
| 18 to 34 Years | 0 (0.0%) | 0 (0.0%) |
| 35 to 64 Years | 0 (0.0%) | 0 (0.0%) |
| 65 to 74 Years | 0 (0.0%) | 0 (0.0%) |
| 75 Years and over | 0 (0.0%) | 0 (0.0%) |
Disability Class: Cognitive Difficulty
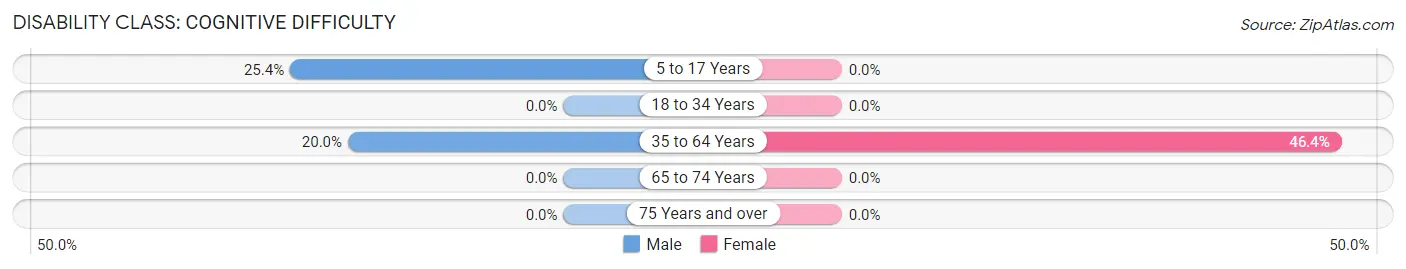
| Age Bracket | Male | Female |
| 5 to 17 Years | 17 (25.4%) | 0 (0.0%) |
| 18 to 34 Years | 0 (0.0%) | 0 (0.0%) |
| 35 to 64 Years | 10 (20.0%) | 32 (46.4%) |
| 65 to 74 Years | 0 (0.0%) | 0 (0.0%) |
| 75 Years and over | 0 (0.0%) | 0 (0.0%) |
Disability Class: Ambulatory Difficulty
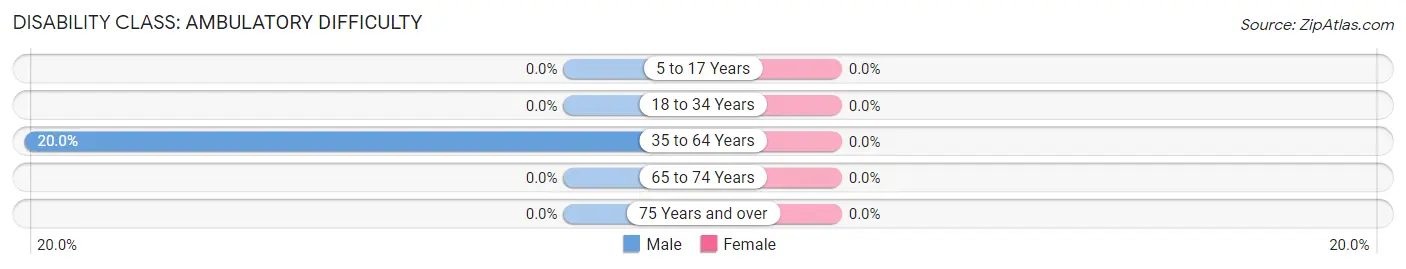
| Age Bracket | Male | Female |
| 5 to 17 Years | 0 (0.0%) | 0 (0.0%) |
| 18 to 34 Years | 0 (0.0%) | 0 (0.0%) |
| 35 to 64 Years | 10 (20.0%) | 0 (0.0%) |
| 65 to 74 Years | 0 (0.0%) | 0 (0.0%) |
| 75 Years and over | 0 (0.0%) | 0 (0.0%) |
Disability Class: Self-Care Difficulty
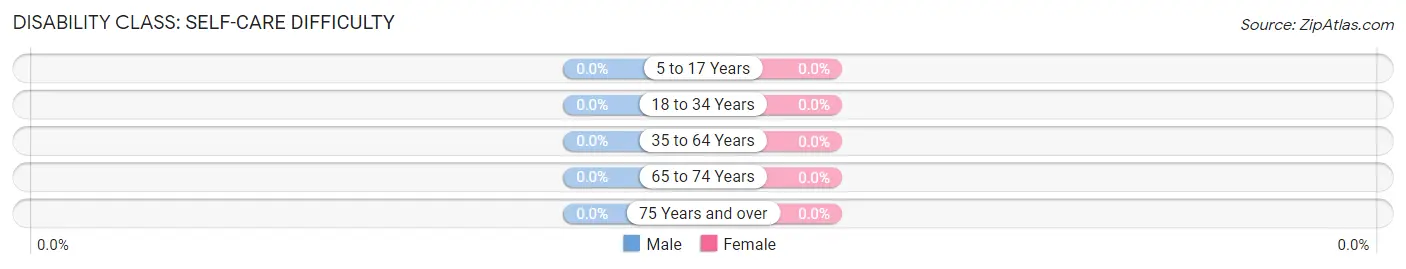
| Age Bracket | Male | Female |
| 5 to 17 Years | 0 (0.0%) | 0 (0.0%) |
| 18 to 34 Years | 0 (0.0%) | 0 (0.0%) |
| 35 to 64 Years | 0 (0.0%) | 0 (0.0%) |
| 65 to 74 Years | 0 (0.0%) | 0 (0.0%) |
| 75 Years and over | 0 (0.0%) | 0 (0.0%) |
Technology Access in Tampico
Computing Device Access in Tampico
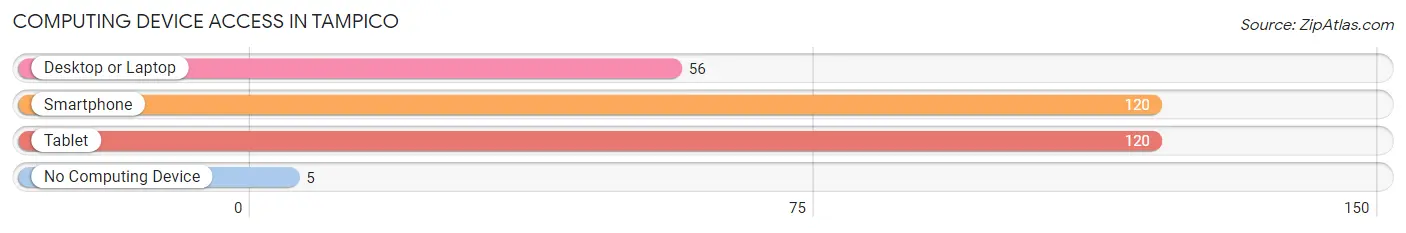
| Device Type | # Households | % Households |
| Desktop or Laptop | 56 | 43.1% |
| Smartphone | 120 | 92.3% |
| Tablet | 120 | 92.3% |
| No Computing Device | 5 | 3.8% |
| Total | 130 | 100.0% |
Internet Access in Tampico
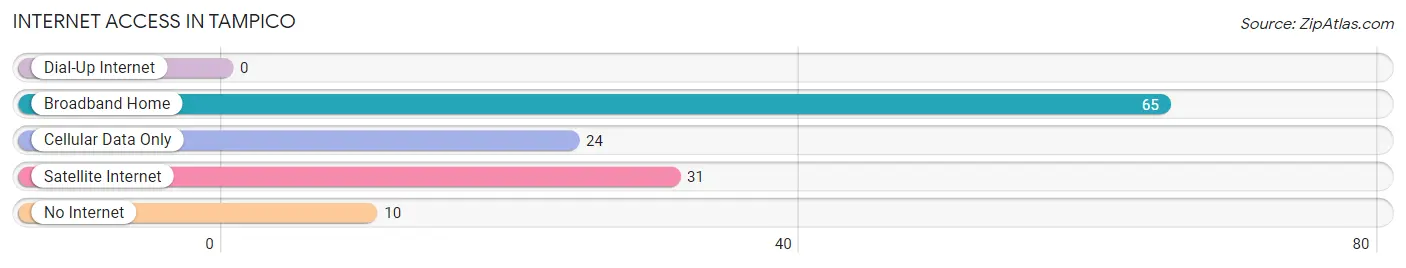
| Internet Type | # Households | % Households |
| Dial-Up Internet | 0 | 0.0% |
| Broadband Home | 65 | 50.0% |
| Cellular Data Only | 24 | 18.5% |
| Satellite Internet | 31 | 23.8% |
| No Internet | 10 | 7.7% |
| Total | 130 | 100.0% |
Tampico Summary
Tampico is a small unincorporated community located in Whatcom County, Washington, United States. It is situated on the banks of the Nooksack River, approximately 10 miles (16 km) east of Bellingham. The population of Tampico was estimated to be around 200 in 2020.
History
Tampico was first settled in the late 1800s by a group of settlers from the Midwest. The settlers were attracted to the area by the abundance of timber and the potential for farming. The first post office was established in 1891 and the town was officially incorporated in 1895.
The town was named after the Mexican city of Tampico, which was the birthplace of one of the settlers. The town grew slowly but steadily over the years, and by the early 1900s it had become a thriving logging and farming community.
Geography
Tampico is located in the foothills of the Cascade Mountains, approximately 10 miles (16 km) east of Bellingham. The town is situated on the banks of the Nooksack River, which provides a scenic backdrop for the town. The surrounding area is mostly rural, with rolling hills and forests.
The climate in Tampico is mild and temperate, with warm summers and cool winters. The average annual temperature is around 50°F (10°C). The average annual precipitation is around 40 inches (101 cm).
Economy
Tampico’s economy is largely based on agriculture and forestry. The town is home to several small farms, which produce a variety of crops, including apples, cherries, and vegetables. The surrounding forests provide timber for the local lumber industry.
In addition to agriculture and forestry, Tampico is home to several small businesses, including a grocery store, a hardware store, and a restaurant. The town also has a post office and a library.
Demographics
As of the 2010 census, the population of Tampico was estimated to be around 200. The racial makeup of the town was 97.5% White, 0.5% Native American, 0.5% Asian, and 1.5% from other races. The median household income was $45,000, and the median age was 44.
Tampico is a small, close-knit community with a strong sense of community spirit. The town is home to several churches, a volunteer fire department, and a community center. The town also hosts several annual events, including a Fourth of July parade and a Christmas tree lighting ceremony.
Conclusion
Tampico is a small, rural community located in Whatcom County, Washington. It is situated on the banks of the Nooksack River, and is home to around 200 people. The town’s economy is largely based on agriculture and forestry, and the town is home to several small businesses. Tampico is a close-knit community with a strong sense of community spirit, and hosts several annual events.
Common Questions
What is Per Capita Income in Tampico?
Per Capita income in Tampico is $24,190.
What is the Median Family Income in Tampico?
Median Family Income in Tampico is $108,750.
What is the Median Household income in Tampico?
Median Household Income in Tampico is $103,889.
What is Income or Wage Gap in Tampico?
Income or Wage Gap in Tampico is 76.9%.
Women in Tampico earn 23.1 cents for every dollar earned by a man.
What is Inequality or Gini Index in Tampico?
Inequality or Gini Index in Tampico is 0.21.
What is the Total Population of Tampico?
Total Population of Tampico is 455.
What is the Total Male Population of Tampico?
Total Male Population of Tampico is 213.
What is the Total Female Population of Tampico?
Total Female Population of Tampico is 242.
What is the Ratio of Males per 100 Females in Tampico?
There are 88.02 Males per 100 Females in Tampico.
What is the Ratio of Females per 100 Males in Tampico?
There are 113.62 Females per 100 Males in Tampico.
What is the Median Population Age in Tampico?
Median Population Age in Tampico is 29.6 Years.
What is the Average Family Size in Tampico
Average Family Size in Tampico is 3.7 People.
What is the Average Household Size in Tampico
Average Household Size in Tampico is 3.5 People.
How Large is the Labor Force in Tampico?
There are 185 People in the Labor Forcein in Tampico.
What is the Percentage of People in the Labor Force in Tampico?
74.0% of People are in the Labor Force in Tampico.
What is the Unemployment Rate in Tampico?
Unemployment Rate in Tampico is 14.6%.