Cities with the Highest Percentage of Central American Indian Population in Washington
RELATED REPORTS & OPTIONS
Central American Indian
Washington
Compare Cities
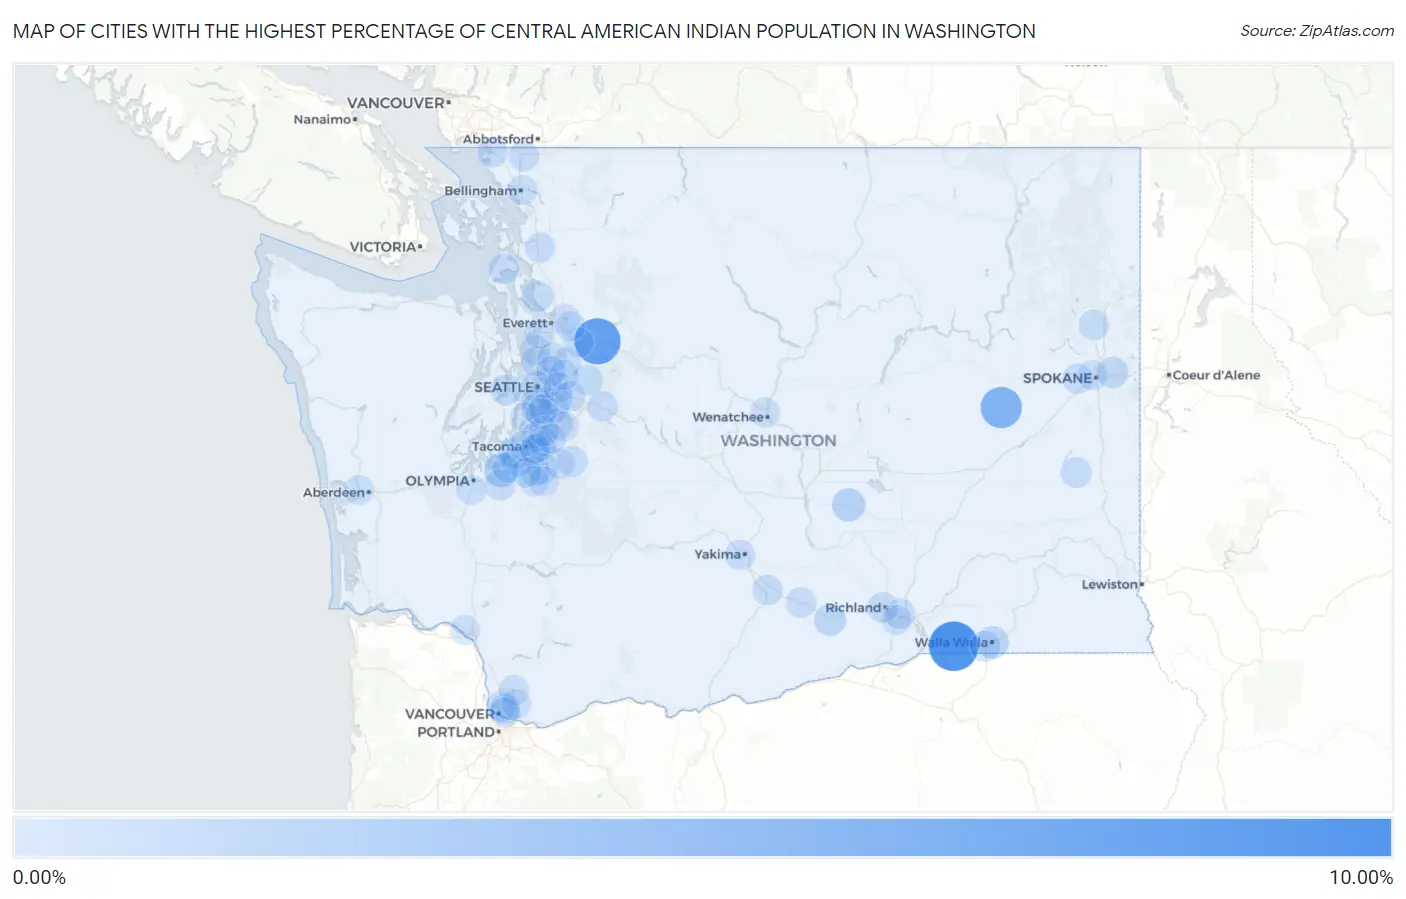
Map of Cities with the Highest Percentage of Central American Indian Population in Washington
0.00%
10.00%
Cities with the Highest Percentage of Central American Indian Population in Washington
| City | Central American Indian | vs State | vs National | |
| 1. | Touchet | 9.48% | 0.079%(+9.41)#1 | 0.11%(+9.37)#25 |
| 2. | Sultan | 7.74% | 0.079%(+7.66)#2 | 0.11%(+7.63)#30 |
| 3. | Harrington | 5.33% | 0.079%(+5.25)#3 | 0.11%(+5.22)#46 |
| 4. | Dupont | 1.80% | 0.079%(+1.72)#4 | 0.11%(+1.69)#190 |
| 5. | Royal City | 1.46% | 0.079%(+1.38)#5 | 0.11%(+1.34)#261 |
| 6. | Walla Walla | 1.17% | 0.079%(+1.09)#6 | 0.11%(+1.05)#335 |
| 7. | Prosser | 0.80% | 0.079%(+0.719)#7 | 0.11%(+0.685)#492 |
| 8. | Enetai | 0.59% | 0.079%(+0.509)#8 | 0.11%(+0.476)#646 |
| 9. | Millwood | 0.57% | 0.079%(+0.490)#9 | 0.11%(+0.457)#660 |
| 10. | University Place | 0.54% | 0.079%(+0.465)#10 | 0.11%(+0.432)#684 |
| 11. | Kayak Point | 0.54% | 0.079%(+0.462)#11 | 0.11%(+0.429)#691 |
| 12. | Carnation | 0.44% | 0.079%(+0.358)#12 | 0.11%(+0.324)#847 |
| 13. | Nisqually Indian Community | 0.34% | 0.079%(+0.258)#13 | 0.11%(+0.224)#1,065 |
| 14. | Buckley | 0.33% | 0.079%(+0.248)#14 | 0.11%(+0.214)#1,090 |
| 15. | St John | 0.33% | 0.079%(+0.247)#15 | 0.11%(+0.214)#1,091 |
| 16. | Richland | 0.30% | 0.079%(+0.223)#16 | 0.11%(+0.189)#1,154 |
| 17. | Waller | 0.30% | 0.079%(+0.221)#17 | 0.11%(+0.187)#1,161 |
| 18. | Newcastle | 0.27% | 0.079%(+0.191)#18 | 0.11%(+0.158)#1,238 |
| 19. | Deer Park | 0.27% | 0.079%(+0.188)#19 | 0.11%(+0.155)#1,248 |
| 20. | College Place | 0.27% | 0.079%(+0.186)#20 | 0.11%(+0.152)#1,255 |
| 21. | Toppenish | 0.25% | 0.079%(+0.170)#21 | 0.11%(+0.136)#1,304 |
| 22. | Lynden | 0.24% | 0.079%(+0.162)#22 | 0.11%(+0.129)#1,340 |
| 23. | Renton | 0.23% | 0.079%(+0.154)#23 | 0.11%(+0.120)#1,378 |
| 24. | White Center | 0.23% | 0.079%(+0.153)#24 | 0.11%(+0.120)#1,382 |
| 25. | Hazel Dell | 0.21% | 0.079%(+0.127)#25 | 0.11%(+0.094)#1,501 |
| 26. | Yakima | 0.18% | 0.079%(+0.104)#26 | 0.11%(+0.071)#1,616 |
| 27. | Sunnyside | 0.18% | 0.079%(+0.104)#27 | 0.11%(+0.071)#1,619 |
| 28. | Airway Heights | 0.18% | 0.079%(+0.100)#28 | 0.11%(+0.067)#1,635 |
| 29. | Lakewood | 0.17% | 0.079%(+0.093)#29 | 0.11%(+0.060)#1,664 |
| 30. | Cottage Lake | 0.17% | 0.079%(+0.093)#30 | 0.11%(+0.059)#1,666 |
| 31. | Medina | 0.17% | 0.079%(+0.092)#31 | 0.11%(+0.058)#1,674 |
| 32. | Mount Vernon | 0.17% | 0.079%(+0.089)#32 | 0.11%(+0.055)#1,694 |
| 33. | North Fort Lewis | 0.17% | 0.079%(+0.087)#33 | 0.11%(+0.053)#1,715 |
| 34. | North Bend | 0.16% | 0.079%(+0.079)#34 | 0.11%(+0.046)#1,743 |
| 35. | Vashon | 0.16% | 0.079%(+0.076)#35 | 0.11%(+0.042)#1,765 |
| 36. | Kent | 0.15% | 0.079%(+0.074)#36 | 0.11%(+0.041)#1,776 |
| 37. | Edmonds | 0.15% | 0.079%(+0.073)#37 | 0.11%(+0.039)#1,786 |
| 38. | South Hill | 0.14% | 0.079%(+0.059)#38 | 0.11%(+0.026)#1,861 |
| 39. | Oak Harbor | 0.13% | 0.079%(+0.051)#39 | 0.11%(+0.018)#1,915 |
| 40. | Seattle | 0.12% | 0.079%(+0.044)#40 | 0.11%(+0.011)#1,961 |
| 41. | Federal Way | 0.12% | 0.079%(+0.044)#41 | 0.11%(+0.010)#1,965 |
| 42. | Tacoma | 0.12% | 0.079%(+0.043)#42 | 0.11%(+0.010)#1,969 |
| 43. | Blaine | 0.12% | 0.079%(+0.040)#43 | 0.11%(+0.006)#1,991 |
| 44. | Fairwood Cdp King County | 0.12% | 0.079%(+0.039)#44 | 0.11%(+0.005)#2,001 |
| 45. | Burien | 0.11% | 0.079%(+0.029)#45 | 0.11%(-0.004)#2,082 |
| 46. | Minnehaha | 0.10% | 0.079%(+0.024)#46 | 0.11%(-0.009)#2,129 |
| 47. | Seatac | 0.10% | 0.079%(+0.021)#47 | 0.11%(-0.013)#2,151 |
| 48. | Bellevue | 0.096% | 0.079%(+0.017)#48 | 0.11%(-0.017)#2,186 |
| 49. | Pasco | 0.094% | 0.079%(+0.015)#49 | 0.11%(-0.019)#2,198 |
| 50. | Issaquah | 0.091% | 0.079%(+0.012)#50 | 0.11%(-0.022)#2,227 |
| 51. | Shoreline | 0.087% | 0.079%(+0.007)#51 | 0.11%(-0.026)#2,264 |
| 52. | Wenatchee | 0.085% | 0.079%(+0.005)#52 | 0.11%(-0.028)#2,284 |
| 53. | Covington | 0.082% | 0.079%(+0.002)#53 | 0.11%(-0.031)#2,311 |
| 54. | Prairie Ridge | 0.080% | 0.079%(+0.001)#54 | 0.11%(-0.033)#2,327 |
| 55. | Bothell | 0.075% | 0.079%(-0.004)#55 | 0.11%(-0.038)#2,369 |
| 56. | Frederickson | 0.073% | 0.079%(-0.007)#56 | 0.11%(-0.040)#2,397 |
| 57. | Lakeland South | 0.071% | 0.079%(-0.008)#57 | 0.11%(-0.042)#2,411 |
| 58. | Elk Plain | 0.070% | 0.079%(-0.009)#58 | 0.11%(-0.043)#2,422 |
| 59. | Milton | 0.070% | 0.079%(-0.009)#59 | 0.11%(-0.043)#2,423 |
| 60. | Spokane | 0.067% | 0.079%(-0.012)#60 | 0.11%(-0.046)#2,457 |
| 61. | Monroe | 0.066% | 0.079%(-0.013)#61 | 0.11%(-0.047)#2,464 |
| 62. | Fife | 0.064% | 0.079%(-0.015)#62 | 0.11%(-0.049)#2,482 |
| 63. | Longview | 0.064% | 0.079%(-0.016)#63 | 0.11%(-0.049)#2,489 |
| 64. | Lake Stevens | 0.062% | 0.079%(-0.018)#64 | 0.11%(-0.051)#2,510 |
| 65. | Kennewick | 0.058% | 0.079%(-0.021)#65 | 0.11%(-0.055)#2,547 |
| 66. | Graham | 0.052% | 0.079%(-0.028)#66 | 0.11%(-0.061)#2,607 |
| 67. | Battle Ground | 0.048% | 0.079%(-0.032)#67 | 0.11%(-0.065)#2,649 |
| 68. | Mukilteo | 0.047% | 0.079%(-0.033)#68 | 0.11%(-0.066)#2,654 |
| 69. | Vancouver | 0.046% | 0.079%(-0.033)#69 | 0.11%(-0.067)#2,661 |
| 70. | Redmond | 0.046% | 0.079%(-0.033)#70 | 0.11%(-0.067)#2,662 |
| 71. | Hoquiam | 0.046% | 0.079%(-0.034)#71 | 0.11%(-0.067)#2,668 |
| 72. | Spanaway | 0.041% | 0.079%(-0.038)#72 | 0.11%(-0.072)#2,709 |
| 73. | Lakeland North | 0.040% | 0.079%(-0.039)#73 | 0.11%(-0.073)#2,721 |
| 74. | Tumwater | 0.039% | 0.079%(-0.040)#74 | 0.11%(-0.074)#2,736 |
| 75. | Orchards | 0.038% | 0.079%(-0.042)#75 | 0.11%(-0.075)#2,743 |
| 76. | Auburn | 0.037% | 0.079%(-0.042)#76 | 0.11%(-0.076)#2,744 |
| 77. | Tukwila | 0.032% | 0.079%(-0.047)#77 | 0.11%(-0.081)#2,787 |
| 78. | Everett | 0.027% | 0.079%(-0.052)#78 | 0.11%(-0.086)#2,841 |
| 79. | Bellingham | 0.020% | 0.079%(-0.060)#79 | 0.11%(-0.093)#2,922 |
| 80. | Kirkland | 0.0065% | 0.079%(-0.073)#80 | 0.11%(-0.106)#3,037 |
Common Questions
What are the Top 10 Cities with the Highest Percentage of Central American Indian Population in Washington?
Top 10 Cities with the Highest Percentage of Central American Indian Population in Washington are:
#1
9.48%
#2
7.74%
#3
5.33%
#4
1.80%
#5
1.46%
#6
1.17%
#7
0.80%
#8
0.59%
#9
0.57%
#10
0.54%
What city has the Highest Percentage of Central American Indian Population in Washington?
Touchet has the Highest Percentage of Central American Indian Population in Washington with 9.48%.
What is the Percentage of Central American Indian Population in the State of Washington?
Percentage of Central American Indian Population in Washington is 0.079%.
What is the Percentage of Central American Indian Population in the United States?
Percentage of Central American Indian Population in the United States is 0.11%.