Willapa, WA Map & Demographics
Willapa Map
Willapa Overview
$25,993
PER CAPITA INCOME
$50,781
AVG FAMILY INCOME
$50,000
AVG HOUSEHOLD INCOME
0.32
INEQUALITY / GINI INDEX
178
TOTAL POPULATION
93
MALE POPULATION
85
FEMALE POPULATION
109.41
MALES / 100 FEMALES
91.40
FEMALES / 100 MALES
32.7
MEDIAN AGE
3.2
AVG FAMILY SIZE
3.1
AVG HOUSEHOLD SIZE
71
LABOR FORCE [ PEOPLE ]
55.5%
PERCENT IN LABOR FORCE
Income in Willapa
Income Overview in Willapa
Per Capita Income in Willapa is $25,993, while median incomes of families and households are $50,781 and $50,000 respectively.
| Characteristic | Number | Measure |
| Per Capita Income | 178 | $25,993 |
| Median Family Income | 53 | $50,781 |
| Mean Family Income | 53 | $75,668 |
| Median Household Income | 58 | $50,000 |
| Mean Household Income | 58 | $73,410 |
| Income Deficit | 53 | $0 |
| Wage / Income Gap (%) | 178 | 0.00% |
| Wage / Income Gap ($) | 178 | 100.00¢ per $1 |
| Gini / Inequality Index | 178 | 0.32 |
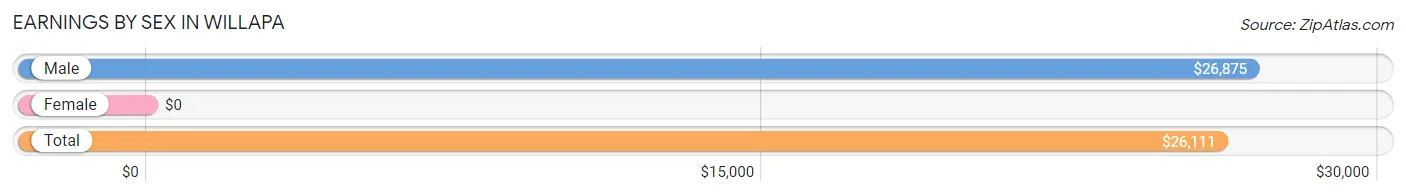
Earnings by Sex in Willapa
| Sex | Number | Average Earnings |
| Male | 45 (54.9%) | $26,875 |
| Female | 37 (45.1%) | $0 |
| Total | 82 (100.0%) | $26,111 |
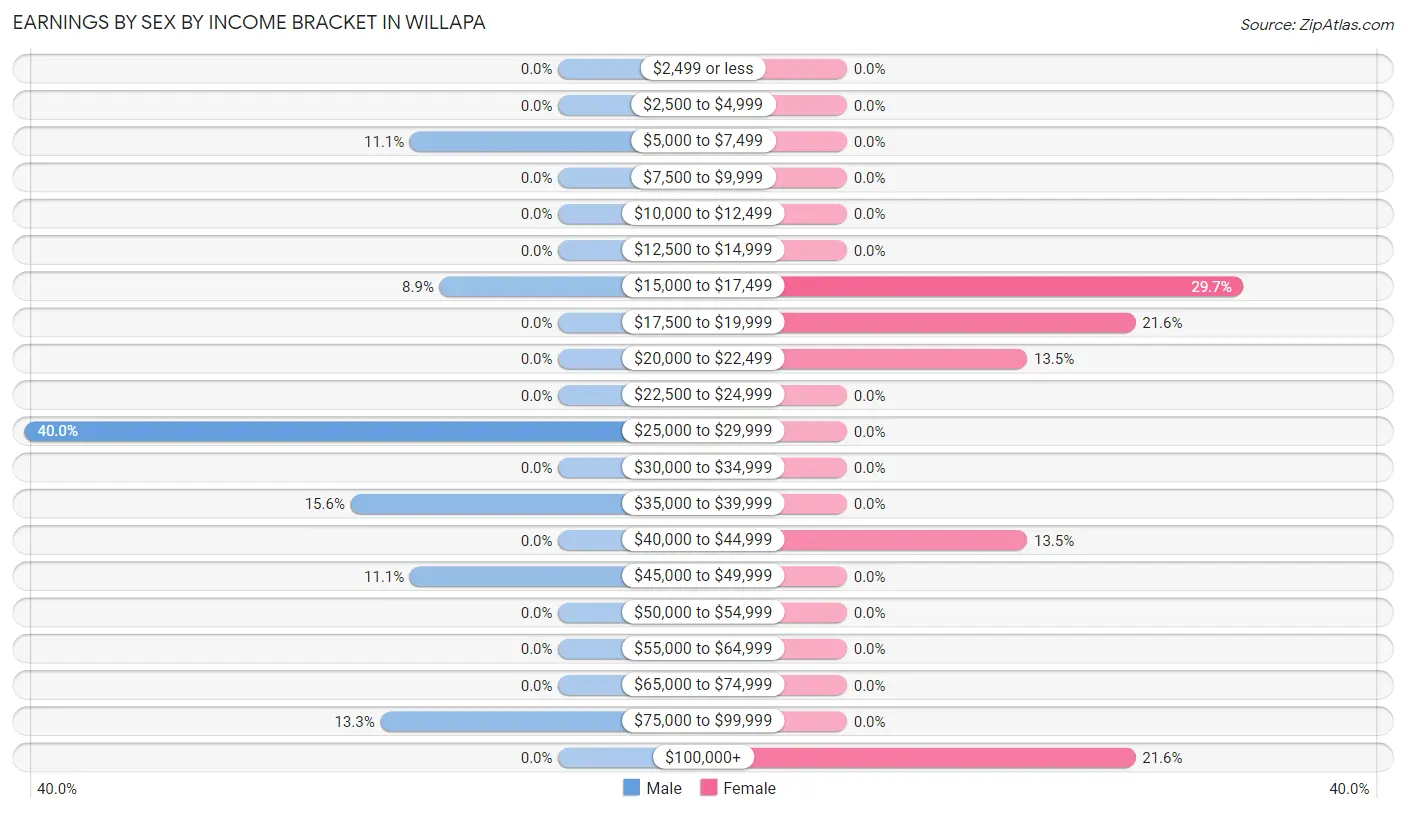
Earnings by Sex by Income Bracket in Willapa
The most common earnings brackets in Willapa are $25,000 to $29,999 for men (18 | 40.0%) and $15,000 to $17,499 for women (11 | 29.7%).
| Income | Male | Female |
| $2,499 or less | 0 (0.0%) | 0 (0.0%) |
| $2,500 to $4,999 | 0 (0.0%) | 0 (0.0%) |
| $5,000 to $7,499 | 5 (11.1%) | 0 (0.0%) |
| $7,500 to $9,999 | 0 (0.0%) | 0 (0.0%) |
| $10,000 to $12,499 | 0 (0.0%) | 0 (0.0%) |
| $12,500 to $14,999 | 0 (0.0%) | 0 (0.0%) |
| $15,000 to $17,499 | 4 (8.9%) | 11 (29.7%) |
| $17,500 to $19,999 | 0 (0.0%) | 8 (21.6%) |
| $20,000 to $22,499 | 0 (0.0%) | 5 (13.5%) |
| $22,500 to $24,999 | 0 (0.0%) | 0 (0.0%) |
| $25,000 to $29,999 | 18 (40.0%) | 0 (0.0%) |
| $30,000 to $34,999 | 0 (0.0%) | 0 (0.0%) |
| $35,000 to $39,999 | 7 (15.6%) | 0 (0.0%) |
| $40,000 to $44,999 | 0 (0.0%) | 5 (13.5%) |
| $45,000 to $49,999 | 5 (11.1%) | 0 (0.0%) |
| $50,000 to $54,999 | 0 (0.0%) | 0 (0.0%) |
| $55,000 to $64,999 | 0 (0.0%) | 0 (0.0%) |
| $65,000 to $74,999 | 0 (0.0%) | 0 (0.0%) |
| $75,000 to $99,999 | 6 (13.3%) | 0 (0.0%) |
| $100,000+ | 0 (0.0%) | 8 (21.6%) |
| Total | 45 (100.0%) | 37 (100.0%) |
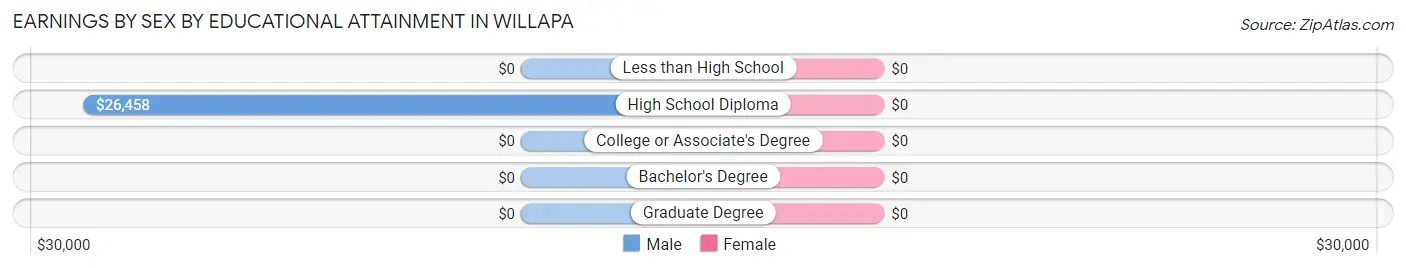
Earnings by Sex by Educational Attainment in Willapa
| Educational Attainment | Male Income | Female Income |
| Less than High School | - | - |
| High School Diploma | $26,458 | $0 |
| College or Associate's Degree | - | - |
| Bachelor's Degree | - | - |
| Graduate Degree | - | - |
| Total | $27,222 | $0 |
Family Income in Willapa
Family Income Brackets in Willapa
According to the Willapa family income data, there are 24 families falling into the $35,000 to $49,999 income range, which is the most common income bracket and makes up 45.3% of all families.

| Income Bracket | # Families | % Families |
| Less than $10,000 | 0 | 0.0% |
| $10,000 to $14,999 | 0 | 0.0% |
| $15,000 to $24,999 | 0 | 0.0% |
| $25,000 to $34,999 | 0 | 0.0% |
| $35,000 to $49,999 | 24 | 45.3% |
| $50,000 to $74,999 | 16 | 30.2% |
| $75,000 to $99,999 | 0 | 0.0% |
| $100,000 to $149,999 | 5 | 9.4% |
| $150,000 to $199,999 | 8 | 15.1% |
| $200,000+ | 0 | 0.0% |
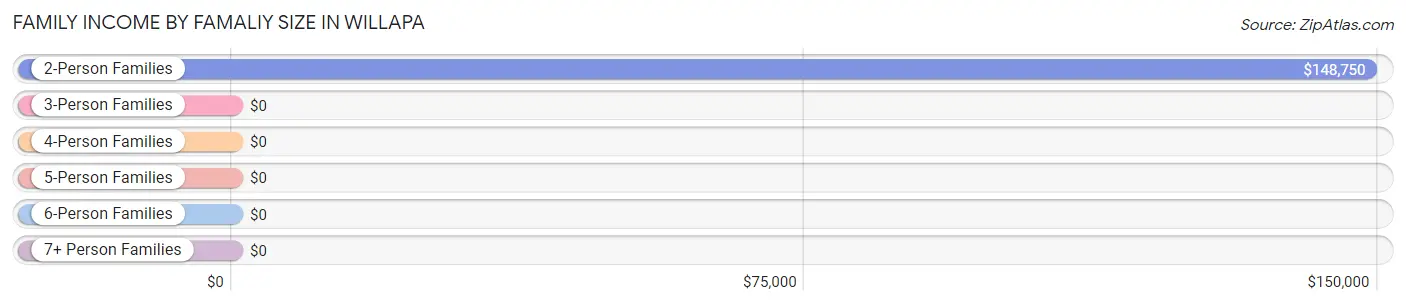
Family Income by Famaliy Size in Willapa
2-person families (21 | 39.6%) account for the highest median family income in Willapa with $148,750 per family, while 2-person families (21 | 39.6%) have the highest median income of $74,375 per family member.
| Income Bracket | # Families | Median Income |
| 2-Person Families | 21 (39.6%) | $148,750 |
| 3-Person Families | 14 (26.4%) | $0 |
| 4-Person Families | 0 (0.0%) | $0 |
| 5-Person Families | 11 (20.7%) | $0 |
| 6-Person Families | 7 (13.2%) | $0 |
| 7+ Person Families | 0 (0.0%) | $0 |
| Total | 53 (100.0%) | $50,781 |
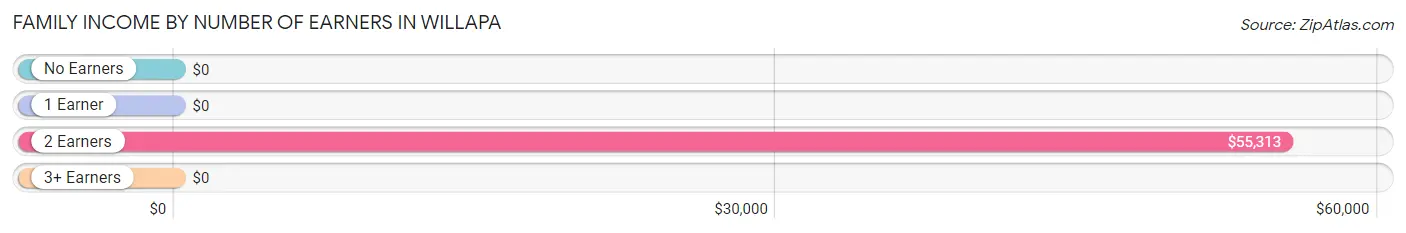
Family Income by Number of Earners in Willapa
| Number of Earners | # Families | Median Income |
| No Earners | 6 (11.3%) | $0 |
| 1 Earner | 23 (43.4%) | $0 |
| 2 Earners | 24 (45.3%) | $55,313 |
| 3+ Earners | 0 (0.0%) | $0 |
| Total | 53 (100.0%) | $50,781 |
Household Income in Willapa
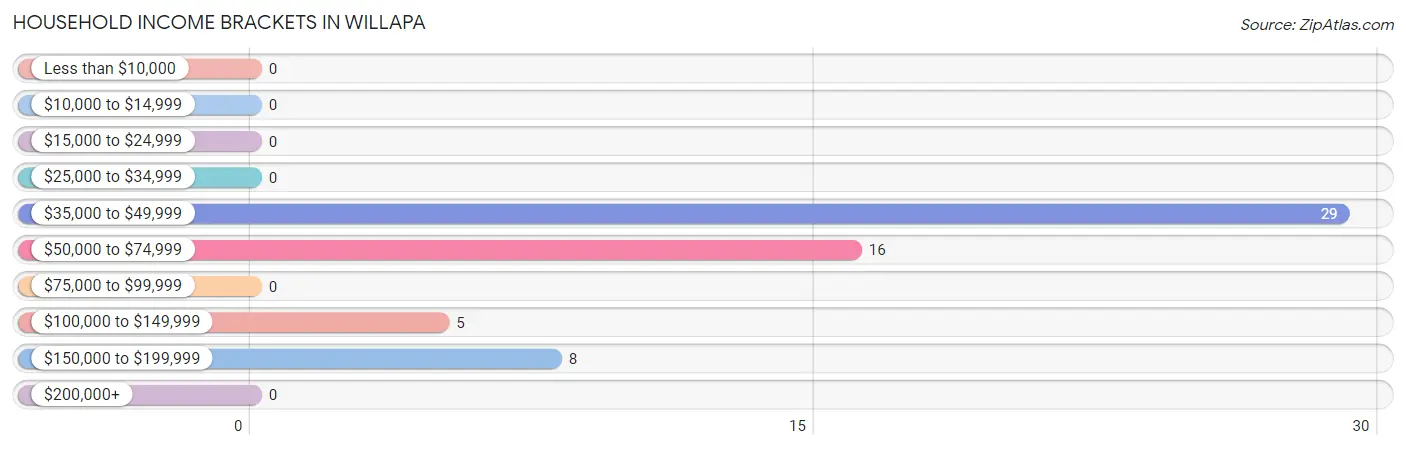
Household Income Brackets in Willapa
With 29 households falling in the category, the $35,000 to $49,999 income range is the most frequent in Willapa, accounting for 50.0% of all households.
| Income Bracket | # Households | % Households |
| Less than $10,000 | 0 | 0.0% |
| $10,000 to $14,999 | 0 | 0.0% |
| $15,000 to $24,999 | 0 | 0.0% |
| $25,000 to $34,999 | 0 | 0.0% |
| $35,000 to $49,999 | 29 | 50.0% |
| $50,000 to $74,999 | 16 | 27.6% |
| $75,000 to $99,999 | 0 | 0.0% |
| $100,000 to $149,999 | 5 | 8.6% |
| $150,000 to $199,999 | 8 | 13.8% |
| $200,000+ | 0 | 0.0% |
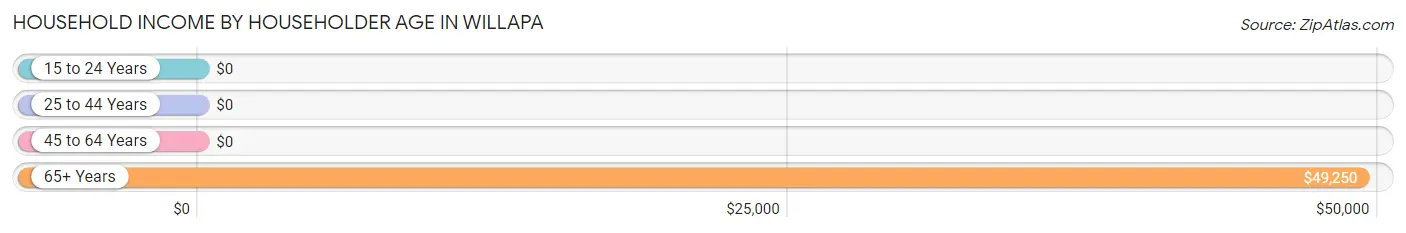
Household Income by Householder Age in Willapa
The median household income in Willapa is $50,000, with the highest median household income of $49,250 found in the 65+ years age bracket for the primary householder. A total of 19 households (32.8%) fall into this category.
| Income Bracket | # Households | Median Income |
| 15 to 24 Years | 0 (0.0%) | $0 |
| 25 to 44 Years | 11 (19.0%) | $0 |
| 45 to 64 Years | 28 (48.3%) | $0 |
| 65+ Years | 19 (32.8%) | $49,250 |
| Total | 58 (100.0%) | $50,000 |
Poverty in Willapa
Income Below Poverty by Sex and Age in Willapa
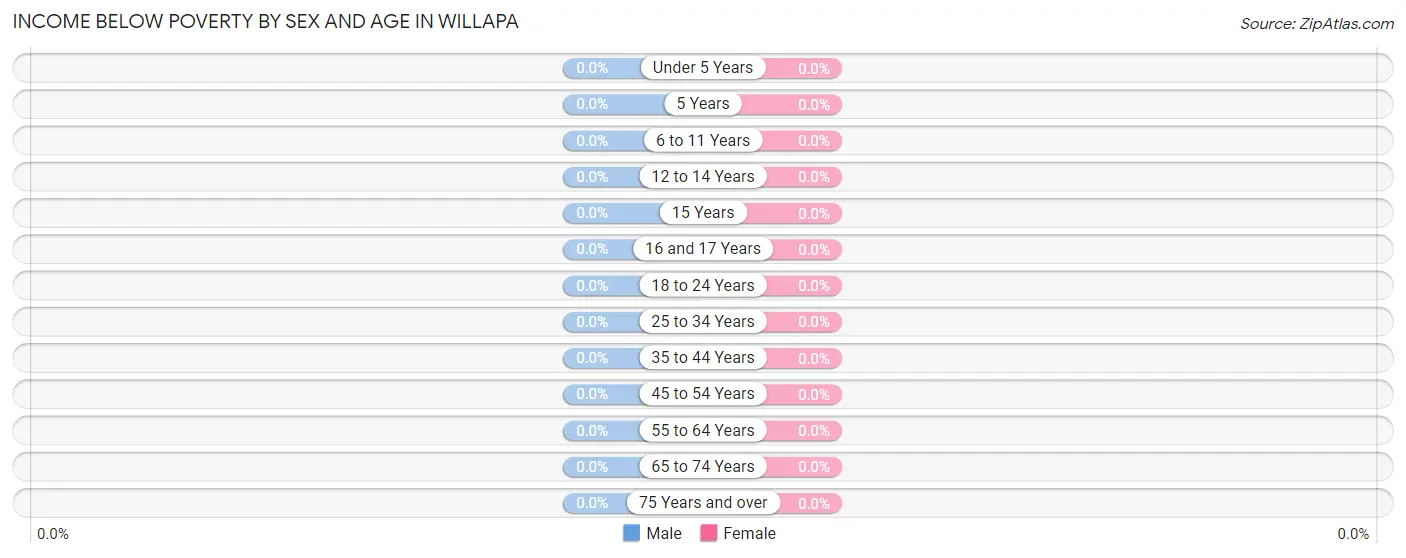
| Age Bracket | Male | Female |
| Under 5 Years | 0 (0.0%) | 0 (0.0%) |
| 5 Years | 0 (0.0%) | 0 (0.0%) |
| 6 to 11 Years | 0 (0.0%) | 0 (0.0%) |
| 12 to 14 Years | 0 (0.0%) | 0 (0.0%) |
| 15 Years | 0 (0.0%) | 0 (0.0%) |
| 16 and 17 Years | 0 (0.0%) | 0 (0.0%) |
| 18 to 24 Years | 0 (0.0%) | 0 (0.0%) |
| 25 to 34 Years | 0 (0.0%) | 0 (0.0%) |
| 35 to 44 Years | 0 (0.0%) | 0 (0.0%) |
| 45 to 54 Years | 0 (0.0%) | 0 (0.0%) |
| 55 to 64 Years | 0 (0.0%) | 0 (0.0%) |
| 65 to 74 Years | 0 (0.0%) | 0 (0.0%) |
| 75 Years and over | 0 (0.0%) | 0 (0.0%) |
| Total | 0 (0.0%) | 0 (0.0%) |
Income Above Poverty by Sex and Age in Willapa
According to the poverty statistics in Willapa, males aged under 5 years and females aged under 5 years are the age groups that are most secure financially, with 100.0% of males and 100.0% of females in these age groups living above the poverty line.
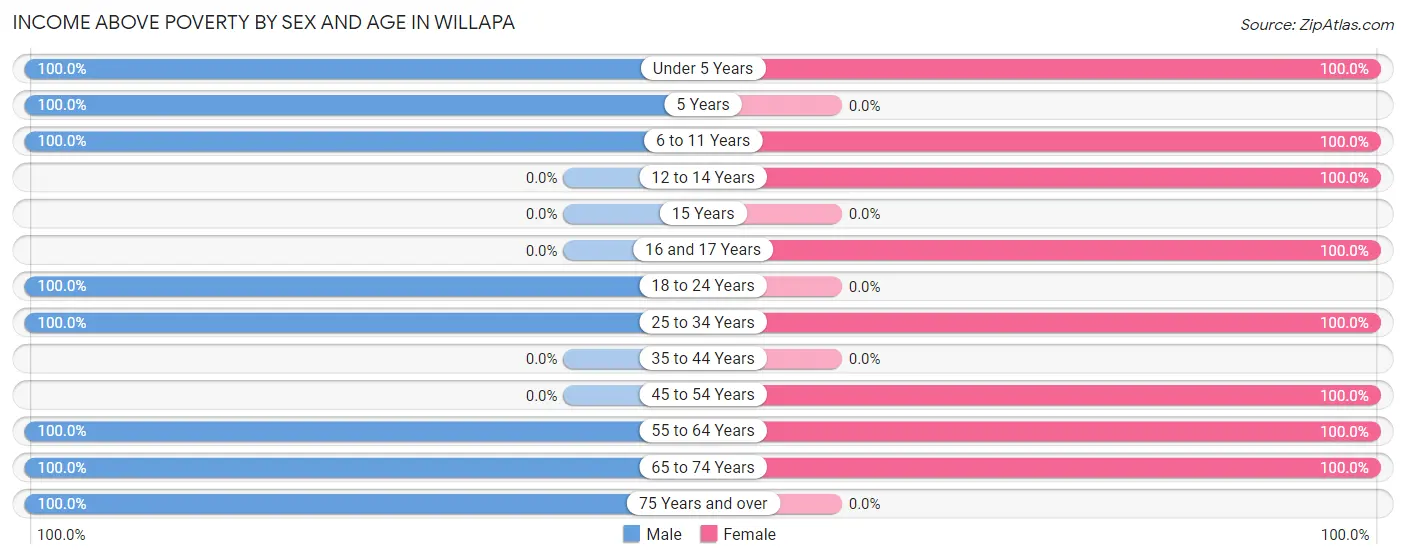
| Age Bracket | Male | Female |
| Under 5 Years | 4 (100.0%) | 9 (100.0%) |
| 5 Years | 5 (100.0%) | 0 (0.0%) |
| 6 to 11 Years | 16 (100.0%) | 6 (100.0%) |
| 12 to 14 Years | 0 (0.0%) | 6 (100.0%) |
| 15 Years | 0 (0.0%) | 0 (0.0%) |
| 16 and 17 Years | 0 (0.0%) | 11 (100.0%) |
| 18 to 24 Years | 5 (100.0%) | 0 (0.0%) |
| 25 to 34 Years | 18 (100.0%) | 11 (100.0%) |
| 35 to 44 Years | 0 (0.0%) | 0 (0.0%) |
| 45 to 54 Years | 0 (0.0%) | 25 (100.0%) |
| 55 to 64 Years | 13 (100.0%) | 8 (100.0%) |
| 65 to 74 Years | 15 (100.0%) | 9 (100.0%) |
| 75 Years and over | 13 (100.0%) | 0 (0.0%) |
| Total | 89 (100.0%) | 85 (100.0%) |
Income Below Poverty Among Married-Couple Families in Willapa
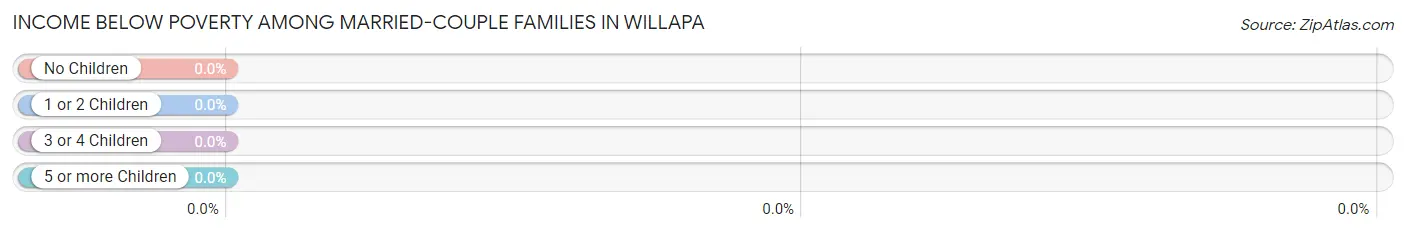
| Children | Above Poverty | Below Poverty |
| No Children | 21 (100.0%) | 0 (0.0%) |
| 1 or 2 Children | 6 (100.0%) | 0 (0.0%) |
| 3 or 4 Children | 18 (100.0%) | 0 (0.0%) |
| 5 or more Children | 0 (0.0%) | 0 (0.0%) |
| Total | 45 (100.0%) | 0 (0.0%) |
Income Below Poverty Among Single-Parent Households in Willapa
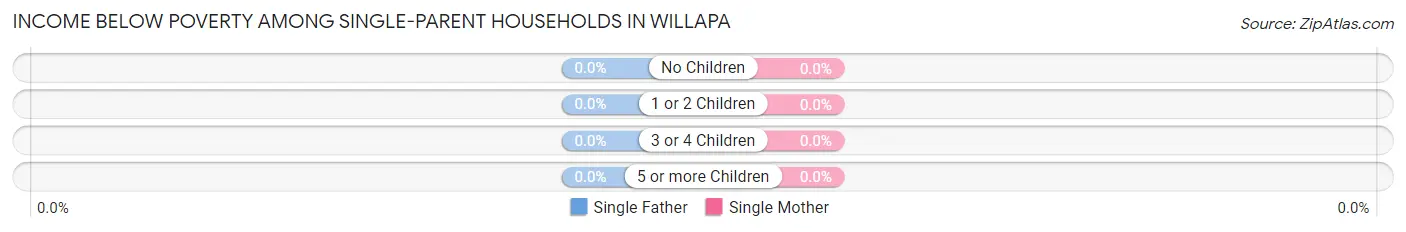
| Children | Single Father | Single Mother |
| No Children | 0 (0.0%) | 0 (0.0%) |
| 1 or 2 Children | 0 (0.0%) | 0 (0.0%) |
| 3 or 4 Children | 0 (0.0%) | 0 (0.0%) |
| 5 or more Children | 0 (0.0%) | 0 (0.0%) |
| Total | 0 (0.0%) | 0 (0.0%) |
Income Below Poverty Among Married-Couple vs Single-Parent Households in Willapa
| Children | Married-Couple Families | Single-Parent Households |
| No Children | 0 (0.0%) | 0 (0.0%) |
| 1 or 2 Children | 0 (0.0%) | 0 (0.0%) |
| 3 or 4 Children | 0 (0.0%) | 0 (0.0%) |
| 5 or more Children | 0 (0.0%) | 0 (0.0%) |
| Total | 0 (0.0%) | 0 (0.0%) |
Race in Willapa
The most populous races in Willapa are White / Caucasian (173 | 97.2%), and Black / African American (5 | 2.8%).
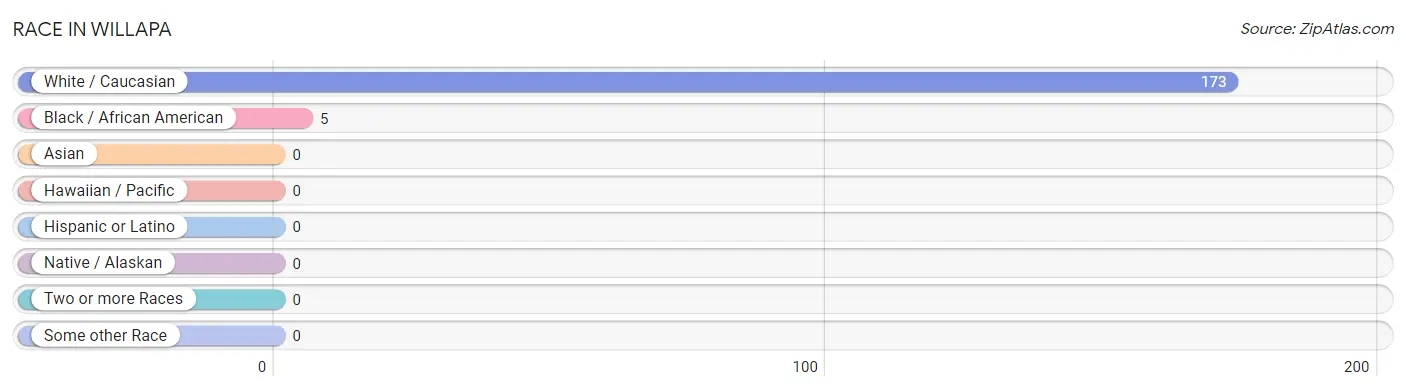
| Race | # Population | % Population |
| Asian | 0 | 0.0% |
| Black / African American | 5 | 2.8% |
| Hawaiian / Pacific | 0 | 0.0% |
| Hispanic or Latino | 0 | 0.0% |
| Native / Alaskan | 0 | 0.0% |
| White / Caucasian | 173 | 97.2% |
| Two or more Races | 0 | 0.0% |
| Some other Race | 0 | 0.0% |
| Total | 178 | 100.0% |
Ancestry in Willapa
The most populous ancestries reported in Willapa are German (59 | 33.2%), American (29 | 16.3%), Norwegian (9 | 5.1%), Swedish (9 | 5.1%), and Swiss (8 | 4.5%), together accounting for 64.1% of all Willapa residents.
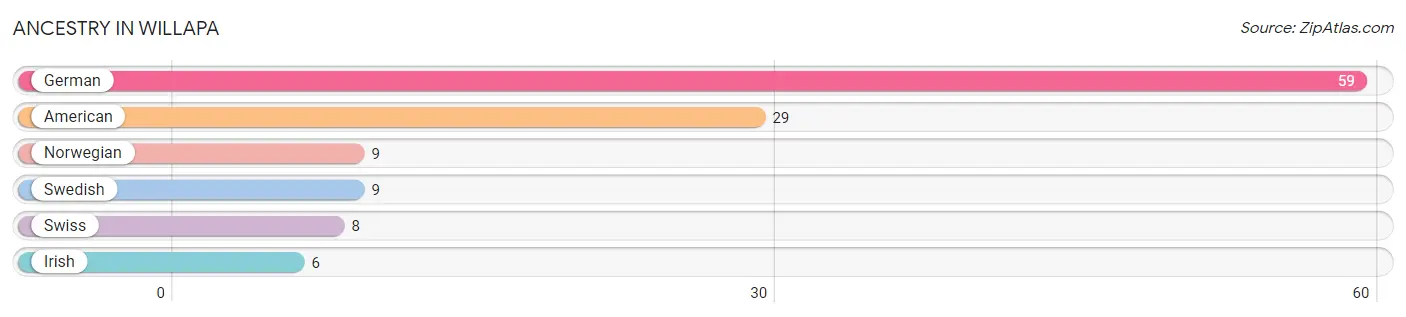
| Ancestry | # Population | % Population |
| American | 29 | 16.3% |
| German | 59 | 33.2% |
| Irish | 6 | 3.4% |
| Norwegian | 9 | 5.1% |
| Swedish | 9 | 5.1% |
| Swiss | 8 | 4.5% | View All 6 Rows |
Immigrants in Willapa

| Immigration Origin | # Population | % Population | View All 0 Rows |
Sex and Age in Willapa
Sex and Age in Willapa
The most populous age groups in Willapa are 30 to 34 Years (18 | 19.4%) for men and 50 to 54 Years (13 | 15.3%) for women.
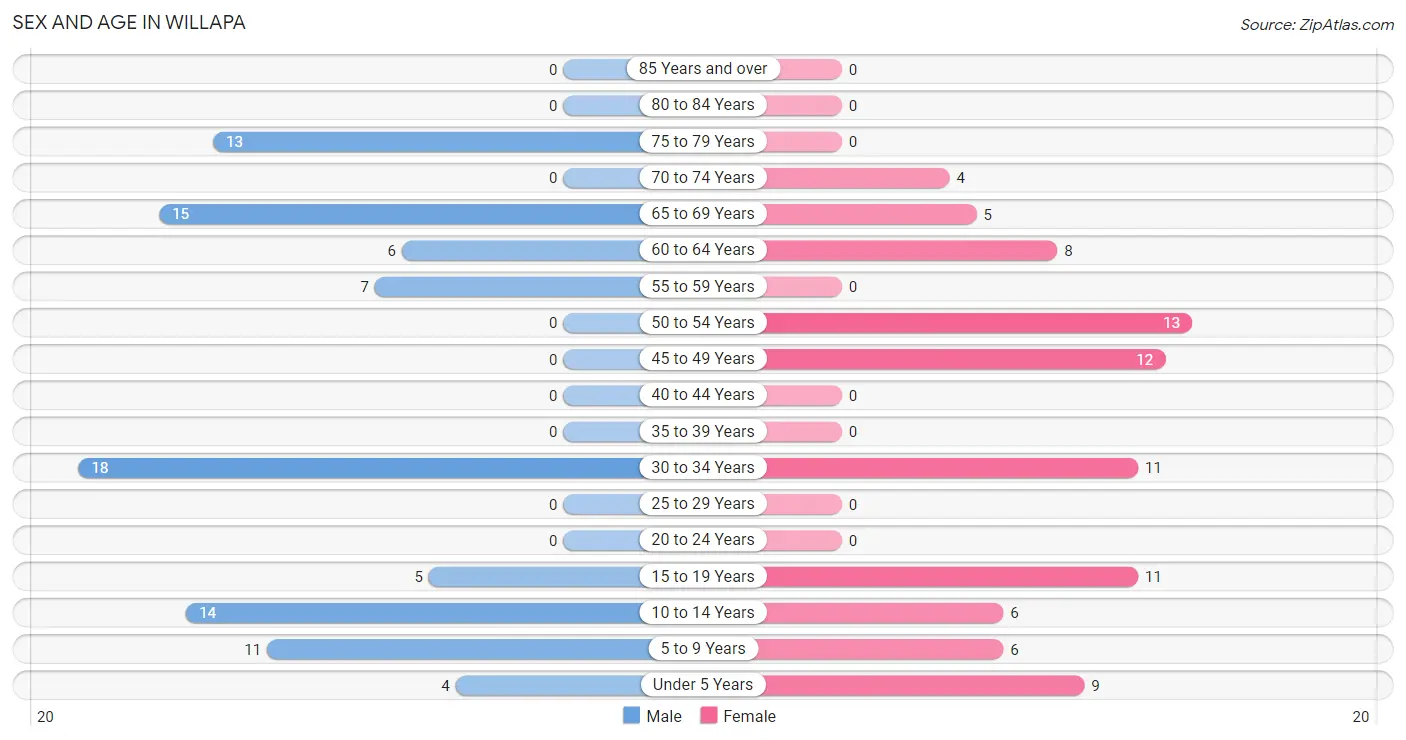
| Age Bracket | Male | Female |
| Under 5 Years | 4 (4.3%) | 9 (10.6%) |
| 5 to 9 Years | 11 (11.8%) | 6 (7.1%) |
| 10 to 14 Years | 14 (15.0%) | 6 (7.1%) |
| 15 to 19 Years | 5 (5.4%) | 11 (12.9%) |
| 20 to 24 Years | 0 (0.0%) | 0 (0.0%) |
| 25 to 29 Years | 0 (0.0%) | 0 (0.0%) |
| 30 to 34 Years | 18 (19.4%) | 11 (12.9%) |
| 35 to 39 Years | 0 (0.0%) | 0 (0.0%) |
| 40 to 44 Years | 0 (0.0%) | 0 (0.0%) |
| 45 to 49 Years | 0 (0.0%) | 12 (14.1%) |
| 50 to 54 Years | 0 (0.0%) | 13 (15.3%) |
| 55 to 59 Years | 7 (7.5%) | 0 (0.0%) |
| 60 to 64 Years | 6 (6.5%) | 8 (9.4%) |
| 65 to 69 Years | 15 (16.1%) | 5 (5.9%) |
| 70 to 74 Years | 0 (0.0%) | 4 (4.7%) |
| 75 to 79 Years | 13 (14.0%) | 0 (0.0%) |
| 80 to 84 Years | 0 (0.0%) | 0 (0.0%) |
| 85 Years and over | 0 (0.0%) | 0 (0.0%) |
| Total | 93 (100.0%) | 85 (100.0%) |
Families and Households in Willapa
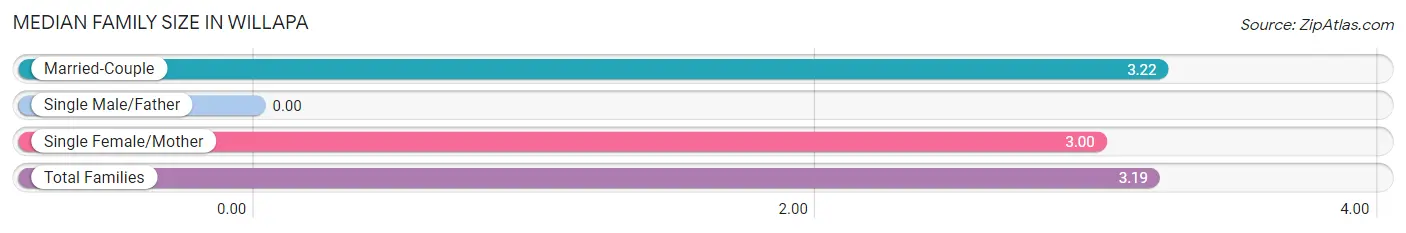
Median Family Size in Willapa
| Family Type | # Families | Family Size |
| Married-Couple | 45 (84.9%) | 3.22 |
| Single Male/Father | 0 (0.0%) | - |
| Single Female/Mother | 8 (15.1%) | 3.00 |
| Total Families | 53 (100.0%) | 3.19 |
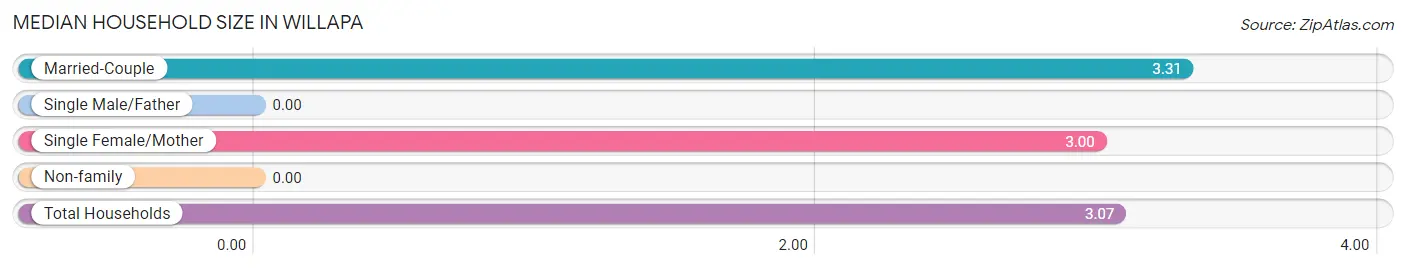
Median Household Size in Willapa
| Household Type | # Households | Household Size |
| Married-Couple | 45 (77.6%) | 3.31 |
| Single Male/Father | 0 (0.0%) | - |
| Single Female/Mother | 8 (13.8%) | 3.00 |
| Non-family | 5 (8.6%) | - |
| Total Households | 58 (100.0%) | 3.07 |
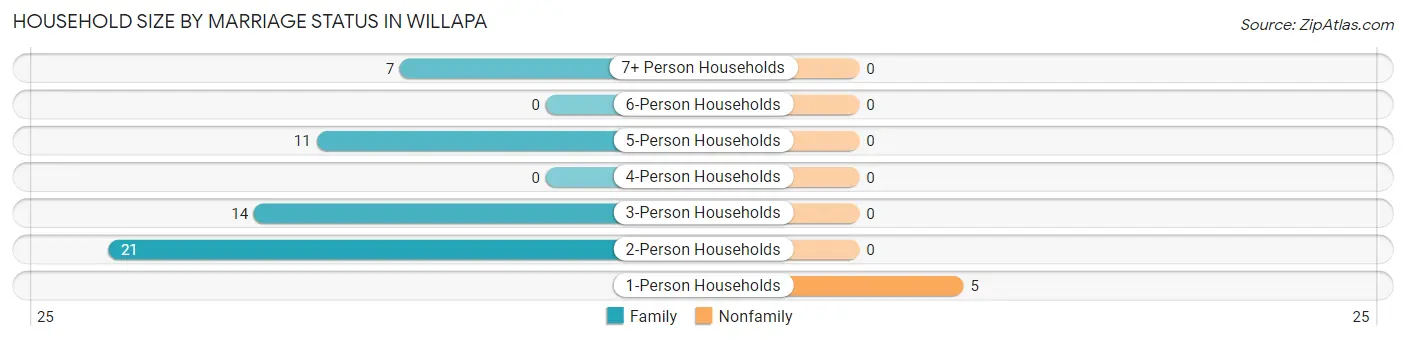
Household Size by Marriage Status in Willapa
Out of a total of 58 households in Willapa, 53 (91.4%) are family households, while 5 (8.6%) are nonfamily households. The most numerous type of family households are 2-person households, comprising 21, and the most common type of nonfamily households are 1-person households, comprising 5.
| Household Size | Family Households | Nonfamily Households |
| 1-Person Households | - | 5 (8.6%) |
| 2-Person Households | 21 (36.2%) | 0 (0.0%) |
| 3-Person Households | 14 (24.1%) | 0 (0.0%) |
| 4-Person Households | 0 (0.0%) | 0 (0.0%) |
| 5-Person Households | 11 (19.0%) | 0 (0.0%) |
| 6-Person Households | 0 (0.0%) | 0 (0.0%) |
| 7+ Person Households | 7 (12.1%) | 0 (0.0%) |
| Total | 53 (91.4%) | 5 (8.6%) |
Female Fertility in Willapa
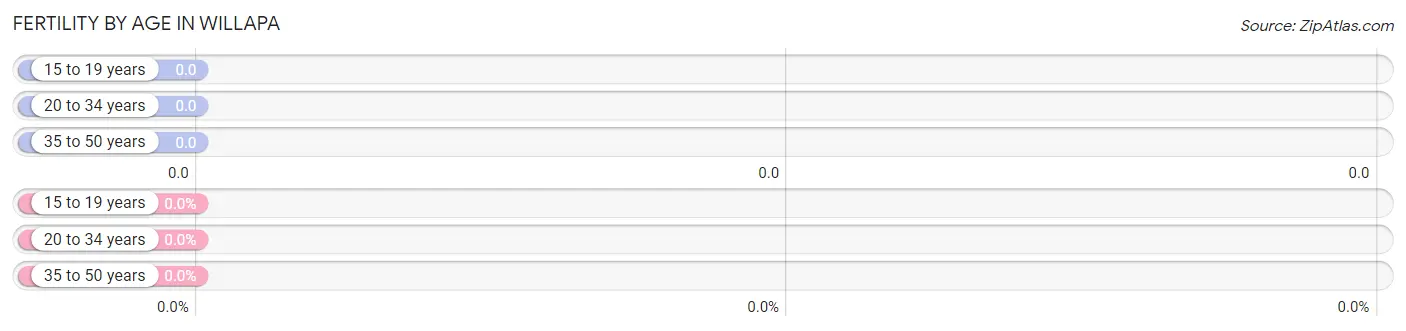
Fertility by Age in Willapa
| Age Bracket | Women with Births | Births / 1,000 Women |
| 15 to 19 years | 0 (0.0%) | 0.0 |
| 20 to 34 years | 0 (0.0%) | 0.0 |
| 35 to 50 years | 0 (0.0%) | 0.0 |
| Total | 0 (0.0%) | 0.0 |
Fertility by Age by Marriage Status in Willapa
| Age Bracket | Married | Unmarried |
| 15 to 19 years | 0 (0.0%) | 0 (0.0%) |
| 20 to 34 years | 0 (0.0%) | 0 (0.0%) |
| 35 to 50 years | 0 (0.0%) | 0 (0.0%) |
| Total | 0 (0.0%) | 0 (0.0%) |
Fertility by Education in Willapa
| Educational Attainment | Women with Births | Births / 1,000 Women |
| Less than High School | 0 (0.0%) | 0.0 |
| High School Diploma | 0 (0.0%) | 0.0 |
| College or Associate's Degree | 0 (0.0%) | 0.0 |
| Bachelor's Degree | 0 (0.0%) | 0.0 |
| Graduate Degree | 0 (0.0%) | 0.0 |
| Total | 0 (0.0%) | 0.0 |
Fertility by Education by Marriage Status in Willapa
| Educational Attainment | Married | Unmarried |
| Less than High School | 0 (0.0%) | 0 (0.0%) |
| High School Diploma | 0 (0.0%) | 0 (0.0%) |
| College or Associate's Degree | 0 (0.0%) | 0 (0.0%) |
| Bachelor's Degree | 0 (0.0%) | 0 (0.0%) |
| Graduate Degree | 0 (0.0%) | 0 (0.0%) |
| Total | 0 (0.0%) | 0 (0.0%) |
Employment Characteristics in Willapa
Employment by Class of Employer in Willapa
Among the 71 employed individuals in Willapa, private company employees (55 | 77.5%), local government employees (7 | 9.9%), and self-employed (incorporated) (5 | 7.0%) make up the most common classes of employment.
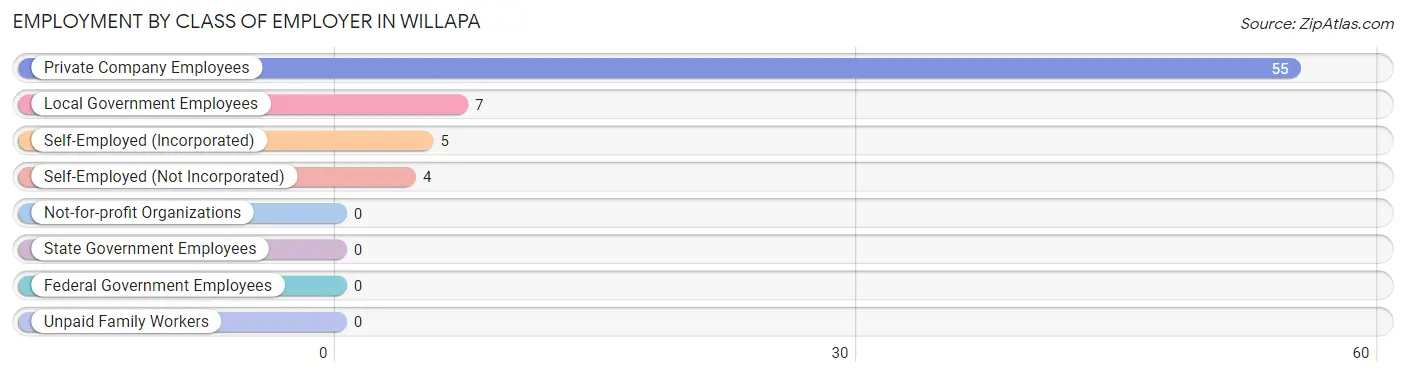
| Employer Class | # Employees | % Employees |
| Private Company Employees | 55 | 77.5% |
| Self-Employed (Incorporated) | 5 | 7.0% |
| Self-Employed (Not Incorporated) | 4 | 5.6% |
| Not-for-profit Organizations | 0 | 0.0% |
| Local Government Employees | 7 | 9.9% |
| State Government Employees | 0 | 0.0% |
| Federal Government Employees | 0 | 0.0% |
| Unpaid Family Workers | 0 | 0.0% |
| Total | 71 | 100.0% |
Employment Status by Age in Willapa
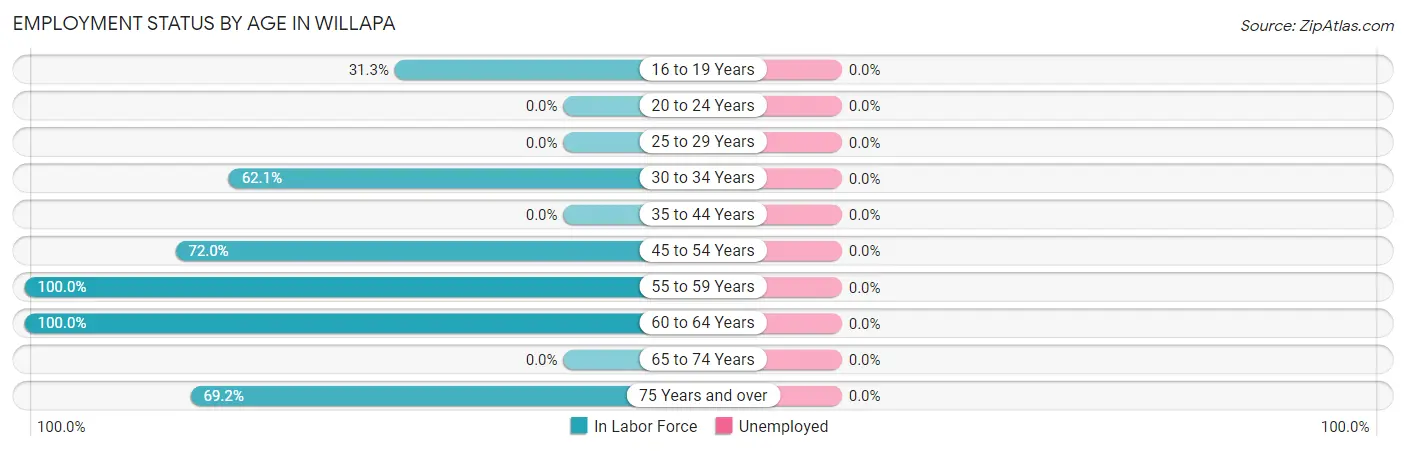
| Age Bracket | In Labor Force | Unemployed |
| 16 to 19 Years | 5 (31.3%) | 0 (0.0%) |
| 20 to 24 Years | 0 (0.0%) | 0 (0.0%) |
| 25 to 29 Years | 0 (0.0%) | 0 (0.0%) |
| 30 to 34 Years | 18 (62.1%) | 0 (0.0%) |
| 35 to 44 Years | 0 (0.0%) | 0 (0.0%) |
| 45 to 54 Years | 18 (72.0%) | 0 (0.0%) |
| 55 to 59 Years | 7 (100.0%) | 0 (0.0%) |
| 60 to 64 Years | 14 (100.0%) | 0 (0.0%) |
| 65 to 74 Years | 0 (0.0%) | 0 (0.0%) |
| 75 Years and over | 9 (69.2%) | 0 (0.0%) |
| Total | 71 (55.5%) | 0 (0.0%) |
Employment Status by Educational Attainment in Willapa
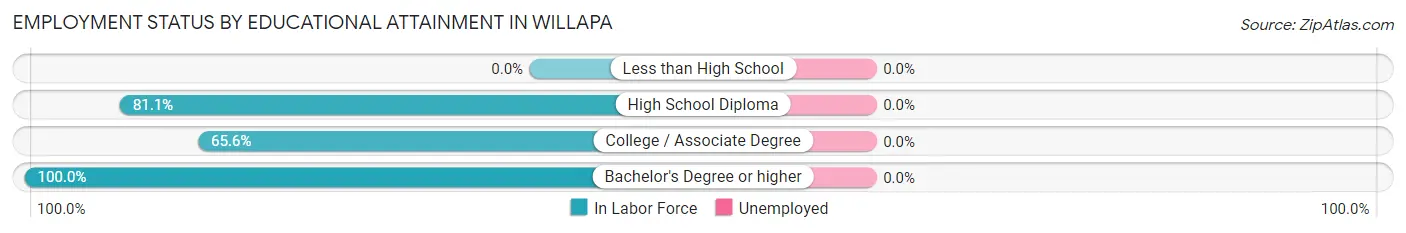
| Educational Attainment | In Labor Force | Unemployed |
| Less than High School | 0 (0.0%) | 0 (0.0%) |
| High School Diploma | 30 (81.1%) | 0 (0.0%) |
| College / Associate Degree | 21 (65.6%) | 0 (0.0%) |
| Bachelor's Degree or higher | 6 (100.0%) | 0 (0.0%) |
| Total | 57 (76.0%) | 0 (0.0%) |
Employment Occupations by Sex in Willapa
Management, Business, Science and Arts Occupations
The most common Management, Business, Science and Arts occupations in Willapa are , and Business & Financial (8 | 11.3%).
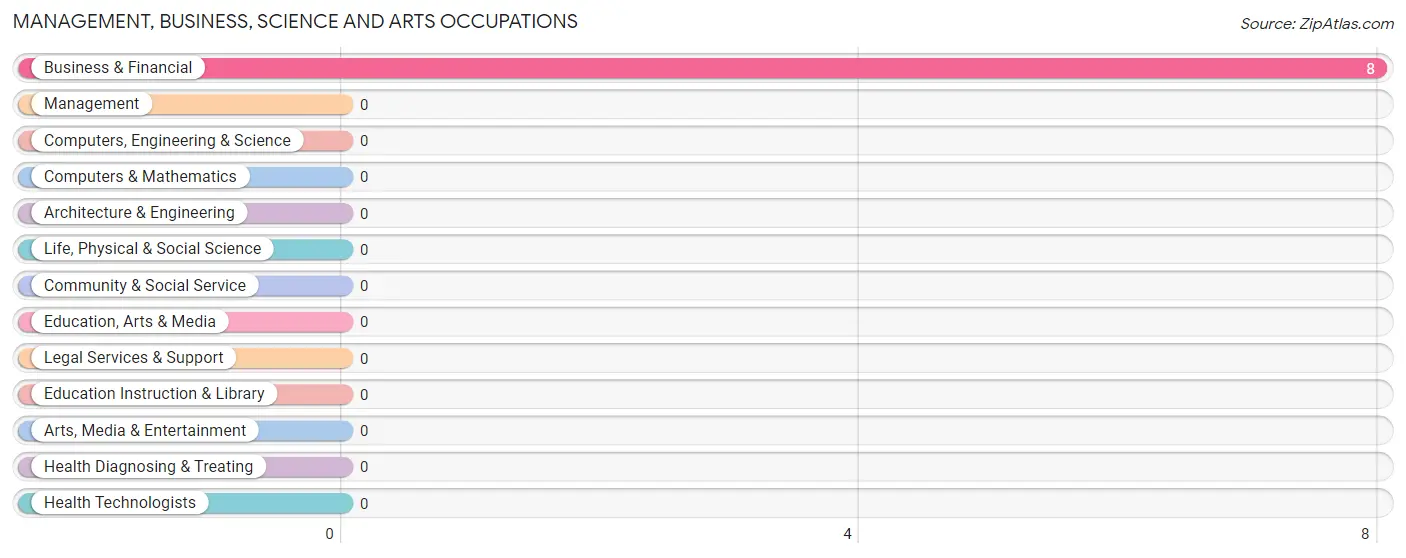
Management, Business, Science and Arts Occupations by Sex
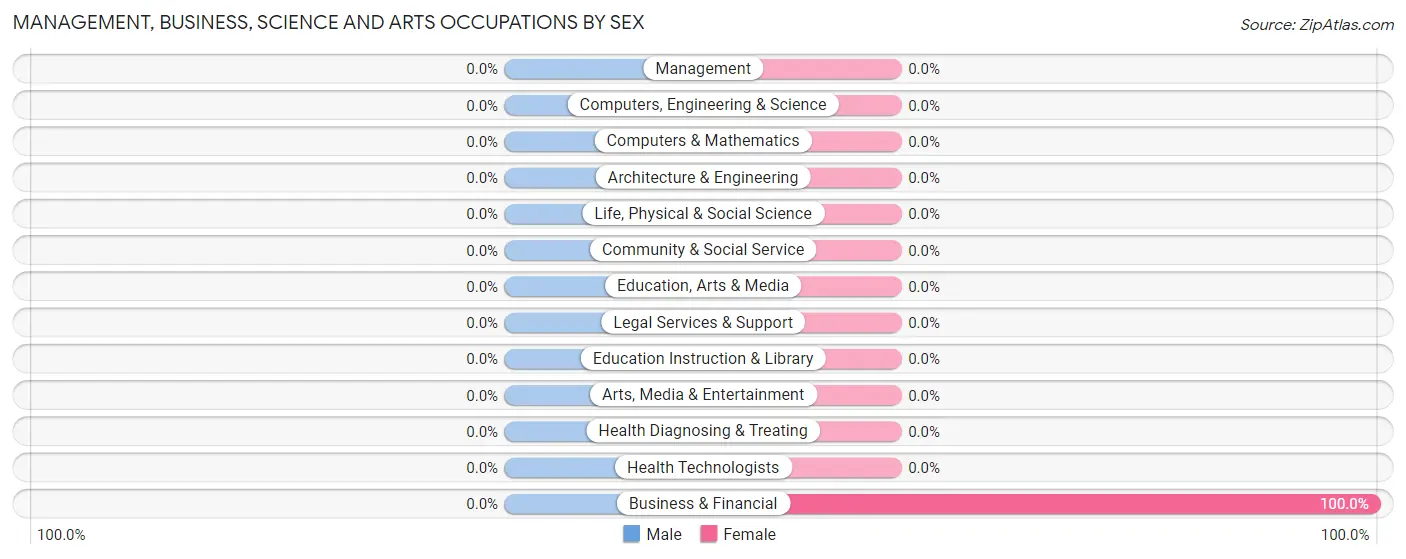
| Occupation | Male | Female |
| Management | 0 (0.0%) | 0 (0.0%) |
| Business & Financial | 0 (0.0%) | 8 (100.0%) |
| Computers, Engineering & Science | 0 (0.0%) | 0 (0.0%) |
| Computers & Mathematics | 0 (0.0%) | 0 (0.0%) |
| Architecture & Engineering | 0 (0.0%) | 0 (0.0%) |
| Life, Physical & Social Science | 0 (0.0%) | 0 (0.0%) |
| Community & Social Service | 0 (0.0%) | 0 (0.0%) |
| Education, Arts & Media | 0 (0.0%) | 0 (0.0%) |
| Legal Services & Support | 0 (0.0%) | 0 (0.0%) |
| Education Instruction & Library | 0 (0.0%) | 0 (0.0%) |
| Arts, Media & Entertainment | 0 (0.0%) | 0 (0.0%) |
| Health Diagnosing & Treating | 0 (0.0%) | 0 (0.0%) |
| Health Technologists | 0 (0.0%) | 0 (0.0%) |
| Total (Category) | 0 (0.0%) | 8 (100.0%) |
| Total (Overall) | 45 (63.4%) | 26 (36.6%) |
Services Occupations
The most common Services occupations in Willapa are Cleaning & Maintenance (25 | 35.2%), Food Preparation & Serving (8 | 11.3%), and Personal Care & Service (4 | 5.6%).

Services Occupations by Sex
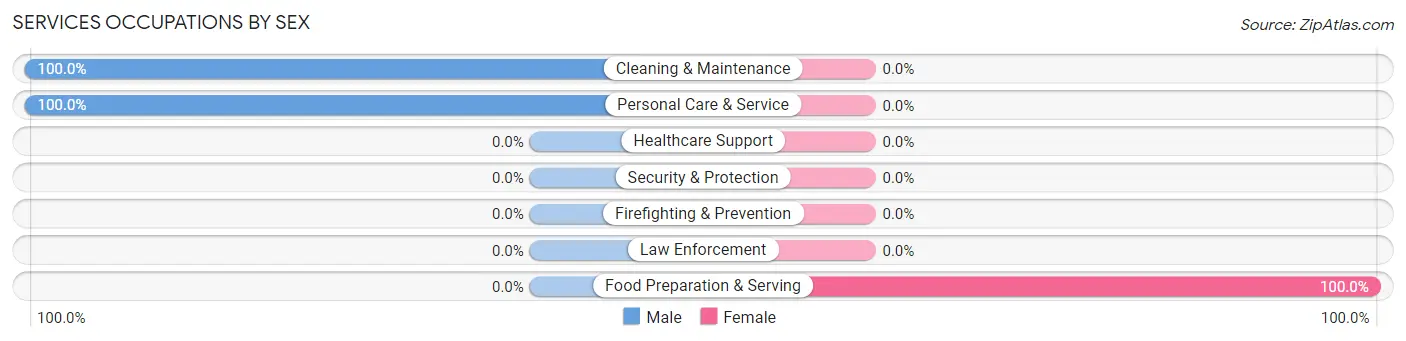
| Occupation | Male | Female |
| Healthcare Support | 0 (0.0%) | 0 (0.0%) |
| Security & Protection | 0 (0.0%) | 0 (0.0%) |
| Firefighting & Prevention | 0 (0.0%) | 0 (0.0%) |
| Law Enforcement | 0 (0.0%) | 0 (0.0%) |
| Food Preparation & Serving | 0 (0.0%) | 8 (100.0%) |
| Cleaning & Maintenance | 25 (100.0%) | 0 (0.0%) |
| Personal Care & Service | 4 (100.0%) | 0 (0.0%) |
| Total (Category) | 29 (78.4%) | 8 (21.6%) |
| Total (Overall) | 45 (63.4%) | 26 (36.6%) |
Sales and Office Occupations
The most common Sales and Office occupations in Willapa are , and Sales & Related (10 | 14.1%).
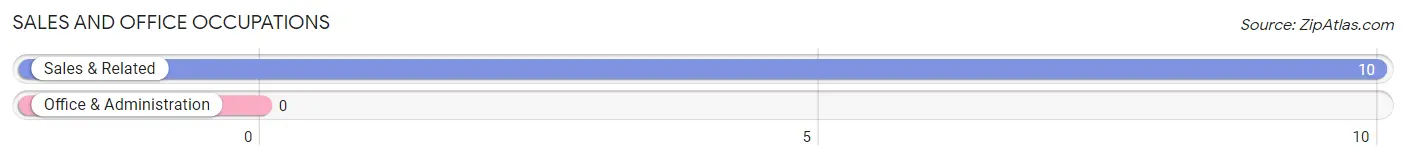
Sales and Office Occupations by Sex
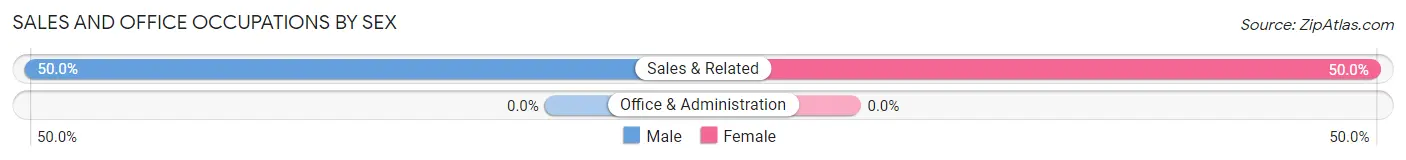
| Occupation | Male | Female |
| Sales & Related | 5 (50.0%) | 5 (50.0%) |
| Office & Administration | 0 (0.0%) | 0 (0.0%) |
| Total (Category) | 5 (50.0%) | 5 (50.0%) |
| Total (Overall) | 45 (63.4%) | 26 (36.6%) |
Natural Resources, Construction and Maintenance Occupations
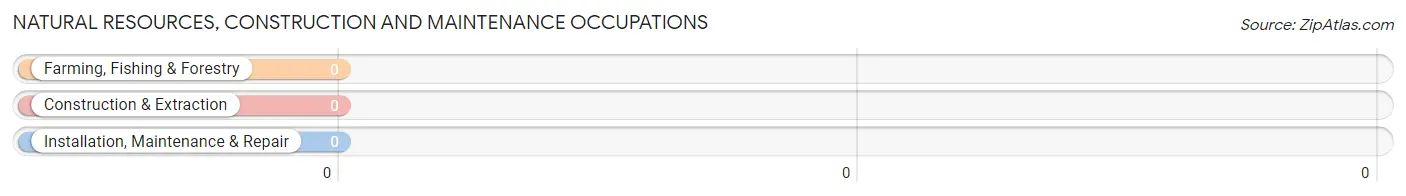
Natural Resources, Construction and Maintenance Occupations by Sex
| Occupation | Male | Female |
| Farming, Fishing & Forestry | 0 (0.0%) | 0 (0.0%) |
| Construction & Extraction | 0 (0.0%) | 0 (0.0%) |
| Installation, Maintenance & Repair | 0 (0.0%) | 0 (0.0%) |
| Total (Category) | 0 (0.0%) | 0 (0.0%) |
| Total (Overall) | 45 (63.4%) | 26 (36.6%) |
Production, Transportation and Moving Occupations
The most common Production, Transportation and Moving occupations in Willapa are Production (11 | 15.5%), and Material Moving (5 | 7.0%).
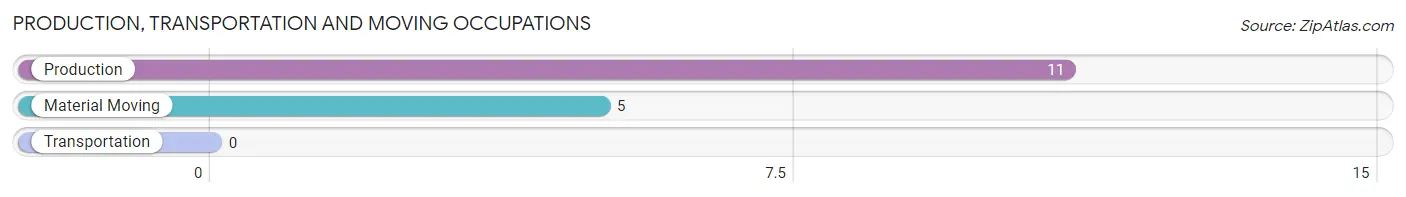
Production, Transportation and Moving Occupations by Sex
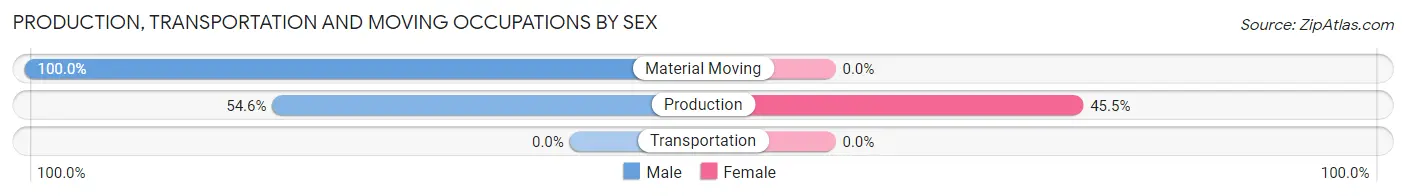
| Occupation | Male | Female |
| Production | 6 (54.5%) | 5 (45.5%) |
| Transportation | 0 (0.0%) | 0 (0.0%) |
| Material Moving | 5 (100.0%) | 0 (0.0%) |
| Total (Category) | 11 (68.8%) | 5 (31.2%) |
| Total (Overall) | 45 (63.4%) | 26 (36.6%) |
Employment Industries by Sex in Willapa
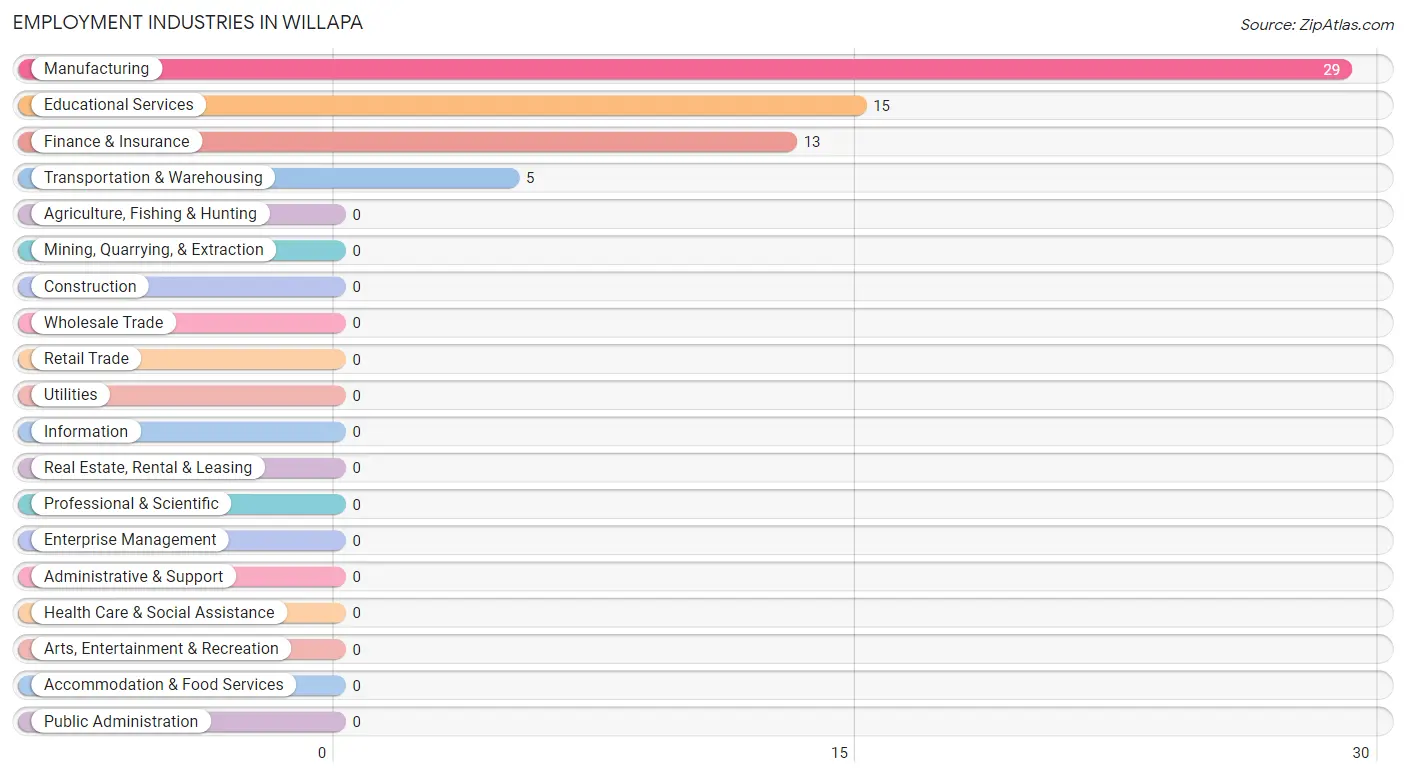
Employment Industries in Willapa
The major employment industries in Willapa include Manufacturing (29 | 40.8%), Educational Services (15 | 21.1%), Finance & Insurance (13 | 18.3%), and Transportation & Warehousing (5 | 7.0%).
Employment Industries by Sex in Willapa
The Willapa industries that see more men than women are Manufacturing (100.0%), Transportation & Warehousing (100.0%), and Educational Services (46.7%), whereas the industries that tend to have a higher number of women are Finance & Insurance (100.0%), and Educational Services (53.3%).
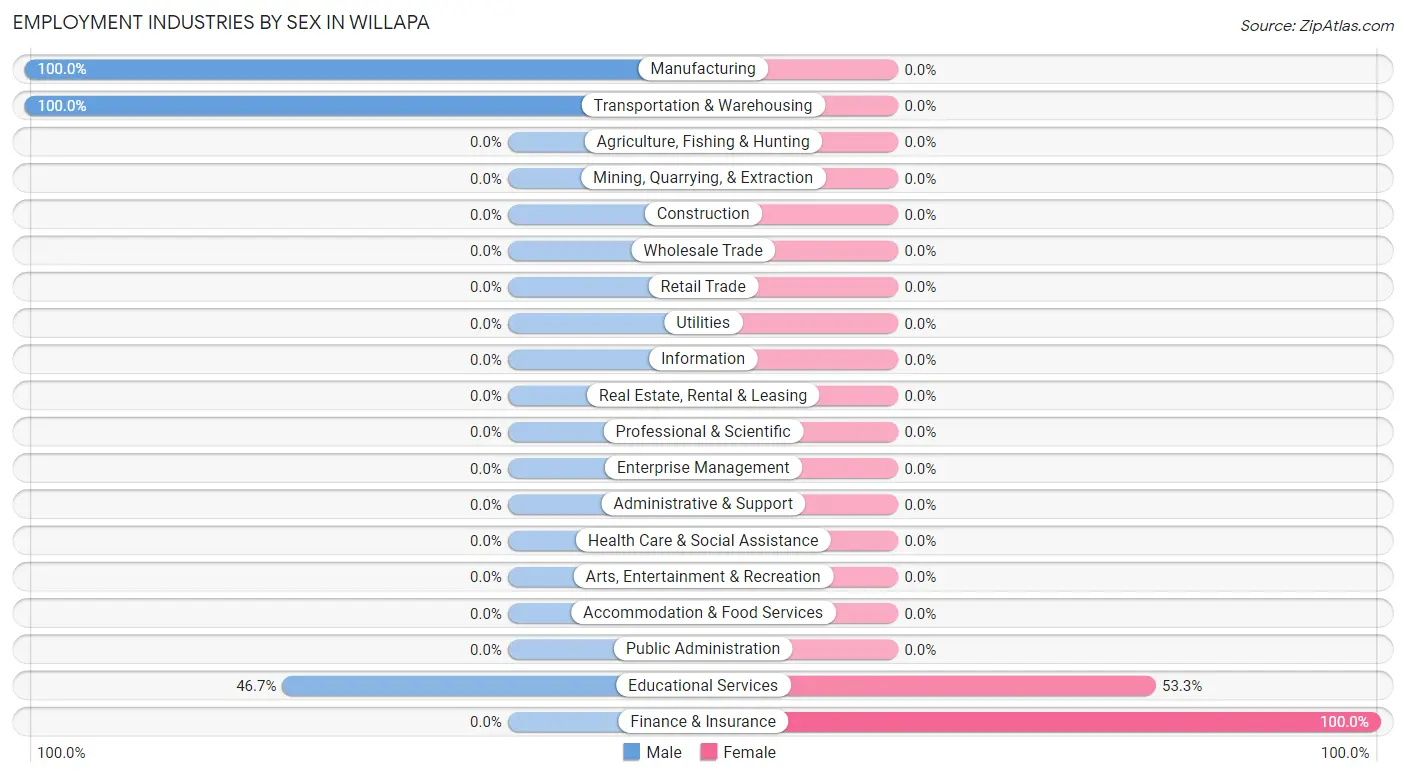
| Industry | Male | Female |
| Agriculture, Fishing & Hunting | 0 (0.0%) | 0 (0.0%) |
| Mining, Quarrying, & Extraction | 0 (0.0%) | 0 (0.0%) |
| Construction | 0 (0.0%) | 0 (0.0%) |
| Manufacturing | 29 (100.0%) | 0 (0.0%) |
| Wholesale Trade | 0 (0.0%) | 0 (0.0%) |
| Retail Trade | 0 (0.0%) | 0 (0.0%) |
| Transportation & Warehousing | 5 (100.0%) | 0 (0.0%) |
| Utilities | 0 (0.0%) | 0 (0.0%) |
| Information | 0 (0.0%) | 0 (0.0%) |
| Finance & Insurance | 0 (0.0%) | 13 (100.0%) |
| Real Estate, Rental & Leasing | 0 (0.0%) | 0 (0.0%) |
| Professional & Scientific | 0 (0.0%) | 0 (0.0%) |
| Enterprise Management | 0 (0.0%) | 0 (0.0%) |
| Administrative & Support | 0 (0.0%) | 0 (0.0%) |
| Educational Services | 7 (46.7%) | 8 (53.3%) |
| Health Care & Social Assistance | 0 (0.0%) | 0 (0.0%) |
| Arts, Entertainment & Recreation | 0 (0.0%) | 0 (0.0%) |
| Accommodation & Food Services | 0 (0.0%) | 0 (0.0%) |
| Public Administration | 0 (0.0%) | 0 (0.0%) |
| Total | 45 (63.4%) | 26 (36.6%) |
Education in Willapa
School Enrollment in Willapa
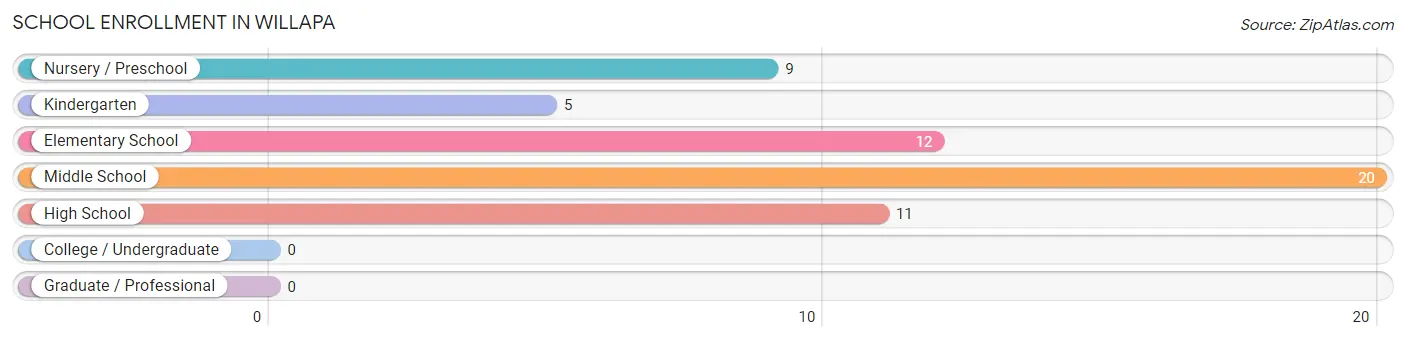
The most common levels of schooling among the 57 students in Willapa are middle school (20 | 35.1%), elementary school (12 | 21.0%), and high school (11 | 19.3%).
| School Level | # Students | % Students |
| Nursery / Preschool | 9 | 15.8% |
| Kindergarten | 5 | 8.8% |
| Elementary School | 12 | 21.0% |
| Middle School | 20 | 35.1% |
| High School | 11 | 19.3% |
| College / Undergraduate | 0 | 0.0% |
| Graduate / Professional | 0 | 0.0% |
| Total | 57 | 100.0% |
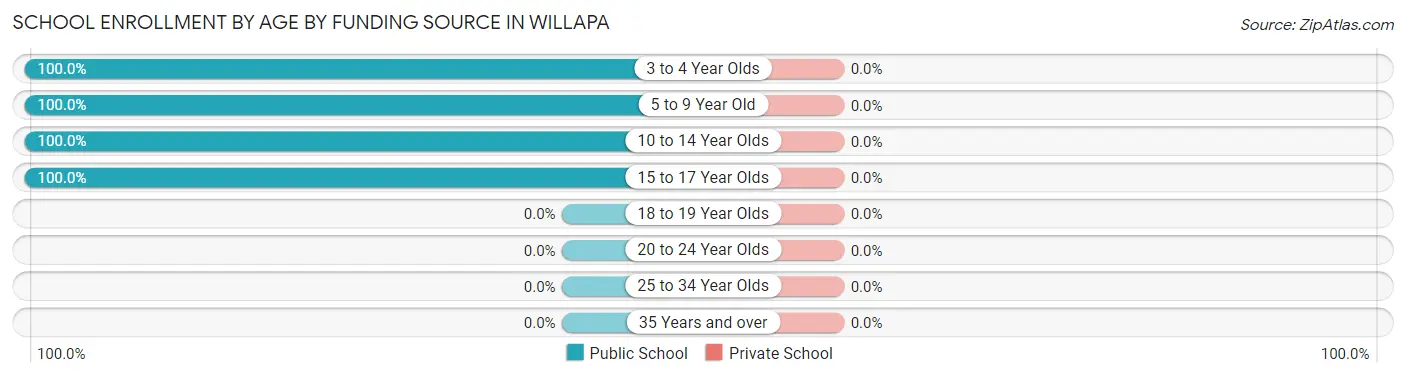
School Enrollment by Age by Funding Source in Willapa
| Age Bracket | Public School | Private School |
| 3 to 4 Year Olds | 9 (100.0%) | 0 (0.0%) |
| 5 to 9 Year Old | 17 (100.0%) | 0 (0.0%) |
| 10 to 14 Year Olds | 20 (100.0%) | 0 (0.0%) |
| 15 to 17 Year Olds | 11 (100.0%) | 0 (0.0%) |
| 18 to 19 Year Olds | 0 (0.0%) | 0 (0.0%) |
| 20 to 24 Year Olds | 0 (0.0%) | 0 (0.0%) |
| 25 to 34 Year Olds | 0 (0.0%) | 0 (0.0%) |
| 35 Years and over | 0 (0.0%) | 0 (0.0%) |
| Total | 57 (100.0%) | 0 (0.0%) |
Educational Attainment by Field of Study in Willapa
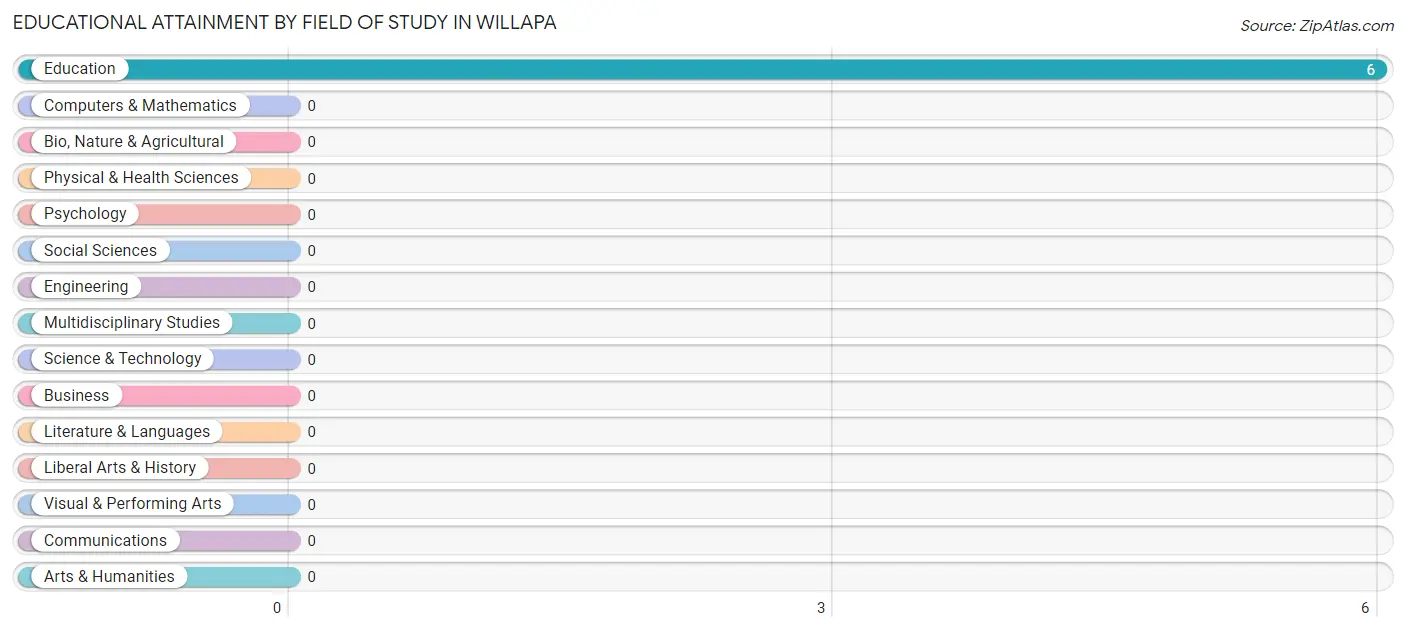
, and education (6 | 100.0%) are the most common fields of study among 6 individuals in Willapa who have obtained a bachelor's degree or higher.
| Field of Study | # Graduates | % Graduates |
| Computers & Mathematics | 0 | 0.0% |
| Bio, Nature & Agricultural | 0 | 0.0% |
| Physical & Health Sciences | 0 | 0.0% |
| Psychology | 0 | 0.0% |
| Social Sciences | 0 | 0.0% |
| Engineering | 0 | 0.0% |
| Multidisciplinary Studies | 0 | 0.0% |
| Science & Technology | 0 | 0.0% |
| Business | 0 | 0.0% |
| Education | 6 | 100.0% |
| Literature & Languages | 0 | 0.0% |
| Liberal Arts & History | 0 | 0.0% |
| Visual & Performing Arts | 0 | 0.0% |
| Communications | 0 | 0.0% |
| Arts & Humanities | 0 | 0.0% |
| Total | 6 | 100.0% |
Transportation & Commute in Willapa
Vehicle Availability by Sex in Willapa
The most prevalent vehicle ownership categories in Willapa are males with 2 vehicles (18, accounting for 40.0%) and females with 2 vehicles (5, making up 69.2%).
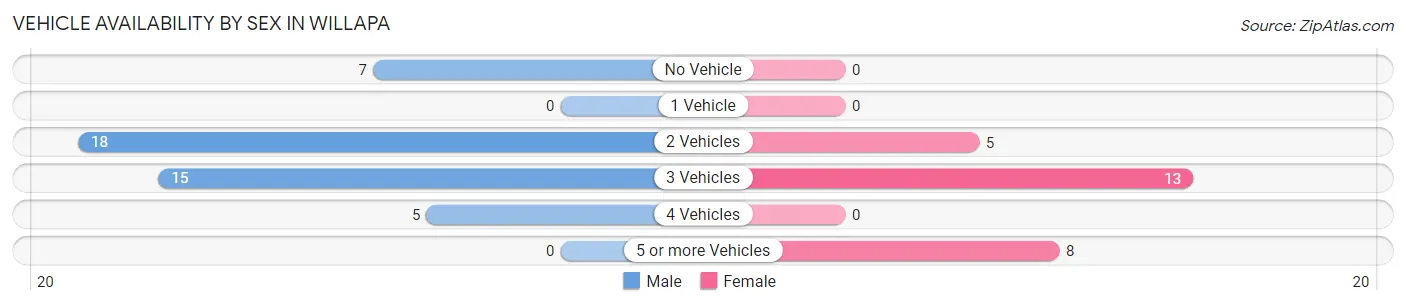
| Vehicles Available | Male | Female |
| No Vehicle | 7 (15.6%) | 0 (0.0%) |
| 1 Vehicle | 0 (0.0%) | 0 (0.0%) |
| 2 Vehicles | 18 (40.0%) | 5 (19.2%) |
| 3 Vehicles | 15 (33.3%) | 13 (50.0%) |
| 4 Vehicles | 5 (11.1%) | 0 (0.0%) |
| 5 or more Vehicles | 0 (0.0%) | 8 (30.8%) |
| Total | 45 (100.0%) | 26 (100.0%) |
Commute Time in Willapa
The most frequently occuring commute durations in Willapa are 35 to 39 minutes (18 commuters, 25.4%), less than 5 minutes (15 commuters, 21.1%), and 10 to 14 minutes (9 commuters, 12.7%).
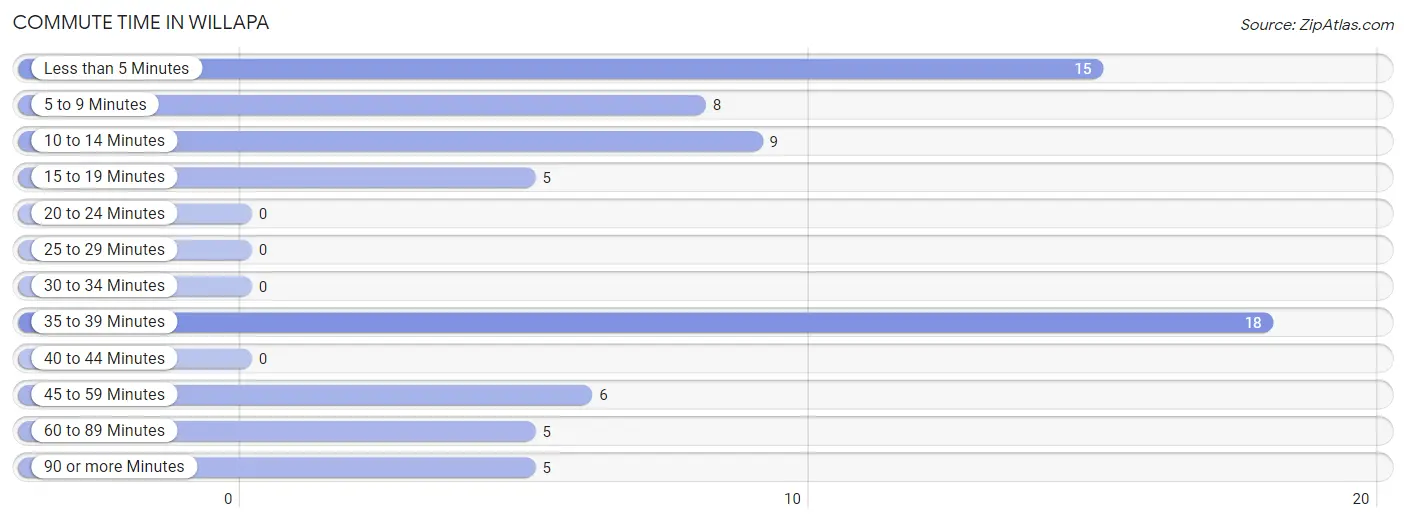
| Commute Time | # Commuters | % Commuters |
| Less than 5 Minutes | 15 | 21.1% |
| 5 to 9 Minutes | 8 | 11.3% |
| 10 to 14 Minutes | 9 | 12.7% |
| 15 to 19 Minutes | 5 | 7.0% |
| 20 to 24 Minutes | 0 | 0.0% |
| 25 to 29 Minutes | 0 | 0.0% |
| 30 to 34 Minutes | 0 | 0.0% |
| 35 to 39 Minutes | 18 | 25.4% |
| 40 to 44 Minutes | 0 | 0.0% |
| 45 to 59 Minutes | 6 | 8.5% |
| 60 to 89 Minutes | 5 | 7.0% |
| 90 or more Minutes | 5 | 7.0% |
Commute Time by Sex in Willapa
The most common commute times in Willapa are 35 to 39 minutes (18 commuters, 40.0%) for males and less than 5 minutes (8 commuters, 30.8%) for females.
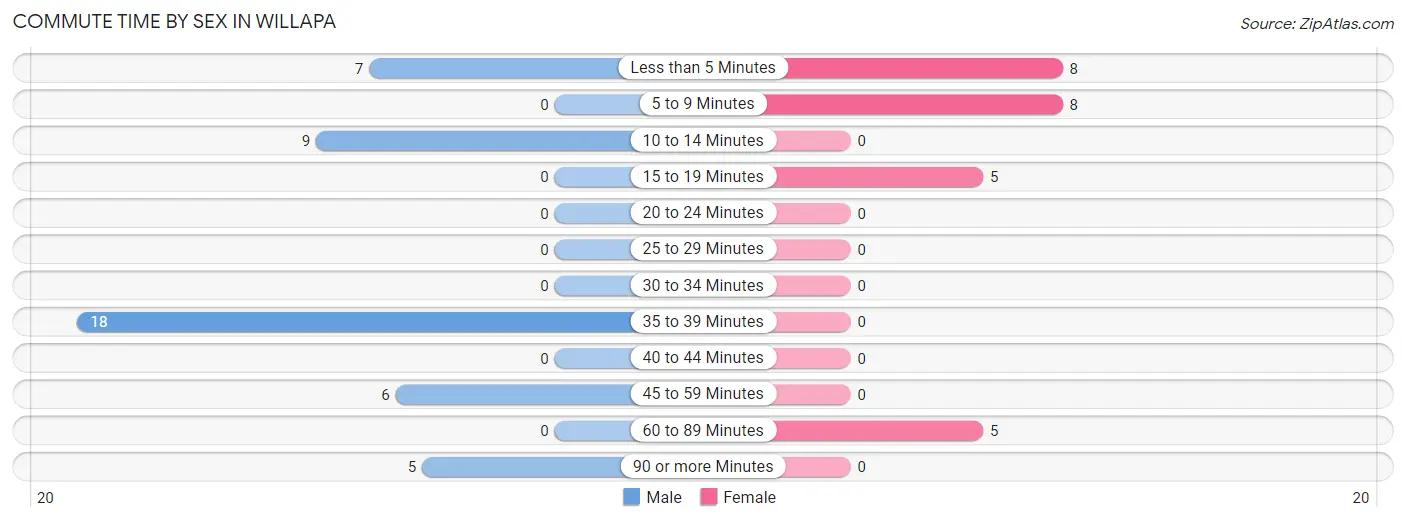
| Commute Time | Male | Female |
| Less than 5 Minutes | 7 (15.6%) | 8 (30.8%) |
| 5 to 9 Minutes | 0 (0.0%) | 8 (30.8%) |
| 10 to 14 Minutes | 9 (20.0%) | 0 (0.0%) |
| 15 to 19 Minutes | 0 (0.0%) | 5 (19.2%) |
| 20 to 24 Minutes | 0 (0.0%) | 0 (0.0%) |
| 25 to 29 Minutes | 0 (0.0%) | 0 (0.0%) |
| 30 to 34 Minutes | 0 (0.0%) | 0 (0.0%) |
| 35 to 39 Minutes | 18 (40.0%) | 0 (0.0%) |
| 40 to 44 Minutes | 0 (0.0%) | 0 (0.0%) |
| 45 to 59 Minutes | 6 (13.3%) | 0 (0.0%) |
| 60 to 89 Minutes | 0 (0.0%) | 5 (19.2%) |
| 90 or more Minutes | 5 (11.1%) | 0 (0.0%) |
Time of Departure to Work by Sex in Willapa
The most frequent times of departure to work in Willapa are 12:00 AM to 4:59 AM (23, 51.1%) for males and 8:00 AM to 8:29 AM (13, 50.0%) for females.
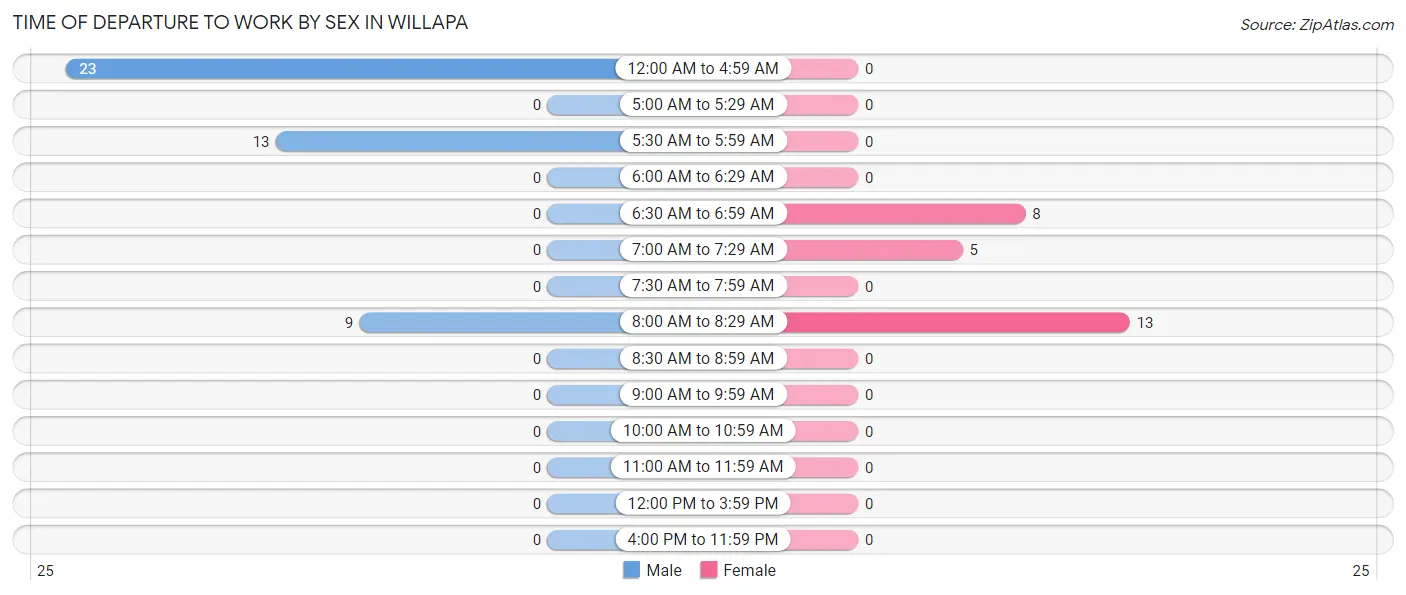
| Time of Departure | Male | Female |
| 12:00 AM to 4:59 AM | 23 (51.1%) | 0 (0.0%) |
| 5:00 AM to 5:29 AM | 0 (0.0%) | 0 (0.0%) |
| 5:30 AM to 5:59 AM | 13 (28.9%) | 0 (0.0%) |
| 6:00 AM to 6:29 AM | 0 (0.0%) | 0 (0.0%) |
| 6:30 AM to 6:59 AM | 0 (0.0%) | 8 (30.8%) |
| 7:00 AM to 7:29 AM | 0 (0.0%) | 5 (19.2%) |
| 7:30 AM to 7:59 AM | 0 (0.0%) | 0 (0.0%) |
| 8:00 AM to 8:29 AM | 9 (20.0%) | 13 (50.0%) |
| 8:30 AM to 8:59 AM | 0 (0.0%) | 0 (0.0%) |
| 9:00 AM to 9:59 AM | 0 (0.0%) | 0 (0.0%) |
| 10:00 AM to 10:59 AM | 0 (0.0%) | 0 (0.0%) |
| 11:00 AM to 11:59 AM | 0 (0.0%) | 0 (0.0%) |
| 12:00 PM to 3:59 PM | 0 (0.0%) | 0 (0.0%) |
| 4:00 PM to 11:59 PM | 0 (0.0%) | 0 (0.0%) |
| Total | 45 (100.0%) | 26 (100.0%) |
Housing Occupancy in Willapa
Occupancy by Ownership in Willapa
Of the total 58 dwellings in Willapa, owner-occupied units account for 47 (81.0%), while renter-occupied units make up 11 (19.0%).
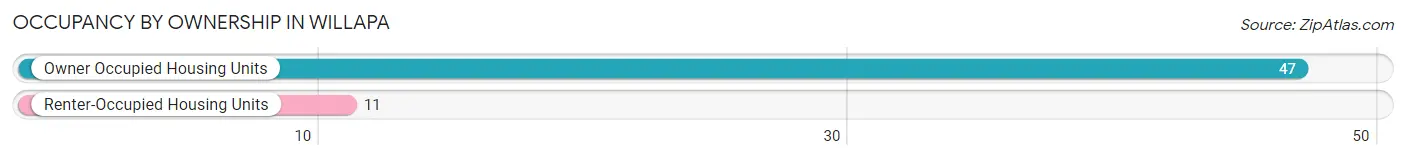
| Occupancy | # Housing Units | % Housing Units |
| Owner Occupied Housing Units | 47 | 81.0% |
| Renter-Occupied Housing Units | 11 | 19.0% |
| Total Occupied Housing Units | 58 | 100.0% |
Occupancy by Household Size in Willapa
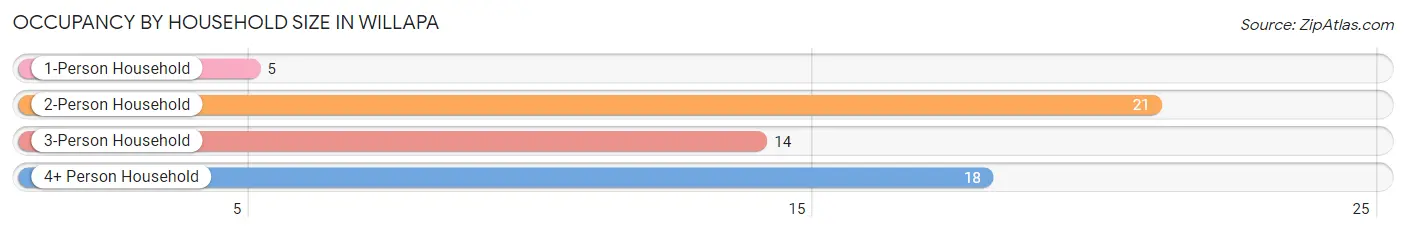
| Household Size | # Housing Units | % Housing Units |
| 1-Person Household | 5 | 8.6% |
| 2-Person Household | 21 | 36.2% |
| 3-Person Household | 14 | 24.1% |
| 4+ Person Household | 18 | 31.0% |
| Total Housing Units | 58 | 100.0% |
Occupancy by Ownership by Household Size in Willapa
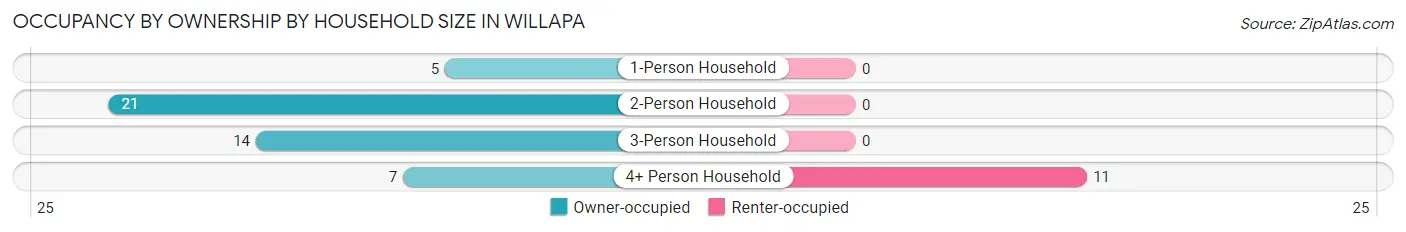
| Household Size | Owner-occupied | Renter-occupied |
| 1-Person Household | 5 (100.0%) | 0 (0.0%) |
| 2-Person Household | 21 (100.0%) | 0 (0.0%) |
| 3-Person Household | 14 (100.0%) | 0 (0.0%) |
| 4+ Person Household | 7 (38.9%) | 11 (61.1%) |
| Total Housing Units | 47 (81.0%) | 11 (19.0%) |
Occupancy by Educational Attainment in Willapa
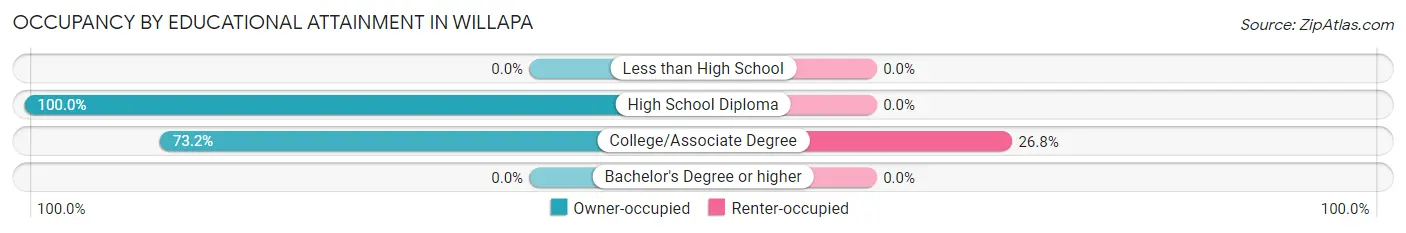
| Household Size | Owner-occupied | Renter-occupied |
| Less than High School | 0 (0.0%) | 0 (0.0%) |
| High School Diploma | 17 (100.0%) | 0 (0.0%) |
| College/Associate Degree | 30 (73.2%) | 11 (26.8%) |
| Bachelor's Degree or higher | 0 (0.0%) | 0 (0.0%) |
Occupancy by Age of Householder in Willapa
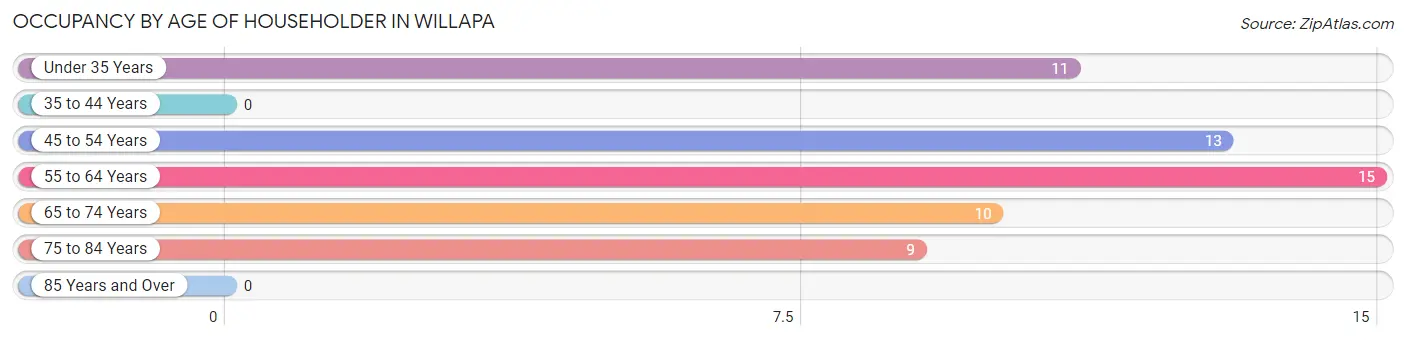
| Age Bracket | # Households | % Households |
| Under 35 Years | 11 | 19.0% |
| 35 to 44 Years | 0 | 0.0% |
| 45 to 54 Years | 13 | 22.4% |
| 55 to 64 Years | 15 | 25.9% |
| 65 to 74 Years | 10 | 17.2% |
| 75 to 84 Years | 9 | 15.5% |
| 85 Years and Over | 0 | 0.0% |
| Total | 58 | 100.0% |
Housing Finances in Willapa
Median Income by Occupancy in Willapa
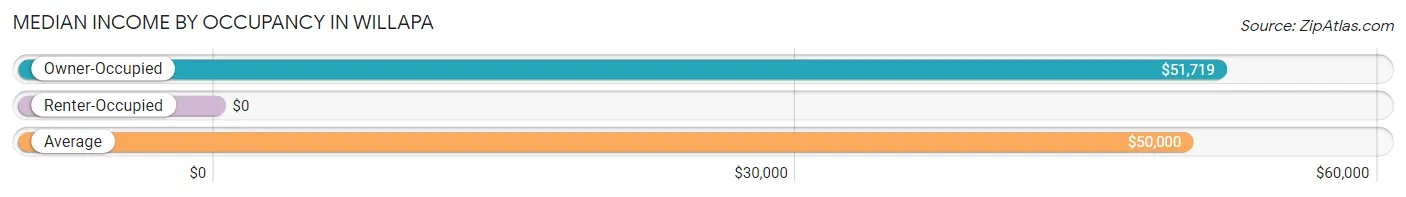
| Occupancy Type | # Households | Median Income |
| Owner-Occupied | 47 (81.0%) | $51,719 |
| Renter-Occupied | 11 (19.0%) | $0 |
| Average | 58 (100.0%) | $50,000 |
Occupancy by Householder Income Bracket in Willapa
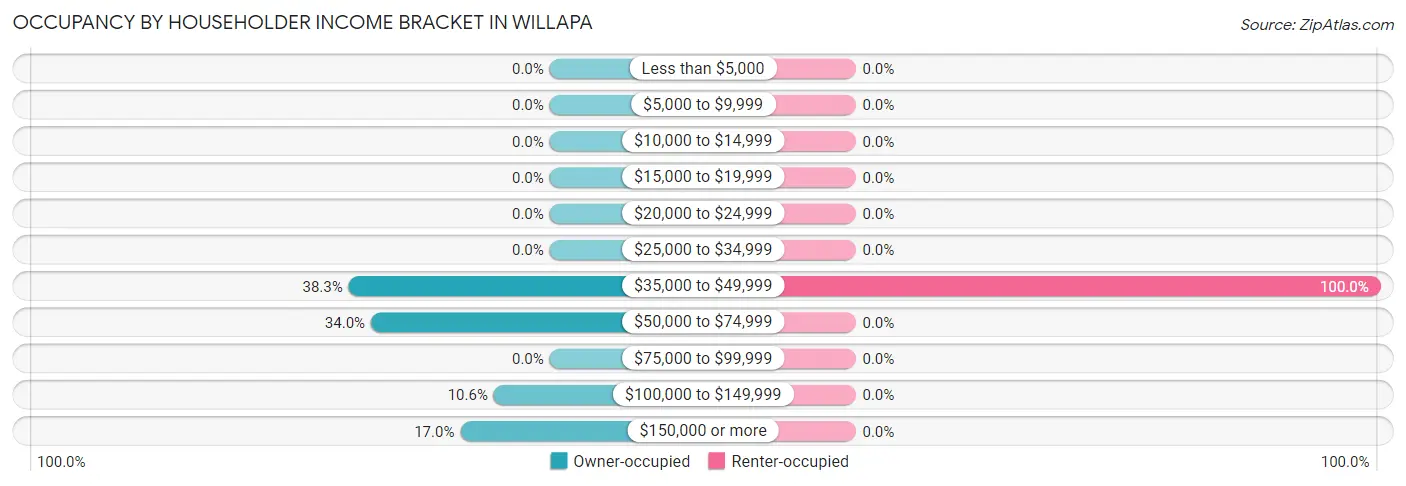
| Income Bracket | Owner-occupied | Renter-occupied |
| Less than $5,000 | 0 (0.0%) | 0 (0.0%) |
| $5,000 to $9,999 | 0 (0.0%) | 0 (0.0%) |
| $10,000 to $14,999 | 0 (0.0%) | 0 (0.0%) |
| $15,000 to $19,999 | 0 (0.0%) | 0 (0.0%) |
| $20,000 to $24,999 | 0 (0.0%) | 0 (0.0%) |
| $25,000 to $34,999 | 0 (0.0%) | 0 (0.0%) |
| $35,000 to $49,999 | 18 (38.3%) | 11 (100.0%) |
| $50,000 to $74,999 | 16 (34.0%) | 0 (0.0%) |
| $75,000 to $99,999 | 0 (0.0%) | 0 (0.0%) |
| $100,000 to $149,999 | 5 (10.6%) | 0 (0.0%) |
| $150,000 or more | 8 (17.0%) | 0 (0.0%) |
| Total | 47 (100.0%) | 11 (100.0%) |
Monthly Housing Cost Tiers in Willapa
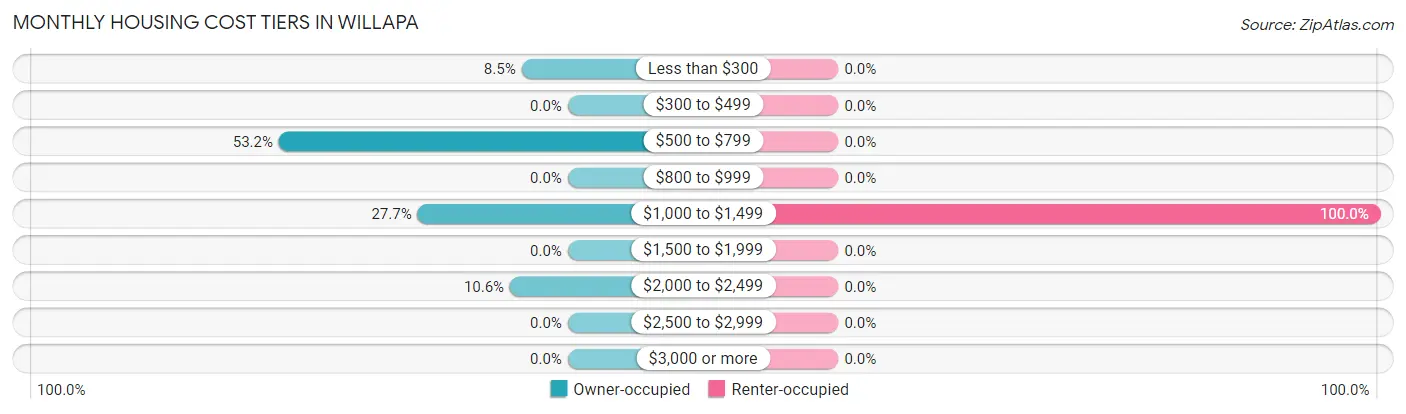
| Monthly Cost | Owner-occupied | Renter-occupied |
| Less than $300 | 4 (8.5%) | 0 (0.0%) |
| $300 to $499 | 0 (0.0%) | 0 (0.0%) |
| $500 to $799 | 25 (53.2%) | 0 (0.0%) |
| $800 to $999 | 0 (0.0%) | 0 (0.0%) |
| $1,000 to $1,499 | 13 (27.7%) | 11 (100.0%) |
| $1,500 to $1,999 | 0 (0.0%) | 0 (0.0%) |
| $2,000 to $2,499 | 5 (10.6%) | 0 (0.0%) |
| $2,500 to $2,999 | 0 (0.0%) | 0 (0.0%) |
| $3,000 or more | 0 (0.0%) | 0 (0.0%) |
| Total | 47 (100.0%) | 11 (100.0%) |
Physical Housing Characteristics in Willapa
Housing Structures in Willapa
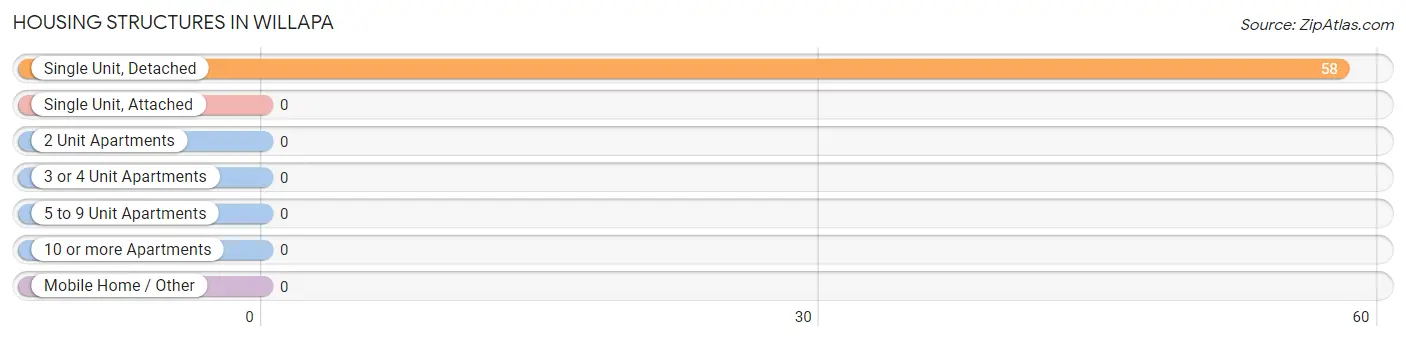
| Structure Type | # Housing Units | % Housing Units |
| Single Unit, Detached | 58 | 100.0% |
| Single Unit, Attached | 0 | 0.0% |
| 2 Unit Apartments | 0 | 0.0% |
| 3 or 4 Unit Apartments | 0 | 0.0% |
| 5 to 9 Unit Apartments | 0 | 0.0% |
| 10 or more Apartments | 0 | 0.0% |
| Mobile Home / Other | 0 | 0.0% |
| Total | 58 | 100.0% |
Housing Structures by Occupancy in Willapa
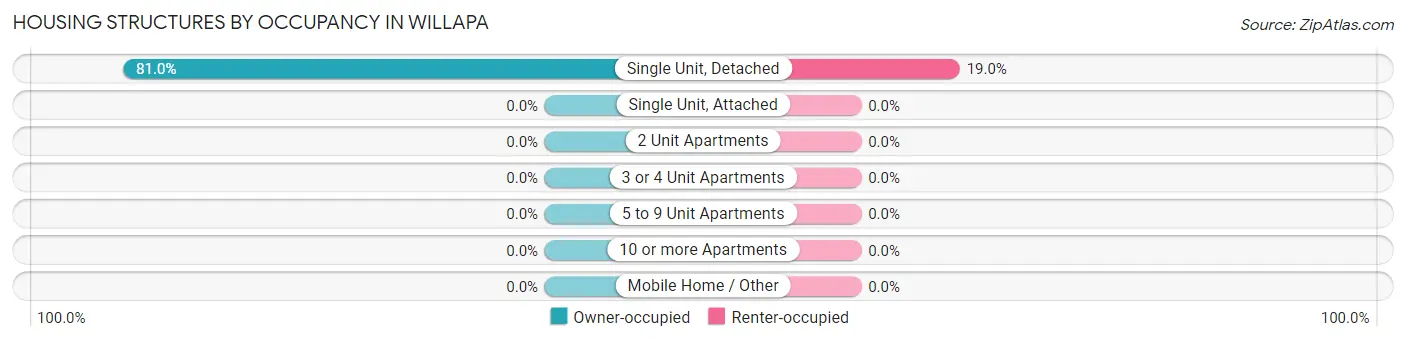
| Structure Type | Owner-occupied | Renter-occupied |
| Single Unit, Detached | 47 (81.0%) | 11 (19.0%) |
| Single Unit, Attached | 0 (0.0%) | 0 (0.0%) |
| 2 Unit Apartments | 0 (0.0%) | 0 (0.0%) |
| 3 or 4 Unit Apartments | 0 (0.0%) | 0 (0.0%) |
| 5 to 9 Unit Apartments | 0 (0.0%) | 0 (0.0%) |
| 10 or more Apartments | 0 (0.0%) | 0 (0.0%) |
| Mobile Home / Other | 0 (0.0%) | 0 (0.0%) |
| Total | 47 (81.0%) | 11 (19.0%) |
Housing Structures by Number of Rooms in Willapa
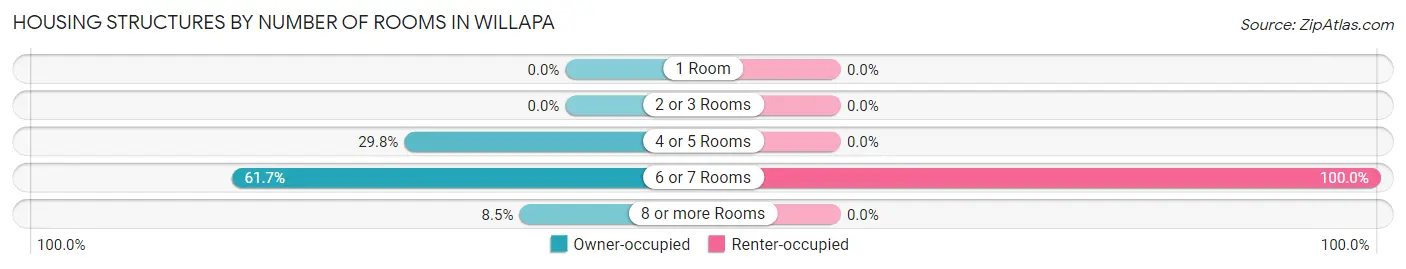
| Number of Rooms | Owner-occupied | Renter-occupied |
| 1 Room | 0 (0.0%) | 0 (0.0%) |
| 2 or 3 Rooms | 0 (0.0%) | 0 (0.0%) |
| 4 or 5 Rooms | 14 (29.8%) | 0 (0.0%) |
| 6 or 7 Rooms | 29 (61.7%) | 11 (100.0%) |
| 8 or more Rooms | 4 (8.5%) | 0 (0.0%) |
| Total | 47 (100.0%) | 11 (100.0%) |
Housing Structure by Heating Type in Willapa
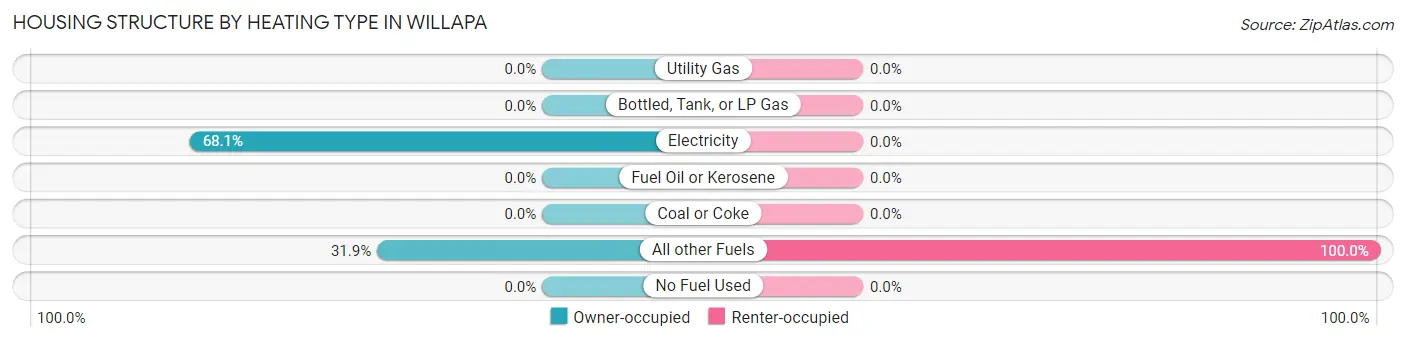
| Heating Type | Owner-occupied | Renter-occupied |
| Utility Gas | 0 (0.0%) | 0 (0.0%) |
| Bottled, Tank, or LP Gas | 0 (0.0%) | 0 (0.0%) |
| Electricity | 32 (68.1%) | 0 (0.0%) |
| Fuel Oil or Kerosene | 0 (0.0%) | 0 (0.0%) |
| Coal or Coke | 0 (0.0%) | 0 (0.0%) |
| All other Fuels | 15 (31.9%) | 11 (100.0%) |
| No Fuel Used | 0 (0.0%) | 0 (0.0%) |
| Total | 47 (100.0%) | 11 (100.0%) |
Household Vehicle Usage in Willapa
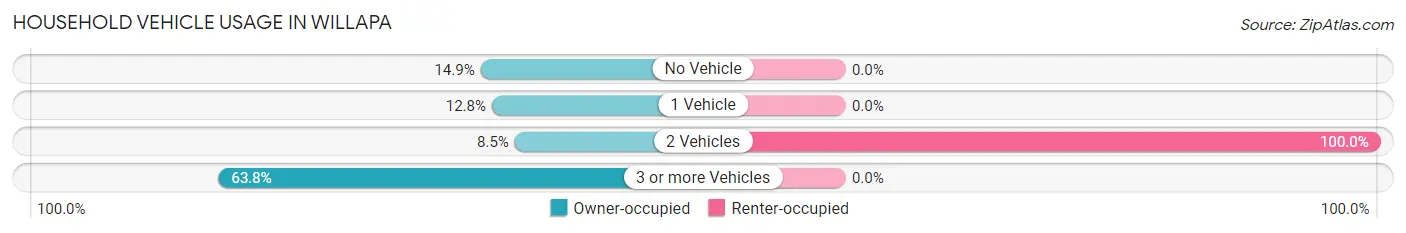
| Vehicles per Household | Owner-occupied | Renter-occupied |
| No Vehicle | 7 (14.9%) | 0 (0.0%) |
| 1 Vehicle | 6 (12.8%) | 0 (0.0%) |
| 2 Vehicles | 4 (8.5%) | 11 (100.0%) |
| 3 or more Vehicles | 30 (63.8%) | 0 (0.0%) |
| Total | 47 (100.0%) | 11 (100.0%) |
Real Estate & Mortgages in Willapa
Real Estate and Mortgage Overview in Willapa
| Characteristic | Without Mortgage | With Mortgage |
| Housing Units | 23 | 24 |
| Median Property Value | $252,100 | $161,500 |
| Median Household Income | - | - |
| Monthly Housing Costs | $623 | $0 |
| Real Estate Taxes | $2,042 | $0 |
Property Value by Mortgage Status in Willapa
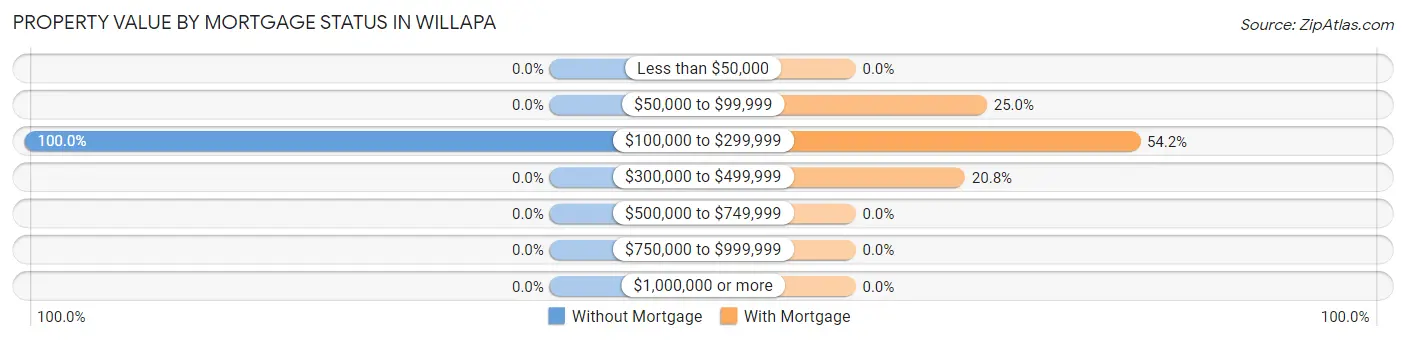
| Property Value | Without Mortgage | With Mortgage |
| Less than $50,000 | 0 (0.0%) | 0 (0.0%) |
| $50,000 to $99,999 | 0 (0.0%) | 6 (25.0%) |
| $100,000 to $299,999 | 23 (100.0%) | 13 (54.2%) |
| $300,000 to $499,999 | 0 (0.0%) | 5 (20.8%) |
| $500,000 to $749,999 | 0 (0.0%) | 0 (0.0%) |
| $750,000 to $999,999 | 0 (0.0%) | 0 (0.0%) |
| $1,000,000 or more | 0 (0.0%) | 0 (0.0%) |
| Total | 23 (100.0%) | 24 (100.0%) |
Household Income by Mortgage Status in Willapa
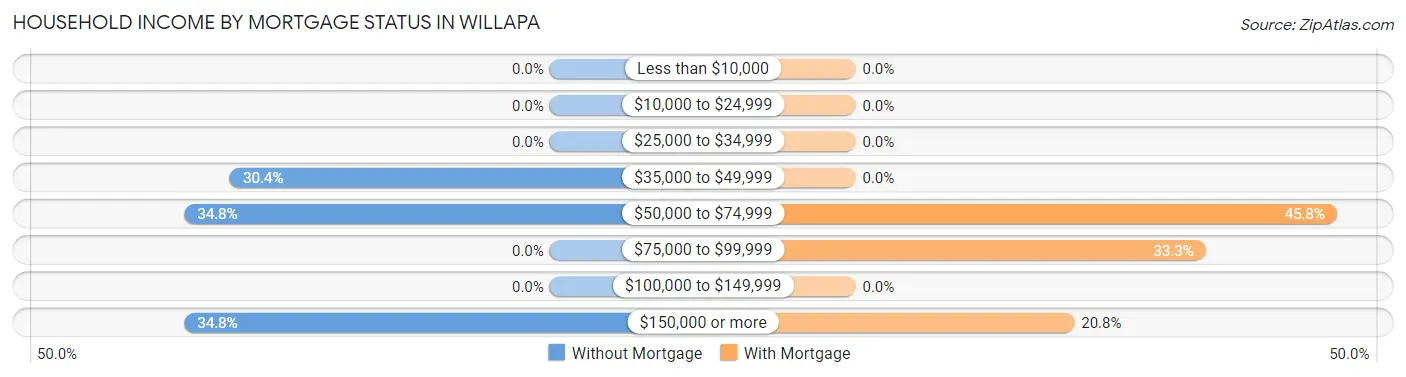
| Household Income | Without Mortgage | With Mortgage |
| Less than $10,000 | 0 (0.0%) | 0 (0.0%) |
| $10,000 to $24,999 | 0 (0.0%) | 0 (0.0%) |
| $25,000 to $34,999 | 0 (0.0%) | 0 (0.0%) |
| $35,000 to $49,999 | 7 (30.4%) | 0 (0.0%) |
| $50,000 to $74,999 | 8 (34.8%) | 11 (45.8%) |
| $75,000 to $99,999 | 0 (0.0%) | 8 (33.3%) |
| $100,000 to $149,999 | 0 (0.0%) | 0 (0.0%) |
| $150,000 or more | 8 (34.8%) | 5 (20.8%) |
| Total | 23 (100.0%) | 24 (100.0%) |
Property Value to Household Income Ratio in Willapa
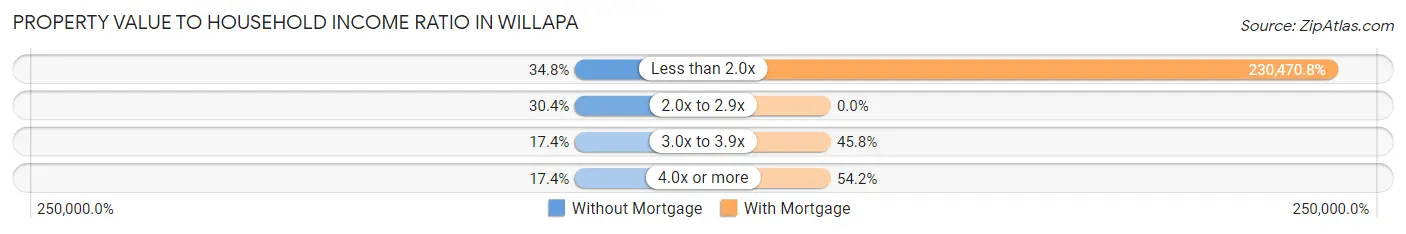
| Value-to-Income Ratio | Without Mortgage | With Mortgage |
| Less than 2.0x | 8 (34.8%) | 55,313 (230,470.8%) |
| 2.0x to 2.9x | 7 (30.4%) | 0 (0.0%) |
| 3.0x to 3.9x | 4 (17.4%) | 11 (45.8%) |
| 4.0x or more | 4 (17.4%) | 13 (54.2%) |
| Total | 23 (100.0%) | 24 (100.0%) |
Real Estate Taxes by Mortgage Status in Willapa
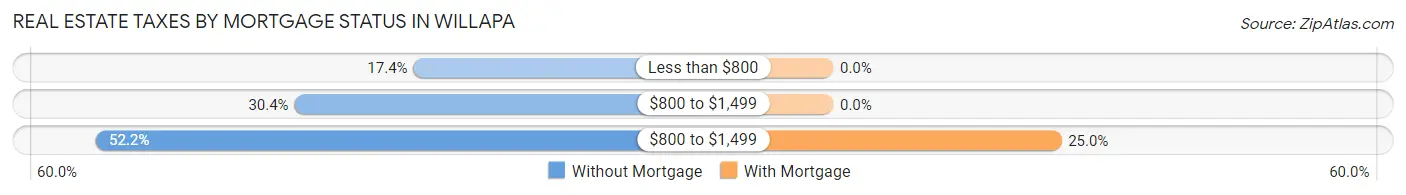
| Property Taxes | Without Mortgage | With Mortgage |
| Less than $800 | 4 (17.4%) | 0 (0.0%) |
| $800 to $1,499 | 7 (30.4%) | 0 (0.0%) |
| $800 to $1,499 | 12 (52.2%) | 6 (25.0%) |
| Total | 23 (100.0%) | 24 (100.0%) |
Health & Disability in Willapa
Health Insurance Coverage by Age in Willapa
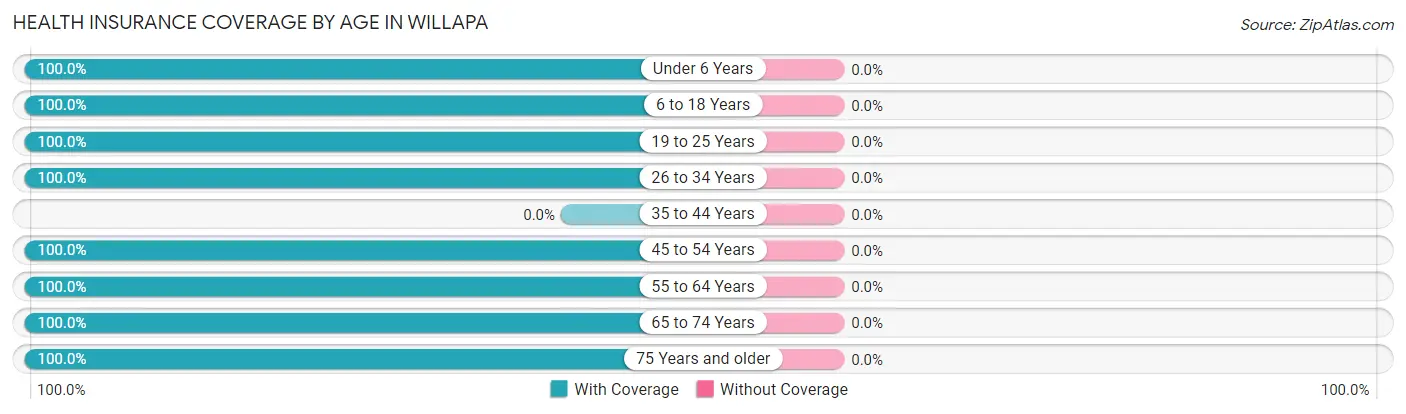
| Age Bracket | With Coverage | Without Coverage |
| Under 6 Years | 18 (100.0%) | 0 (0.0%) |
| 6 to 18 Years | 43 (100.0%) | 0 (0.0%) |
| 19 to 25 Years | 5 (100.0%) | 0 (0.0%) |
| 26 to 34 Years | 29 (100.0%) | 0 (0.0%) |
| 35 to 44 Years | 0 (0.0%) | 0 (0.0%) |
| 45 to 54 Years | 25 (100.0%) | 0 (0.0%) |
| 55 to 64 Years | 21 (100.0%) | 0 (0.0%) |
| 65 to 74 Years | 24 (100.0%) | 0 (0.0%) |
| 75 Years and older | 13 (100.0%) | 0 (0.0%) |
| Total | 178 (100.0%) | 0 (0.0%) |
Health Insurance Coverage by Citizenship Status in Willapa
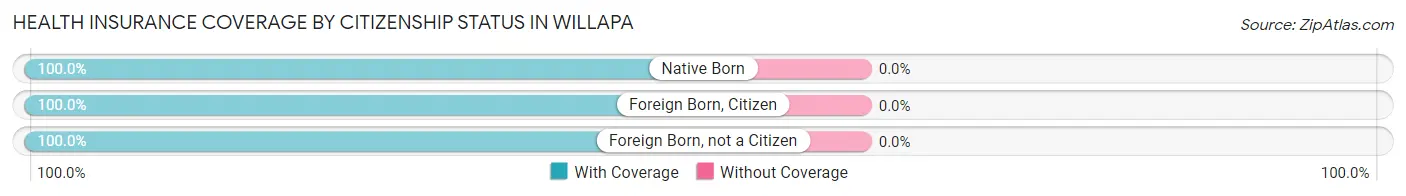
| Citizenship Status | With Coverage | Without Coverage |
| Native Born | 18 (100.0%) | 0 (0.0%) |
| Foreign Born, Citizen | 43 (100.0%) | 0 (0.0%) |
| Foreign Born, not a Citizen | 5 (100.0%) | 0 (0.0%) |
Health Insurance Coverage by Household Income in Willapa
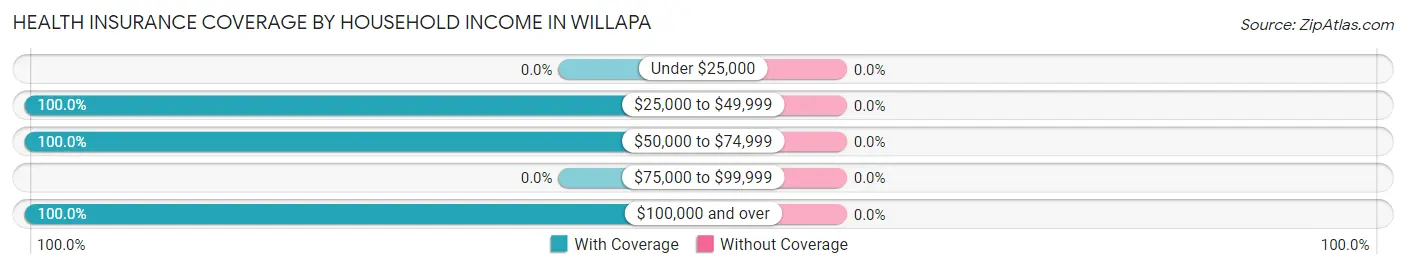
| Household Income | With Coverage | Without Coverage |
| Under $25,000 | 0 (0.0%) | 0 (0.0%) |
| $25,000 to $49,999 | 109 (100.0%) | 0 (0.0%) |
| $50,000 to $74,999 | 41 (100.0%) | 0 (0.0%) |
| $75,000 to $99,999 | 0 (0.0%) | 0 (0.0%) |
| $100,000 and over | 28 (100.0%) | 0 (0.0%) |
Public vs Private Health Insurance Coverage by Age in Willapa
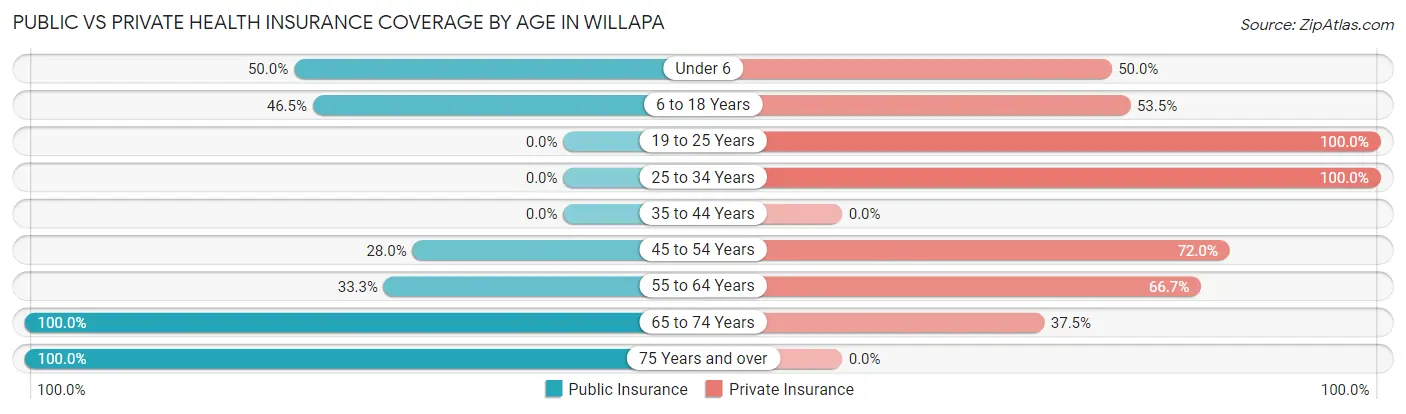
| Age Bracket | Public Insurance | Private Insurance |
| Under 6 | 9 (50.0%) | 9 (50.0%) |
| 6 to 18 Years | 20 (46.5%) | 23 (53.5%) |
| 19 to 25 Years | 0 (0.0%) | 5 (100.0%) |
| 25 to 34 Years | 0 (0.0%) | 29 (100.0%) |
| 35 to 44 Years | 0 (0.0%) | 0 (0.0%) |
| 45 to 54 Years | 7 (28.0%) | 18 (72.0%) |
| 55 to 64 Years | 7 (33.3%) | 14 (66.7%) |
| 65 to 74 Years | 24 (100.0%) | 9 (37.5%) |
| 75 Years and over | 13 (100.0%) | 0 (0.0%) |
| Total | 80 (44.9%) | 107 (60.1%) |
Disability Status by Sex by Age in Willapa
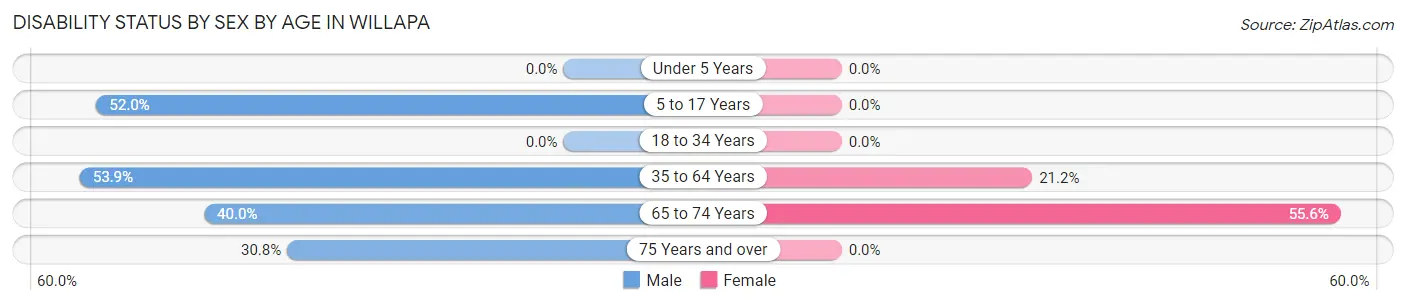
| Age Bracket | Male | Female |
| Under 5 Years | 0 (0.0%) | 0 (0.0%) |
| 5 to 17 Years | 13 (52.0%) | 0 (0.0%) |
| 18 to 34 Years | 0 (0.0%) | 0 (0.0%) |
| 35 to 64 Years | 7 (53.8%) | 7 (21.2%) |
| 65 to 74 Years | 6 (40.0%) | 5 (55.6%) |
| 75 Years and over | 4 (30.8%) | 0 (0.0%) |
Disability Class by Sex by Age in Willapa
Disability Class: Hearing Difficulty
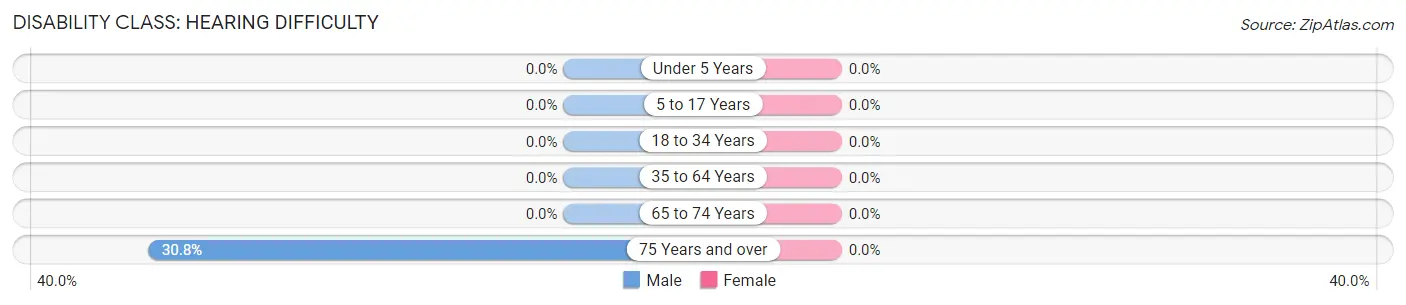
| Age Bracket | Male | Female |
| Under 5 Years | 0 (0.0%) | 0 (0.0%) |
| 5 to 17 Years | 0 (0.0%) | 0 (0.0%) |
| 18 to 34 Years | 0 (0.0%) | 0 (0.0%) |
| 35 to 64 Years | 0 (0.0%) | 0 (0.0%) |
| 65 to 74 Years | 0 (0.0%) | 0 (0.0%) |
| 75 Years and over | 4 (30.8%) | 0 (0.0%) |
Disability Class: Vision Difficulty
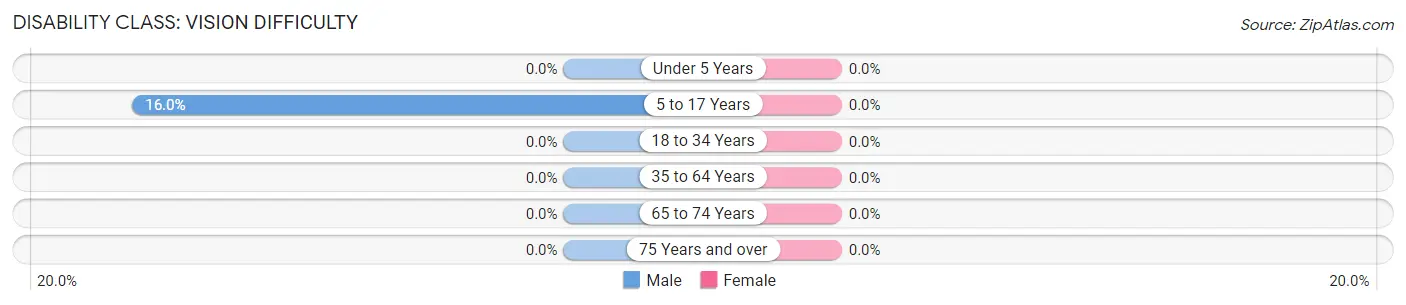
| Age Bracket | Male | Female |
| Under 5 Years | 0 (0.0%) | 0 (0.0%) |
| 5 to 17 Years | 4 (16.0%) | 0 (0.0%) |
| 18 to 34 Years | 0 (0.0%) | 0 (0.0%) |
| 35 to 64 Years | 0 (0.0%) | 0 (0.0%) |
| 65 to 74 Years | 0 (0.0%) | 0 (0.0%) |
| 75 Years and over | 0 (0.0%) | 0 (0.0%) |
Disability Class: Cognitive Difficulty
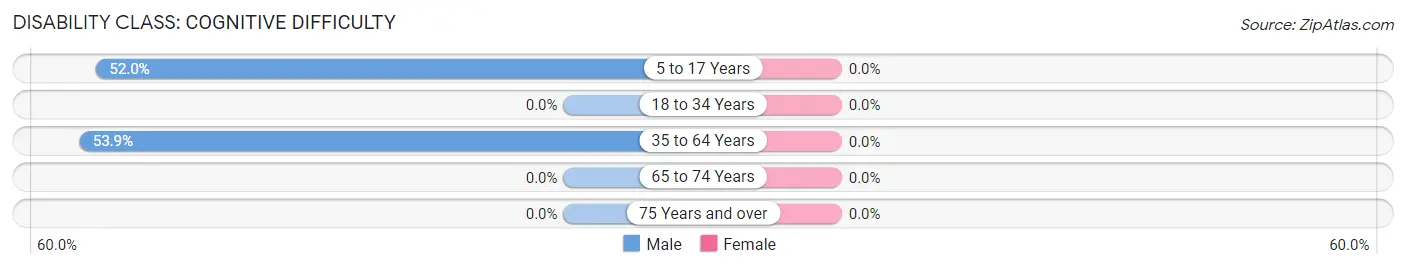
| Age Bracket | Male | Female |
| 5 to 17 Years | 13 (52.0%) | 0 (0.0%) |
| 18 to 34 Years | 0 (0.0%) | 0 (0.0%) |
| 35 to 64 Years | 7 (53.8%) | 0 (0.0%) |
| 65 to 74 Years | 0 (0.0%) | 0 (0.0%) |
| 75 Years and over | 0 (0.0%) | 0 (0.0%) |
Disability Class: Ambulatory Difficulty
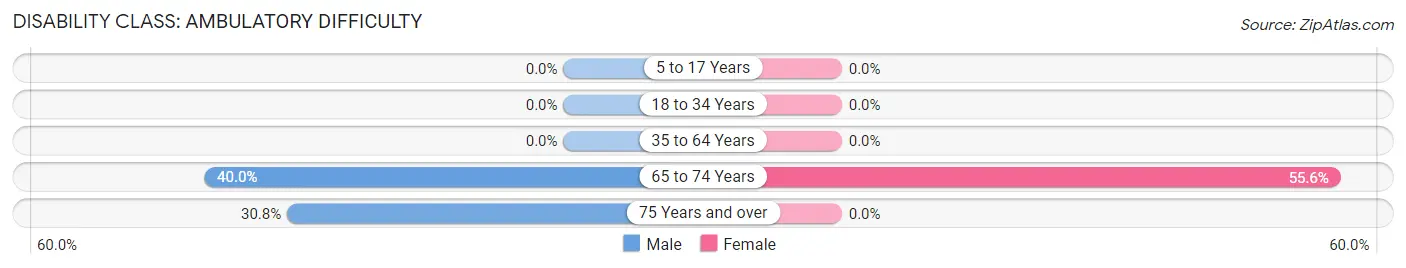
| Age Bracket | Male | Female |
| 5 to 17 Years | 0 (0.0%) | 0 (0.0%) |
| 18 to 34 Years | 0 (0.0%) | 0 (0.0%) |
| 35 to 64 Years | 0 (0.0%) | 0 (0.0%) |
| 65 to 74 Years | 6 (40.0%) | 5 (55.6%) |
| 75 Years and over | 4 (30.8%) | 0 (0.0%) |
Disability Class: Self-Care Difficulty
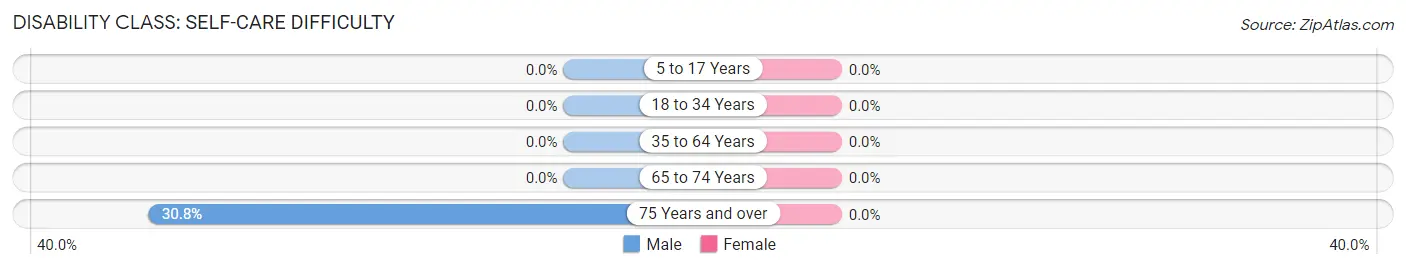
| Age Bracket | Male | Female |
| 5 to 17 Years | 0 (0.0%) | 0 (0.0%) |
| 18 to 34 Years | 0 (0.0%) | 0 (0.0%) |
| 35 to 64 Years | 0 (0.0%) | 0 (0.0%) |
| 65 to 74 Years | 0 (0.0%) | 0 (0.0%) |
| 75 Years and over | 4 (30.8%) | 0 (0.0%) |
Technology Access in Willapa
Computing Device Access in Willapa
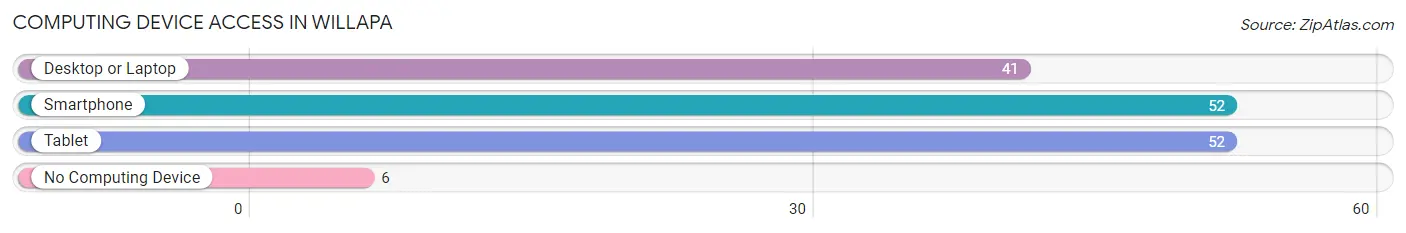
| Device Type | # Households | % Households |
| Desktop or Laptop | 41 | 70.7% |
| Smartphone | 52 | 89.7% |
| Tablet | 52 | 89.7% |
| No Computing Device | 6 | 10.3% |
| Total | 58 | 100.0% |
Internet Access in Willapa
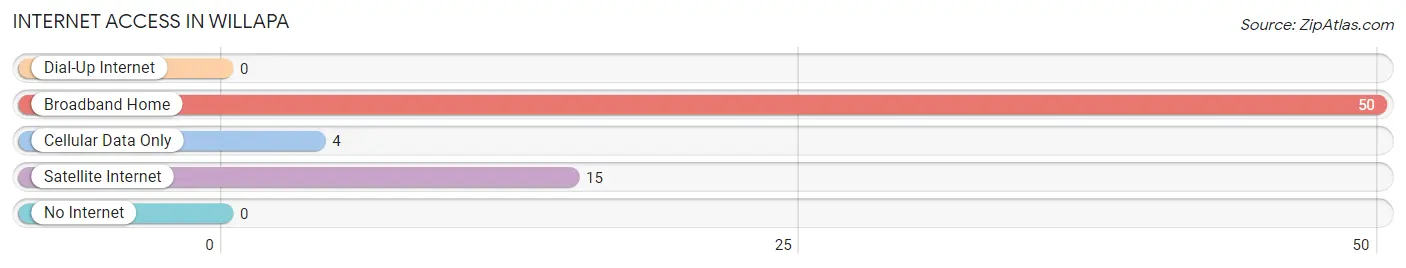
| Internet Type | # Households | % Households |
| Dial-Up Internet | 0 | 0.0% |
| Broadband Home | 50 | 86.2% |
| Cellular Data Only | 4 | 6.9% |
| Satellite Internet | 15 | 25.9% |
| No Internet | 0 | 0.0% |
| Total | 58 | 100.0% |
Willapa Summary
Willapa, Washington is a small town located in Pacific County, Washington. It is situated on the Willapa River, which is a tributary of the Columbia River. The town is located about 20 miles south of the city of Long Beach, Washington, and is part of the Long Beach Peninsula. The population of Willapa was 1,093 at the 2010 census.
History
The area that is now Willapa was first inhabited by the Chinook Indians, who lived in the area for thousands of years before the arrival of European settlers. The first European settlers arrived in the area in the late 1800s, and the town of Willapa was officially established in 1891. The town was named after the Willapa River, which was named by the Chinook Indians.
The town of Willapa was originally a logging and fishing town, and the economy was largely based on these industries. In the early 1900s, the town was home to several sawmills and canneries, and the population of the town grew rapidly. In the 1920s, the town was connected to the rest of the state by the Pacific Highway, which allowed for increased trade and commerce.
In the 1950s, the town began to decline as the logging and fishing industries declined. The population of the town decreased, and many of the businesses closed. In the 1970s, the town began to experience a resurgence as the tourism industry began to grow. The town is now a popular destination for tourists, and the economy is largely based on tourism and recreation.
Geography
Willapa is located in Pacific County, Washington, and is situated on the Willapa River. The town is located about 20 miles south of the city of Long Beach, Washington, and is part of the Long Beach Peninsula. The town is surrounded by forests and mountains, and is located near the Pacific Ocean.
The climate in Willapa is mild and temperate, with warm summers and cool winters. The average annual temperature is around 50 degrees Fahrenheit, and the average annual precipitation is around 40 inches.
Economy
The economy of Willapa is largely based on tourism and recreation. The town is a popular destination for tourists, and there are several hotels, restaurants, and other businesses catering to tourists. The town is also home to several marinas, which provide access to the Willapa River and the Pacific Ocean.
The town is also home to several small businesses, including a grocery store, a hardware store, and a few other retail stores. The town is also home to a few manufacturing companies, which produce wood products and other goods.
Demographics
As of the 2010 census, the population of Willapa was 1,093. The racial makeup of the town was 94.3% White, 0.7% African American, 0.7% Native American, 0.7% Asian, 0.3% Pacific Islander, and 2.7% from other races. The median household income was $37,500, and the median family income was $45,000. The per capita income was $20,000.
Common Questions
What is Per Capita Income in Willapa?
Per Capita income in Willapa is $25,993.
What is the Median Family Income in Willapa?
Median Family Income in Willapa is $50,781.
What is the Median Household income in Willapa?
Median Household Income in Willapa is $50,000.
What is Inequality or Gini Index in Willapa?
Inequality or Gini Index in Willapa is 0.32.
What is the Total Population of Willapa?
Total Population of Willapa is 178.
What is the Total Male Population of Willapa?
Total Male Population of Willapa is 93.
What is the Total Female Population of Willapa?
Total Female Population of Willapa is 85.
What is the Ratio of Males per 100 Females in Willapa?
There are 109.41 Males per 100 Females in Willapa.
What is the Ratio of Females per 100 Males in Willapa?
There are 91.40 Females per 100 Males in Willapa.
What is the Median Population Age in Willapa?
Median Population Age in Willapa is 32.7 Years.
What is the Average Family Size in Willapa
Average Family Size in Willapa is 3.2 People.
What is the Average Household Size in Willapa
Average Household Size in Willapa is 3.1 People.
How Large is the Labor Force in Willapa?
There are 71 People in the Labor Forcein in Willapa.
What is the Percentage of People in the Labor Force in Willapa?
55.5% of People are in the Labor Force in Willapa.