Cities with the Highest Owner-Occupied Median Costs of Housing in Washington
RELATED REPORTS & OPTIONS
Highest Owner Housing Costs
Washington
Compare Cities
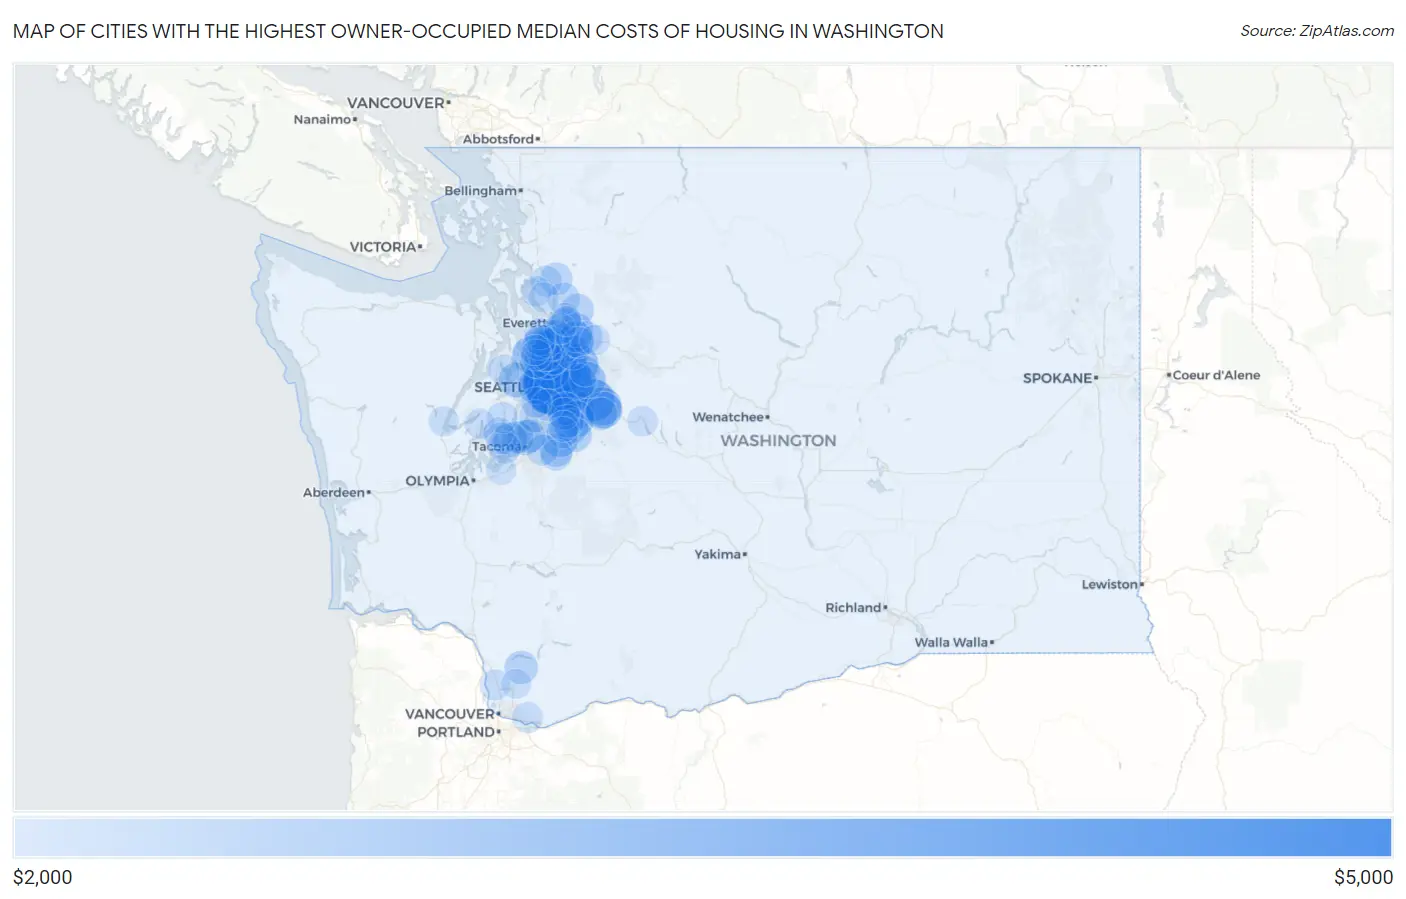
Map of Cities with the Highest Owner-Occupied Median Costs of Housing in Washington
$0
$5,000
Cities with the Highest Owner-Occupied Median Costs of Housing in Washington
| City | Housing Costs | vs State | vs National | |
| 1. | Clyde Hill | $4,001 | $1,718(+2.28k)#1 | $1,282(+2.72k)#82 |
| 2. | Medina | $4,001 | $1,718(+2.28k)#2 | $1,282(+2.72k)#88 |
| 3. | Yarrow Point | $4,001 | $1,718(+2.28k)#3 | $1,282(+2.72k)#122 |
| 4. | Beaux Arts Village | $4,001 | $1,718(+2.28k)#4 | $1,282(+2.72k)#175 |
| 5. | Hunts Point | $4,000 | $1,718(+2.28k)#5 | $1,282(+2.72k)#188 |
| 6. | Mercer Island | $3,408 | $1,718(+1.69k)#6 | $1,282(+2.13k)#362 |
| 7. | Sammamish | $3,359 | $1,718(+1.64k)#7 | $1,282(+2.08k)#387 |
| 8. | Riverpoint | $3,354 | $1,718(+1.64k)#8 | $1,282(+2.07k)#390 |
| 9. | Bothell East | $3,340 | $1,718(+1.62k)#9 | $1,282(+2.06k)#398 |
| 10. | Snoqualmie | $3,208 | $1,718(+1.49k)#10 | $1,282(+1.93k)#470 |
| 11. | Cottage Lake | $3,129 | $1,718(+1.41k)#11 | $1,282(+1.85k)#520 |
| 12. | Mirrormont | $3,010 | $1,718(+1.29k)#12 | $1,282(+1.73k)#617 |
| 13. | Duvall | $2,961 | $1,718(+1.24k)#13 | $1,282(+1.68k)#655 |
| 14. | Newcastle | $2,904 | $1,718(+1.19k)#14 | $1,282(+1.62k)#719 |
| 15. | North Bend | $2,850 | $1,718(+1.13k)#15 | $1,282(+1.57k)#767 |
| 16. | Woodway | $2,838 | $1,718(+1.12k)#16 | $1,282(+1.56k)#780 |
| 17. | Union Hill Novelty Hill | $2,806 | $1,718(+1.09k)#17 | $1,282(+1.52k)#804 |
| 18. | Mill Creek East | $2,792 | $1,718(+1.07k)#18 | $1,282(+1.51k)#823 |
| 19. | Woodinville | $2,777 | $1,718(+1.06k)#19 | $1,282(+1.50k)#836 |
| 20. | Lake Forest Park | $2,764 | $1,718(+1.05k)#20 | $1,282(+1.48k)#850 |
| 21. | Issaquah | $2,746 | $1,718(+1.03k)#21 | $1,282(+1.46k)#876 |
| 22. | Maltby | $2,725 | $1,718(+1.01k)#22 | $1,282(+1.44k)#911 |
| 23. | Redmond | $2,723 | $1,718(+1.00k)#23 | $1,282(+1.44k)#912 |
| 24. | Riverbend | $2,716 | $1,718(+998)#24 | $1,282(+1.43k)#928 |
| 25. | Tehaleh | $2,698 | $1,718(+980)#25 | $1,282(+1.42k)#947 |
| 26. | Bellevue | $2,695 | $1,718(+977)#26 | $1,282(+1.41k)#950 |
| 27. | Lake Holm | $2,693 | $1,718(+975)#27 | $1,282(+1.41k)#952 |
| 28. | Carnation | $2,690 | $1,718(+972)#28 | $1,282(+1.41k)#956 |
| 29. | Hobart | $2,682 | $1,718(+964)#29 | $1,282(+1.40k)#965 |
| 30. | Kirkland | $2,674 | $1,718(+956)#30 | $1,282(+1.39k)#971 |
| 31. | Seattle | $2,666 | $1,718(+948)#31 | $1,282(+1.38k)#981 |
| 32. | Larch Way | $2,655 | $1,718(+937)#32 | $1,282(+1.37k)#1,005 |
| 33. | Cathcart | $2,615 | $1,718(+897)#33 | $1,282(+1.33k)#1,076 |
| 34. | Kenmore | $2,602 | $1,718(+884)#34 | $1,282(+1.32k)#1,098 |
| 35. | Ames Lake | $2,571 | $1,718(+853)#35 | $1,282(+1.29k)#1,165 |
| 36. | Bainbridge Island | $2,562 | $1,718(+844)#36 | $1,282(+1.28k)#1,177 |
| 37. | Browns Point | $2,556 | $1,718(+838)#37 | $1,282(+1.27k)#1,190 |
| 38. | Silver Firs | $2,549 | $1,718(+831)#38 | $1,282(+1.27k)#1,201 |
| 39. | Bothell West | $2,536 | $1,718(+818)#39 | $1,282(+1.25k)#1,226 |
| 40. | Monroe North | $2,534 | $1,718(+816)#40 | $1,282(+1.25k)#1,232 |
| 41. | Bothell | $2,525 | $1,718(+807)#41 | $1,282(+1.24k)#1,247 |
| 42. | Bunk Foss | $2,516 | $1,718(+798)#42 | $1,282(+1.23k)#1,262 |
| 43. | High Bridge | $2,506 | $1,718(+788)#43 | $1,282(+1.22k)#1,280 |
| 44. | Maple Valley | $2,501 | $1,718(+783)#44 | $1,282(+1.22k)#1,286 |
| 45. | Wollochet | $2,486 | $1,718(+768)#45 | $1,282(+1.20k)#1,321 |
| 46. | Three Lakes | $2,482 | $1,718(+764)#46 | $1,282(+1.20k)#1,325 |
| 47. | Eastmont | $2,449 | $1,718(+731)#47 | $1,282(+1.17k)#1,385 |
| 48. | Black Diamond | $2,438 | $1,718(+720)#48 | $1,282(+1.16k)#1,404 |
| 49. | Lake Tapps | $2,434 | $1,718(+716)#49 | $1,282(+1.15k)#1,417 |
| 50. | Mill Creek | $2,412 | $1,718(+694)#50 | $1,282(+1.13k)#1,447 |
| 51. | Dash Point | $2,401 | $1,718(+683)#51 | $1,282(+1.12k)#1,471 |
| 52. | Amboy | $2,397 | $1,718(+679)#52 | $1,282(+1.11k)#1,478 |
| 53. | Martha Lake | $2,393 | $1,718(+675)#53 | $1,282(+1.11k)#1,484 |
| 54. | Shoreline | $2,391 | $1,718(+673)#54 | $1,282(+1.11k)#1,488 |
| 55. | East Renton Highlands | $2,387 | $1,718(+669)#55 | $1,282(+1.10k)#1,499 |
| 56. | Shadow Lake | $2,365 | $1,718(+647)#56 | $1,282(+1.08k)#1,544 |
| 57. | Lake Bosworth | $2,347 | $1,718(+629)#57 | $1,282(+1.06k)#1,586 |
| 58. | Woods Creek | $2,333 | $1,718(+615)#58 | $1,282(+1.05k)#1,616 |
| 59. | Lake Stickney | $2,332 | $1,718(+614)#59 | $1,282(+1.05k)#1,623 |
| 60. | Brier | $2,327 | $1,718(+609)#60 | $1,282(+1.04k)#1,642 |
| 61. | Bryant | $2,321 | $1,718(+603)#61 | $1,282(+1.04k)#1,656 |
| 62. | Wilderness Rim | $2,317 | $1,718(+599)#62 | $1,282(+1.03k)#1,662 |
| 63. | Sisco Heights | $2,311 | $1,718(+593)#63 | $1,282(+1.03k)#1,679 |
| 64. | Ruston | $2,311 | $1,718(+593)#64 | $1,282(+1.03k)#1,682 |
| 65. | Normandy Park | $2,308 | $1,718(+590)#65 | $1,282(+1.03k)#1,688 |
| 66. | Meadowdale | $2,306 | $1,718(+588)#66 | $1,282(+1.02k)#1,696 |
| 67. | Bryn Mawr Skyway | $2,283 | $1,718(+565)#67 | $1,282(+1.00k)#1,766 |
| 68. | Maple Heights Lake Desire | $2,281 | $1,718(+563)#68 | $1,282(+999)#1,775 |
| 69. | Chain Lake | $2,270 | $1,718(+552)#69 | $1,282(+988)#1,804 |
| 70. | Artondale | $2,269 | $1,718(+551)#70 | $1,282(+987)#1,808 |
| 71. | Lake Stevens | $2,268 | $1,718(+550)#71 | $1,282(+986)#1,812 |
| 72. | Fox Island | $2,243 | $1,718(+525)#72 | $1,282(+961)#1,864 |
| 73. | Lake Morton Berrydale | $2,226 | $1,718(+508)#73 | $1,282(+944)#1,900 |
| 74. | Burley | $2,225 | $1,718(+507)#74 | $1,282(+943)#1,902 |
| 75. | Monroe | $2,217 | $1,718(+499)#75 | $1,282(+935)#1,919 |
| 76. | Sunday Lake | $2,217 | $1,718(+499)#76 | $1,282(+935)#1,922 |
| 77. | Bonney Lake | $2,210 | $1,718(+492)#77 | $1,282(+928)#1,938 |
| 78. | Edgewood | $2,210 | $1,718(+492)#78 | $1,282(+928)#1,939 |
| 79. | Mukilteo | $2,205 | $1,718(+487)#79 | $1,282(+923)#1,952 |
| 80. | Fobes Hill | $2,187 | $1,718(+469)#80 | $1,282(+905)#2,006 |
| 81. | Covington | $2,186 | $1,718(+468)#81 | $1,282(+904)#2,008 |
| 82. | Picnic Point | $2,183 | $1,718(+465)#82 | $1,282(+901)#2,021 |
| 83. | Esperance | $2,183 | $1,718(+465)#83 | $1,282(+901)#2,024 |
| 84. | Keyport | $2,181 | $1,718(+463)#84 | $1,282(+899)#2,034 |
| 85. | Camas | $2,174 | $1,718(+456)#85 | $1,282(+892)#2,055 |
| 86. | Ridgefield | $2,160 | $1,718(+442)#86 | $1,282(+878)#2,106 |
| 87. | White Center | $2,150 | $1,718(+432)#87 | $1,282(+868)#2,136 |
| 88. | Raft Island | $2,150 | $1,718(+432)#88 | $1,282(+868)#2,138 |
| 89. | Lake Marcel Stillwater | $2,143 | $1,718(+425)#89 | $1,282(+861)#2,147 |
| 90. | North Sultan | $2,141 | $1,718(+423)#90 | $1,282(+859)#2,154 |
| 91. | Clear Lake Cdp Pierce County | $2,133 | $1,718(+415)#91 | $1,282(+851)#2,183 |
| 92. | Snoqualmie Pass | $2,129 | $1,718(+411)#92 | $1,282(+847)#2,198 |
| 93. | Warm Beach | $2,125 | $1,718(+407)#93 | $1,282(+843)#2,206 |
| 94. | Edmonds | $2,119 | $1,718(+401)#94 | $1,282(+837)#2,226 |
| 95. | Allyn | $2,119 | $1,718(+401)#95 | $1,282(+837)#2,229 |
| 96. | Cavalero | $2,118 | $1,718(+400)#96 | $1,282(+836)#2,238 |
| 97. | Hoodsport | $2,115 | $1,718(+397)#97 | $1,282(+833)#2,248 |
| 98. | Dupont | $2,102 | $1,718(+384)#98 | $1,282(+820)#2,286 |
| 99. | Lewisville | $2,102 | $1,718(+384)#99 | $1,282(+820)#2,289 |
| 100. | Lake Goodwin | $2,099 | $1,718(+381)#100 | $1,282(+817)#2,300 |
Common Questions
What are the Top 10 Cities with the Highest Owner-Occupied Median Costs of Housing in Washington?
Top 10 Cities with the Highest Owner-Occupied Median Costs of Housing in Washington are:
#1
$4,001
#2
$4,001
#3
$4,001
#4
$4,001
#5
$4,000
#6
$3,408
#7
$3,359
#8
$3,340
#9
$3,208
#10
$3,129
What city has the Highest Owner-Occupied Median Costs of Housing in Washington?
Clyde Hill has the Highest Owner-Occupied Median Costs of Housing in Washington with $4,001.
What is the Median Renter-Occupied Housing Costs in the State of Washington?
Median Renter-Occupied Housing Costs in Washington is $1,718.
What is the Median Renter-Occupied Housing Costs in the United States?
Median Renter-Occupied Housing Costs in the United States is $1,282.