Cities with the Highest Percentage of Immigrants from Ukraine in Washington
RELATED REPORTS & OPTIONS
Ukraine
Washington
Compare Cities
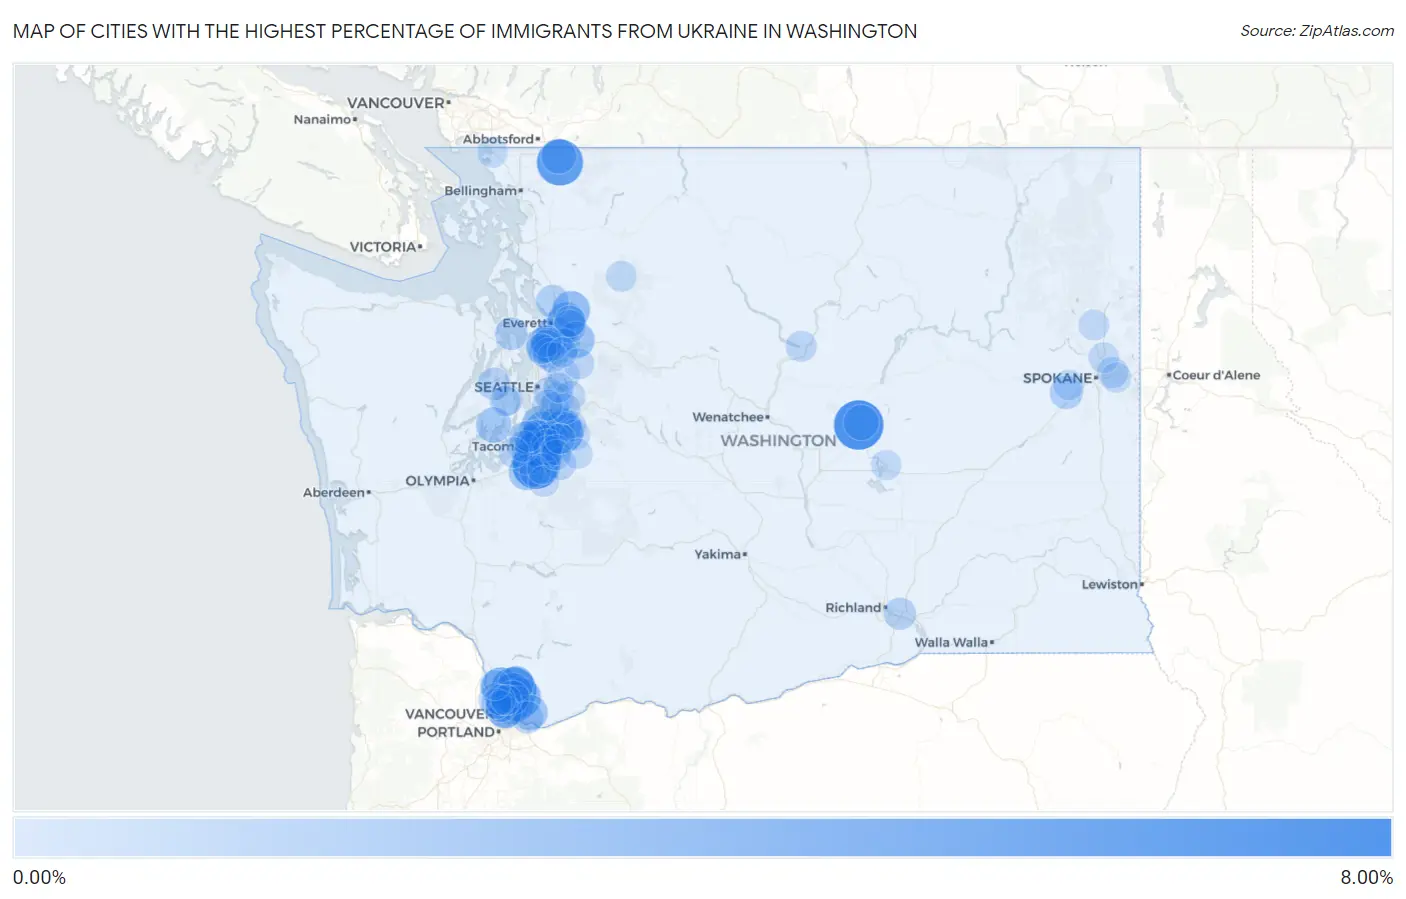
Map of Cities with the Highest Percentage of Immigrants from Ukraine in Washington
0.00%
8.00%
Cities with the Highest Percentage of Immigrants from Ukraine in Washington
| City | Ukraine | vs State | vs National | |
| 1. | Lakeview | 6.49% | 0.47%(+6.03)#1 | 0.12%(+6.38)#16 |
| 2. | Summit View | 5.91% | 0.47%(+5.44)#2 | 0.12%(+5.79)#22 |
| 3. | Kendall | 5.42% | 0.47%(+4.96)#3 | 0.12%(+5.31)#25 |
| 4. | Battle Ground | 5.13% | 0.47%(+4.67)#4 | 0.12%(+5.02)#30 |
| 5. | Lakeland South | 3.97% | 0.47%(+3.51)#5 | 0.12%(+3.86)#47 |
| 6. | Lake Morton Berrydale | 3.96% | 0.47%(+3.49)#6 | 0.12%(+3.84)#49 |
| 7. | Fife Heights | 3.75% | 0.47%(+3.28)#7 | 0.12%(+3.64)#53 |
| 8. | Milton | 3.64% | 0.47%(+3.17)#8 | 0.12%(+3.52)#55 |
| 9. | Duluth | 3.59% | 0.47%(+3.13)#9 | 0.12%(+3.48)#58 |
| 10. | Edgewood | 3.48% | 0.47%(+3.02)#10 | 0.12%(+3.37)#61 |
| 11. | Lakeland North | 3.37% | 0.47%(+2.90)#11 | 0.12%(+3.25)#63 |
| 12. | Hockinson | 3.24% | 0.47%(+2.77)#12 | 0.12%(+3.12)#67 |
| 13. | Meadow Glade | 3.10% | 0.47%(+2.63)#13 | 0.12%(+2.98)#70 |
| 14. | Eastmont | 3.08% | 0.47%(+2.61)#14 | 0.12%(+2.96)#73 |
| 15. | Five Corners | 2.90% | 0.47%(+2.43)#15 | 0.12%(+2.78)#81 |
| 16. | Minnehaha | 2.76% | 0.47%(+2.30)#16 | 0.12%(+2.65)#91 |
| 17. | Cavalero | 2.75% | 0.47%(+2.28)#17 | 0.12%(+2.63)#92 |
| 18. | Lochsloy | 2.69% | 0.47%(+2.22)#18 | 0.12%(+2.57)#94 |
| 19. | Monroe North | 2.39% | 0.47%(+1.93)#19 | 0.12%(+2.28)#109 |
| 20. | Orchards | 2.17% | 0.47%(+1.71)#20 | 0.12%(+2.06)#124 |
| 21. | Des Moines | 2.09% | 0.47%(+1.62)#21 | 0.12%(+1.98)#131 |
| 22. | Fern Prairie | 2.00% | 0.47%(+1.54)#22 | 0.12%(+1.89)#135 |
| 23. | Stansberry Lake | 1.99% | 0.47%(+1.52)#23 | 0.12%(+1.87)#136 |
| 24. | Kent | 1.98% | 0.47%(+1.51)#24 | 0.12%(+1.86)#140 |
| 25. | Fife | 1.97% | 0.47%(+1.50)#25 | 0.12%(+1.85)#142 |
| 26. | Soap Lake | 1.96% | 0.47%(+1.49)#26 | 0.12%(+1.84)#143 |
| 27. | Lewisville | 1.94% | 0.47%(+1.47)#27 | 0.12%(+1.82)#146 |
| 28. | North Lynnwood | 1.91% | 0.47%(+1.44)#28 | 0.12%(+1.79)#149 |
| 29. | Spanaway | 1.90% | 0.47%(+1.43)#29 | 0.12%(+1.78)#151 |
| 30. | Peaceful Valley | 1.88% | 0.47%(+1.41)#30 | 0.12%(+1.76)#154 |
| 31. | Covington | 1.85% | 0.47%(+1.38)#31 | 0.12%(+1.73)#160 |
| 32. | Martha Lake | 1.71% | 0.47%(+1.24)#32 | 0.12%(+1.59)#183 |
| 33. | Auburn | 1.60% | 0.47%(+1.13)#33 | 0.12%(+1.49)#199 |
| 34. | Brush Prairie | 1.49% | 0.47%(+1.02)#34 | 0.12%(+1.37)#222 |
| 35. | Algona | 1.38% | 0.47%(+0.912)#35 | 0.12%(+1.26)#242 |
| 36. | Felida | 1.35% | 0.47%(+0.883)#36 | 0.12%(+1.23)#246 |
| 37. | Medical Lake | 1.28% | 0.47%(+0.817)#37 | 0.12%(+1.17)#264 |
| 38. | Cathcart | 1.28% | 0.47%(+0.816)#38 | 0.12%(+1.17)#265 |
| 39. | Marysville | 1.23% | 0.47%(+0.766)#39 | 0.12%(+1.12)#278 |
| 40. | Vancouver | 1.21% | 0.47%(+0.741)#40 | 0.12%(+1.09)#285 |
| 41. | Everett | 1.20% | 0.47%(+0.733)#41 | 0.12%(+1.08)#287 |
| 42. | Alderwood Manor | 1.17% | 0.47%(+0.702)#42 | 0.12%(+1.05)#299 |
| 43. | Larch Way | 1.14% | 0.47%(+0.670)#43 | 0.12%(+1.02)#307 |
| 44. | Hansville | 1.08% | 0.47%(+0.612)#44 | 0.12%(+0.962)#324 |
| 45. | Chico | 1.04% | 0.47%(+0.574)#45 | 0.12%(+0.925)#337 |
| 46. | Midland | 1.04% | 0.47%(+0.569)#46 | 0.12%(+0.919)#344 |
| 47. | Pasco | 1.03% | 0.47%(+0.561)#47 | 0.12%(+0.912)#351 |
| 48. | Camas | 0.98% | 0.47%(+0.515)#48 | 0.12%(+0.866)#363 |
| 49. | Prairie Ridge | 0.98% | 0.47%(+0.514)#49 | 0.12%(+0.865)#364 |
| 50. | Federal Way | 0.97% | 0.47%(+0.503)#50 | 0.12%(+0.854)#369 |
| 51. | Newcastle | 0.94% | 0.47%(+0.477)#51 | 0.12%(+0.828)#378 |
| 52. | Browns Point | 0.91% | 0.47%(+0.445)#52 | 0.12%(+0.796)#388 |
| 53. | Bothell West | 0.91% | 0.47%(+0.444)#53 | 0.12%(+0.795)#389 |
| 54. | Redmond | 0.85% | 0.47%(+0.387)#54 | 0.12%(+0.737)#410 |
| 55. | Lake Stickney | 0.85% | 0.47%(+0.379)#55 | 0.12%(+0.730)#413 |
| 56. | Pacific | 0.83% | 0.47%(+0.365)#56 | 0.12%(+0.716)#419 |
| 57. | Hazel Dell | 0.83% | 0.47%(+0.361)#57 | 0.12%(+0.712)#425 |
| 58. | Sumner | 0.80% | 0.47%(+0.336)#58 | 0.12%(+0.687)#442 |
| 59. | Frederickson | 0.73% | 0.47%(+0.265)#59 | 0.12%(+0.616)#484 |
| 60. | Machias | 0.71% | 0.47%(+0.248)#60 | 0.12%(+0.599)#498 |
| 61. | Millwood | 0.67% | 0.47%(+0.207)#61 | 0.12%(+0.558)#538 |
| 62. | Tacoma | 0.66% | 0.47%(+0.198)#62 | 0.12%(+0.549)#544 |
| 63. | Roche Harbor | 0.66% | 0.47%(+0.197)#63 | 0.12%(+0.548)#545 |
| 64. | Dash Point | 0.65% | 0.47%(+0.183)#64 | 0.12%(+0.534)#556 |
| 65. | Duvall | 0.63% | 0.47%(+0.161)#65 | 0.12%(+0.512)#576 |
| 66. | Chelan | 0.61% | 0.47%(+0.142)#66 | 0.12%(+0.493)#595 |
| 67. | Mercer Island | 0.60% | 0.47%(+0.134)#67 | 0.12%(+0.485)#605 |
| 68. | Black Diamond | 0.58% | 0.47%(+0.117)#68 | 0.12%(+0.468)#623 |
| 69. | Issaquah | 0.58% | 0.47%(+0.112)#69 | 0.12%(+0.463)#627 |
| 70. | Graham | 0.58% | 0.47%(+0.109)#70 | 0.12%(+0.459)#630 |
| 71. | Darrington | 0.57% | 0.47%(+0.101)#71 | 0.12%(+0.452)#640 |
| 72. | Parkwood | 0.55% | 0.47%(+0.081)#72 | 0.12%(+0.432)#660 |
| 73. | Maple Valley | 0.55% | 0.47%(+0.078)#73 | 0.12%(+0.429)#664 |
| 74. | Suncrest | 0.54% | 0.47%(+0.076)#74 | 0.12%(+0.427)#669 |
| 75. | Deer Park | 0.54% | 0.47%(+0.069)#75 | 0.12%(+0.420)#678 |
| 76. | Fairchild Afb | 0.53% | 0.47%(+0.067)#76 | 0.12%(+0.418)#681 |
| 77. | Renton | 0.53% | 0.47%(+0.067)#77 | 0.12%(+0.418)#682 |
| 78. | Bothell | 0.53% | 0.47%(+0.064)#78 | 0.12%(+0.414)#684 |
| 79. | East Renton Highlands | 0.51% | 0.47%(+0.038)#79 | 0.12%(+0.389)#717 |
| 80. | Bryn Mawr Skyway | 0.50% | 0.47%(+0.033)#80 | 0.12%(+0.383)#725 |
| 81. | East Port Orchard | 0.49% | 0.47%(+0.024)#81 | 0.12%(+0.375)#731 |
| 82. | Mead | 0.49% | 0.47%(+0.021)#82 | 0.12%(+0.372)#732 |
| 83. | University Place | 0.49% | 0.47%(+0.021)#83 | 0.12%(+0.371)#735 |
| 84. | Spokane Valley | 0.48% | 0.47%(+0.010)#84 | 0.12%(+0.361)#748 |
| 85. | South Hill | 0.47% | 0.47%(+0.008)#85 | 0.12%(+0.359)#755 |
| 86. | Fairwood Cdp King County | 0.46% | 0.47%(-0.004)#86 | 0.12%(+0.346)#773 |
| 87. | Blaine | 0.46% | 0.47%(-0.006)#87 | 0.12%(+0.345)#779 |
| 88. | Lynnwood | 0.45% | 0.47%(-0.013)#88 | 0.12%(+0.338)#786 |
| 89. | Lake Tapps | 0.45% | 0.47%(-0.016)#89 | 0.12%(+0.335)#790 |
| 90. | Moses Lake | 0.43% | 0.47%(-0.041)#90 | 0.12%(+0.310)#831 |
| 91. | Lake Shore | 0.43% | 0.47%(-0.041)#91 | 0.12%(+0.309)#833 |
| 92. | Salmon Creek | 0.42% | 0.47%(-0.043)#92 | 0.12%(+0.308)#838 |
| 93. | Bellevue | 0.41% | 0.47%(-0.055)#93 | 0.12%(+0.296)#859 |
| 94. | Bonney Lake | 0.41% | 0.47%(-0.059)#94 | 0.12%(+0.291)#874 |
| 95. | Lexington | 0.40% | 0.47%(-0.071)#95 | 0.12%(+0.280)#894 |
| 96. | Enumclaw | 0.39% | 0.47%(-0.079)#96 | 0.12%(+0.272)#905 |
| 97. | Lake Holm | 0.38% | 0.47%(-0.083)#97 | 0.12%(+0.267)#912 |
| 98. | Ridgefield | 0.38% | 0.47%(-0.083)#98 | 0.12%(+0.267)#913 |
| 99. | Maltby | 0.38% | 0.47%(-0.088)#99 | 0.12%(+0.263)#925 |
| 100. | Barberton | 0.38% | 0.47%(-0.089)#100 | 0.12%(+0.262)#926 |
Common Questions
What are the Top 10 Cities with the Highest Percentage of Immigrants from Ukraine in Washington?
Top 10 Cities with the Highest Percentage of Immigrants from Ukraine in Washington are:
#1
6.49%
#2
5.91%
#3
5.42%
#4
5.13%
#5
3.97%
#6
3.96%
#7
3.75%
#8
3.64%
#9
3.59%
#10
3.48%
What city has the Highest Percentage of Immigrants from Ukraine in Washington?
Lakeview has the Highest Percentage of Immigrants from Ukraine in Washington with 6.49%.
What is the Percentage of Immigrants from Ukraine in the State of Washington?
Percentage of Immigrants from Ukraine in Washington is 0.47%.
What is the Percentage of Immigrants from Ukraine in the United States?
Percentage of Immigrants from Ukraine in the United States is 0.12%.