Cities with the Highest Percentage of Immigrants from Japan in Washington
RELATED REPORTS & OPTIONS
Japan
Washington
Compare Cities
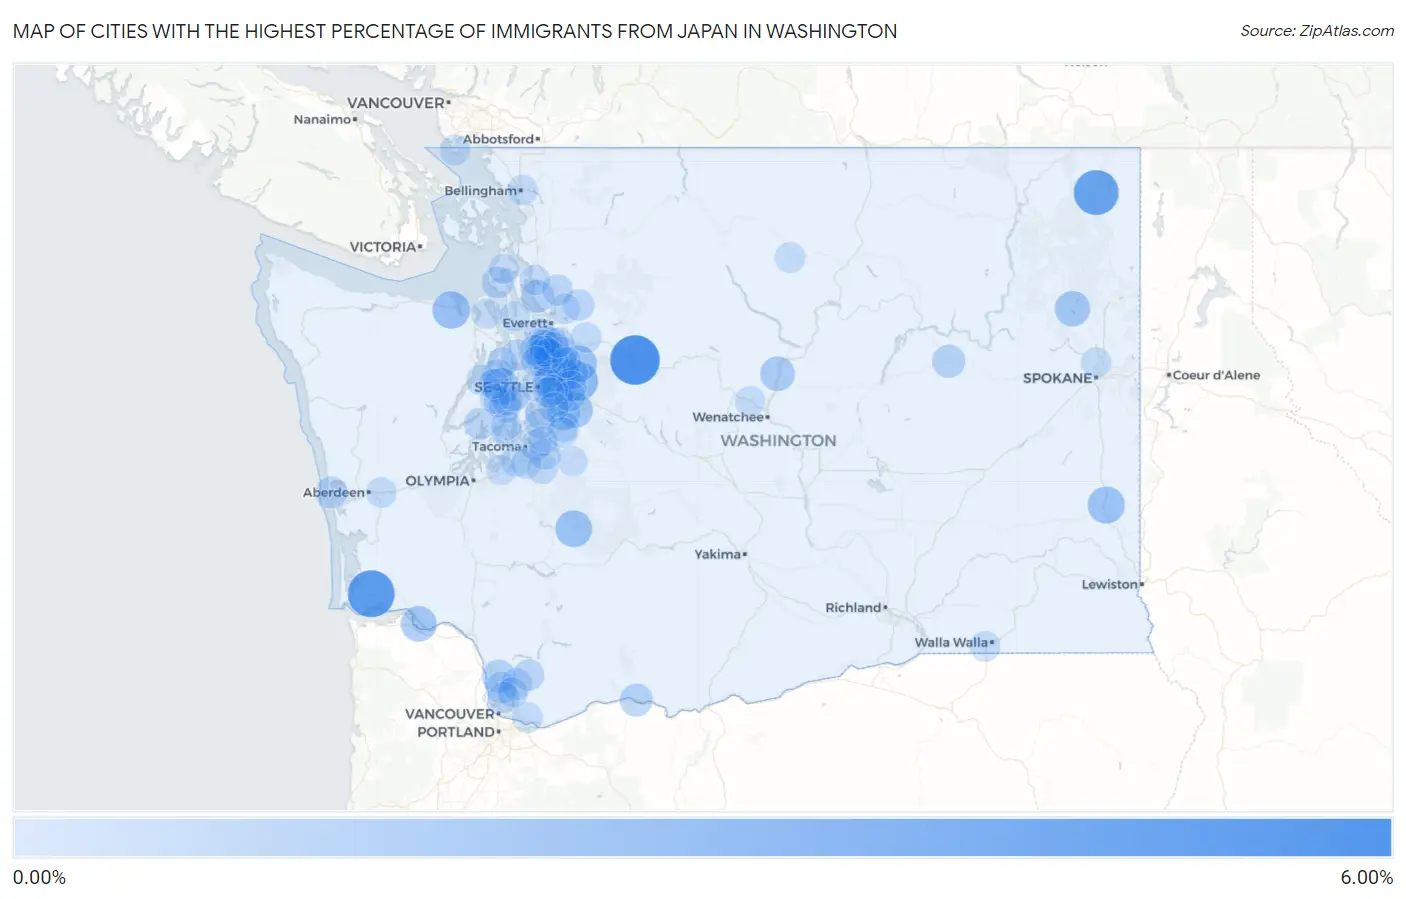
Map of Cities with the Highest Percentage of Immigrants from Japan in Washington
0.00%
6.00%
Cities with the Highest Percentage of Immigrants from Japan in Washington
| City | Japan | vs State | vs National | |
| 1. | Baring | 5.34% | 0.23%(+5.11)#1 | 0.10%(+5.24)#14 |
| 2. | Naselle | 4.61% | 0.23%(+4.38)#2 | 0.10%(+4.51)#17 |
| 3. | Ione | 4.09% | 0.23%(+3.87)#3 | 0.10%(+3.99)#22 |
| 4. | Ames Lake | 2.44% | 0.23%(+2.21)#4 | 0.10%(+2.33)#71 |
| 5. | Bell Hill | 2.11% | 0.23%(+1.88)#5 | 0.10%(+2.01)#88 |
| 6. | Colfax | 2.00% | 0.23%(+1.77)#6 | 0.10%(+1.90)#93 |
| 7. | Ashford | 1.93% | 0.23%(+1.70)#7 | 0.10%(+1.82)#102 |
| 8. | Duvall | 1.86% | 0.23%(+1.63)#8 | 0.10%(+1.75)#109 |
| 9. | Tracyton | 1.78% | 0.23%(+1.55)#9 | 0.10%(+1.68)#116 |
| 10. | Woodinville | 1.71% | 0.23%(+1.48)#10 | 0.10%(+1.60)#121 |
| 11. | Mirrormont | 1.61% | 0.23%(+1.38)#11 | 0.10%(+1.51)#138 |
| 12. | Puget Island | 1.61% | 0.23%(+1.38)#12 | 0.10%(+1.50)#139 |
| 13. | Loon Lake | 1.57% | 0.23%(+1.34)#13 | 0.10%(+1.46)#143 |
| 14. | Bellevue | 1.44% | 0.23%(+1.22)#14 | 0.10%(+1.34)#160 |
| 15. | Entiat | 1.35% | 0.23%(+1.12)#15 | 0.10%(+1.25)#180 |
| 16. | Erlands Point | 1.12% | 0.23%(+0.894)#16 | 0.10%(+1.02)#243 |
| 17. | Maple Heights Lake Desire | 1.02% | 0.23%(+0.792)#17 | 0.10%(+0.915)#275 |
| 18. | Wilbur | 1.00% | 0.23%(+0.771)#18 | 0.10%(+0.894)#285 |
| 19. | La Center | 0.98% | 0.23%(+0.750)#19 | 0.10%(+0.874)#292 |
| 20. | Bingen | 0.96% | 0.23%(+0.738)#20 | 0.10%(+0.861)#300 |
| 21. | Kayak Point | 0.90% | 0.23%(+0.676)#21 | 0.10%(+0.800)#325 |
| 22. | Redmond | 0.88% | 0.23%(+0.653)#22 | 0.10%(+0.777)#332 |
| 23. | Newcastle | 0.85% | 0.23%(+0.624)#23 | 0.10%(+0.747)#350 |
| 24. | Brier | 0.83% | 0.23%(+0.599)#24 | 0.10%(+0.722)#364 |
| 25. | Port Orchard | 0.79% | 0.23%(+0.563)#25 | 0.10%(+0.687)#393 |
| 26. | Bethel | 0.78% | 0.23%(+0.555)#26 | 0.10%(+0.679)#400 |
| 27. | Mill Creek | 0.71% | 0.23%(+0.480)#27 | 0.10%(+0.603)#442 |
| 28. | Silverdale | 0.68% | 0.23%(+0.457)#28 | 0.10%(+0.581)#449 |
| 29. | Larch Way | 0.68% | 0.23%(+0.455)#29 | 0.10%(+0.579)#451 |
| 30. | Duluth | 0.64% | 0.23%(+0.411)#30 | 0.10%(+0.534)#488 |
| 31. | Coupeville | 0.64% | 0.23%(+0.410)#31 | 0.10%(+0.534)#490 |
| 32. | Ocean Shores | 0.63% | 0.23%(+0.402)#32 | 0.10%(+0.525)#499 |
| 33. | Kirkland | 0.62% | 0.23%(+0.388)#33 | 0.10%(+0.512)#515 |
| 34. | Seatac | 0.59% | 0.23%(+0.365)#34 | 0.10%(+0.488)#546 |
| 35. | North Puyallup | 0.58% | 0.23%(+0.356)#35 | 0.10%(+0.479)#554 |
| 36. | Allyn | 0.58% | 0.23%(+0.351)#36 | 0.10%(+0.475)#559 |
| 37. | Granite Falls | 0.57% | 0.23%(+0.342)#37 | 0.10%(+0.466)#562 |
| 38. | Lewisville | 0.57% | 0.23%(+0.339)#38 | 0.10%(+0.462)#569 |
| 39. | Mount Vista | 0.56% | 0.23%(+0.331)#39 | 0.10%(+0.454)#585 |
| 40. | Union Hill Novelty Hill | 0.55% | 0.23%(+0.325)#40 | 0.10%(+0.449)#596 |
| 41. | Kingston | 0.53% | 0.23%(+0.307)#41 | 0.10%(+0.430)#617 |
| 42. | Clyde Hill | 0.51% | 0.23%(+0.288)#42 | 0.10%(+0.411)#634 |
| 43. | Yacolt | 0.51% | 0.23%(+0.285)#43 | 0.10%(+0.408)#640 |
| 44. | Maltby | 0.51% | 0.23%(+0.284)#44 | 0.10%(+0.408)#641 |
| 45. | Fife Heights | 0.51% | 0.23%(+0.282)#45 | 0.10%(+0.405)#648 |
| 46. | Arlington | 0.51% | 0.23%(+0.281)#46 | 0.10%(+0.405)#650 |
| 47. | Bothell | 0.49% | 0.23%(+0.263)#47 | 0.10%(+0.387)#684 |
| 48. | Mukilteo | 0.48% | 0.23%(+0.255)#48 | 0.10%(+0.379)#696 |
| 49. | Lake Stickney | 0.46% | 0.23%(+0.237)#49 | 0.10%(+0.360)#722 |
| 50. | Sammamish | 0.45% | 0.23%(+0.224)#50 | 0.10%(+0.347)#749 |
| 51. | Lake Forest Park | 0.44% | 0.23%(+0.211)#51 | 0.10%(+0.335)#771 |
| 52. | Lynnwood | 0.44% | 0.23%(+0.209)#52 | 0.10%(+0.333)#777 |
| 53. | Mountlake Terrace | 0.43% | 0.23%(+0.204)#53 | 0.10%(+0.328)#786 |
| 54. | Seattle | 0.43% | 0.23%(+0.204)#54 | 0.10%(+0.327)#787 |
| 55. | Kenmore | 0.42% | 0.23%(+0.192)#55 | 0.10%(+0.316)#805 |
| 56. | North Lynnwood | 0.41% | 0.23%(+0.186)#56 | 0.10%(+0.309)#820 |
| 57. | Parkwood | 0.41% | 0.23%(+0.184)#57 | 0.10%(+0.307)#824 |
| 58. | Medina | 0.41% | 0.23%(+0.184)#58 | 0.10%(+0.307)#826 |
| 59. | Covington | 0.40% | 0.23%(+0.177)#59 | 0.10%(+0.300)#836 |
| 60. | Point Roberts | 0.40% | 0.23%(+0.173)#60 | 0.10%(+0.297)#842 |
| 61. | Issaquah | 0.40% | 0.23%(+0.171)#61 | 0.10%(+0.295)#845 |
| 62. | Mill Creek East | 0.40% | 0.23%(+0.168)#62 | 0.10%(+0.292)#849 |
| 63. | Camas | 0.39% | 0.23%(+0.167)#63 | 0.10%(+0.291)#851 |
| 64. | Alderwood Manor | 0.39% | 0.23%(+0.163)#64 | 0.10%(+0.286)#858 |
| 65. | Lakewood | 0.39% | 0.23%(+0.161)#65 | 0.10%(+0.285)#862 |
| 66. | Beaux Arts Village | 0.39% | 0.23%(+0.161)#66 | 0.10%(+0.284)#863 |
| 67. | South Hill | 0.38% | 0.23%(+0.152)#67 | 0.10%(+0.275)#878 |
| 68. | Bothell West | 0.37% | 0.23%(+0.138)#68 | 0.10%(+0.262)#903 |
| 69. | Twisp | 0.37% | 0.23%(+0.138)#69 | 0.10%(+0.262)#904 |
| 70. | Lake Cassidy | 0.36% | 0.23%(+0.132)#70 | 0.10%(+0.256)#917 |
| 71. | Mercer Island | 0.36% | 0.23%(+0.130)#71 | 0.10%(+0.254)#920 |
| 72. | College Place | 0.36% | 0.23%(+0.130)#72 | 0.10%(+0.254)#921 |
| 73. | Cottage Lake | 0.34% | 0.23%(+0.117)#73 | 0.10%(+0.241)#951 |
| 74. | Meadow Glade | 0.33% | 0.23%(+0.108)#74 | 0.10%(+0.231)#977 |
| 75. | Seabeck | 0.33% | 0.23%(+0.107)#75 | 0.10%(+0.231)#981 |
| 76. | Woods Creek | 0.33% | 0.23%(+0.099)#76 | 0.10%(+0.223)#1,004 |
| 77. | Edmonds | 0.33% | 0.23%(+0.098)#77 | 0.10%(+0.222)#1,006 |
| 78. | Central Park | 0.32% | 0.23%(+0.095)#78 | 0.10%(+0.219)#1,016 |
| 79. | Country Homes | 0.32% | 0.23%(+0.093)#79 | 0.10%(+0.217)#1,018 |
| 80. | Poulsbo | 0.31% | 0.23%(+0.086)#80 | 0.10%(+0.210)#1,031 |
| 81. | Cashmere | 0.31% | 0.23%(+0.081)#81 | 0.10%(+0.205)#1,044 |
| 82. | Bellingham | 0.29% | 0.23%(+0.065)#82 | 0.10%(+0.189)#1,090 |
| 83. | Des Moines | 0.29% | 0.23%(+0.064)#83 | 0.10%(+0.187)#1,095 |
| 84. | Buckley | 0.29% | 0.23%(+0.062)#84 | 0.10%(+0.186)#1,104 |
| 85. | Shoreline | 0.28% | 0.23%(+0.056)#85 | 0.10%(+0.180)#1,125 |
| 86. | Dupont | 0.28% | 0.23%(+0.054)#86 | 0.10%(+0.178)#1,132 |
| 87. | Stanwood | 0.27% | 0.23%(+0.046)#87 | 0.10%(+0.170)#1,153 |
| 88. | Port Hadlock Irondale | 0.27% | 0.23%(+0.044)#88 | 0.10%(+0.167)#1,164 |
| 89. | Gig Harbor | 0.27% | 0.23%(+0.042)#89 | 0.10%(+0.165)#1,172 |
| 90. | Canterwood | 0.27% | 0.23%(+0.040)#90 | 0.10%(+0.164)#1,177 |
| 91. | Manchester | 0.27% | 0.23%(+0.038)#91 | 0.10%(+0.162)#1,188 |
| 92. | Freeland | 0.26% | 0.23%(+0.037)#92 | 0.10%(+0.161)#1,193 |
| 93. | Oak Harbor | 0.26% | 0.23%(+0.035)#93 | 0.10%(+0.158)#1,207 |
| 94. | Chico | 0.26% | 0.23%(+0.033)#94 | 0.10%(+0.157)#1,220 |
| 95. | Bremerton | 0.26% | 0.23%(+0.032)#95 | 0.10%(+0.156)#1,225 |
| 96. | Renton | 0.25% | 0.23%(+0.027)#96 | 0.10%(+0.151)#1,239 |
| 97. | Lakeland South | 0.25% | 0.23%(+0.027)#97 | 0.10%(+0.150)#1,242 |
| 98. | Parkland | 0.25% | 0.23%(+0.022)#98 | 0.10%(+0.145)#1,263 |
| 99. | Silver Firs | 0.24% | 0.23%(+0.016)#99 | 0.10%(+0.140)#1,293 |
| 100. | Lake Morton Berrydale | 0.24% | 0.23%(+0.012)#100 | 0.10%(+0.136)#1,311 |
Common Questions
What are the Top 10 Cities with the Highest Percentage of Immigrants from Japan in Washington?
Top 10 Cities with the Highest Percentage of Immigrants from Japan in Washington are:
What city has the Highest Percentage of Immigrants from Japan in Washington?
Baring has the Highest Percentage of Immigrants from Japan in Washington with 5.34%.
What is the Percentage of Immigrants from Japan in the State of Washington?
Percentage of Immigrants from Japan in Washington is 0.23%.
What is the Percentage of Immigrants from Japan in the United States?
Percentage of Immigrants from Japan in the United States is 0.10%.