Cities with the Highest Percentage of Households With One or more Vehicles in Washington
RELATED REPORTS & OPTIONS
Households with 1 or more Cars
Washington
Compare Cities
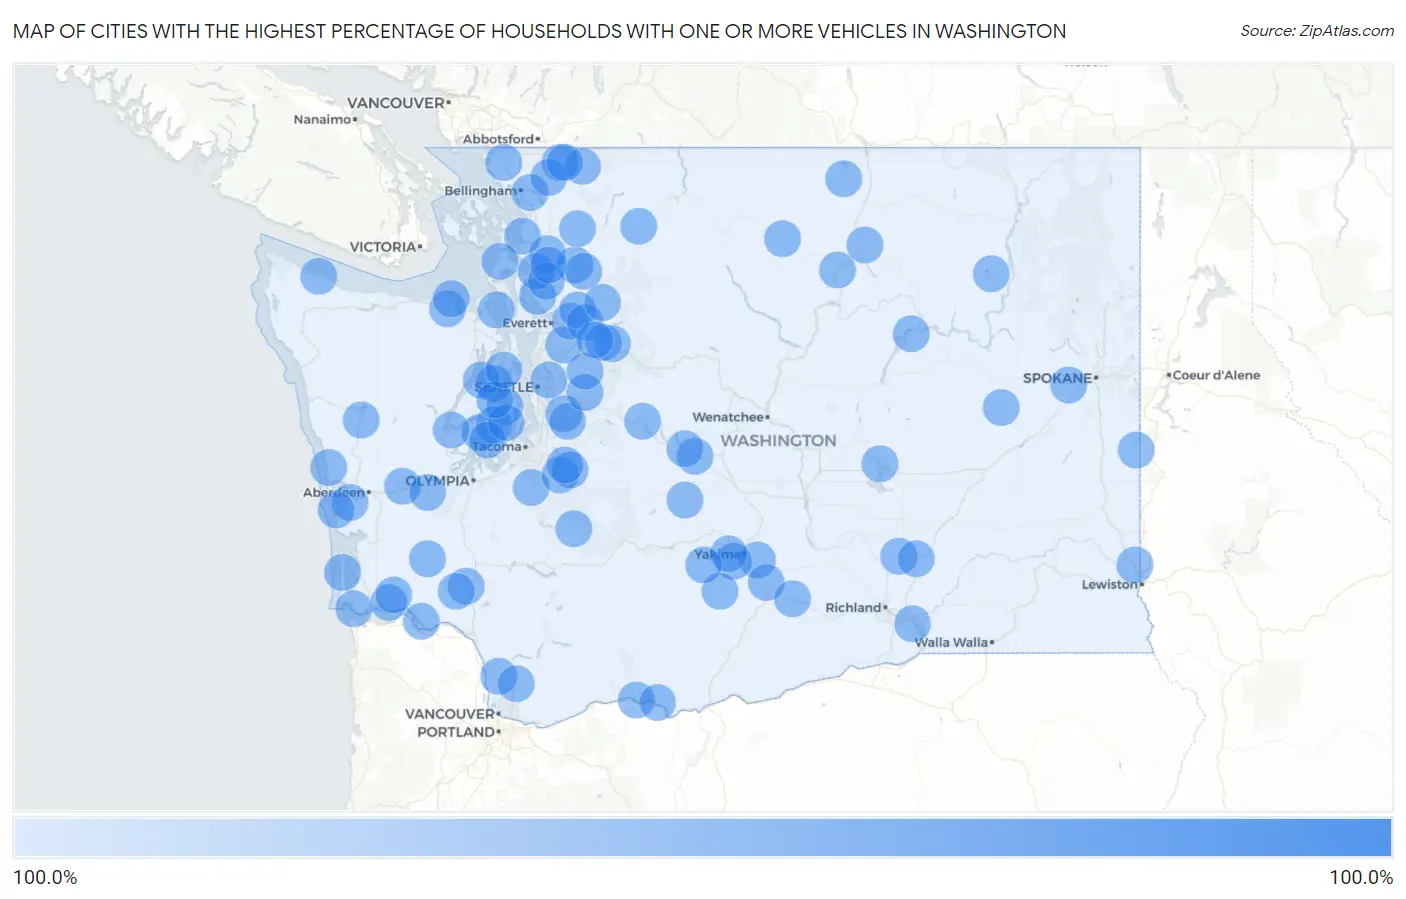
Map of Cities with the Highest Percentage of Households With One or more Vehicles in Washington
0.0%
100.0%
Cities with the Highest Percentage of Households With One or more Vehicles in Washington
| City | Housholds With 1+ Cars | vs State | vs National | |
| 1. | South Creek | 100.0% | 93.2%(+6.80)#1 | 91.7%(+8.30)#45 |
| 2. | Grapeview | 100.0% | 93.2%(+6.80)#2 | 91.7%(+8.30)#125 |
| 3. | South Cle Elum | 100.0% | 93.2%(+6.80)#3 | 91.7%(+8.30)#195 |
| 4. | Bay View | 100.0% | 93.2%(+6.80)#4 | 91.7%(+8.30)#215 |
| 5. | Lake Cavanaugh | 100.0% | 93.2%(+6.80)#5 | 91.7%(+8.30)#328 |
| 6. | Hunts Point | 100.0% | 93.2%(+6.80)#6 | 91.7%(+8.30)#338 |
| 7. | Marblemount | 100.0% | 93.2%(+6.80)#7 | 91.7%(+8.30)#458 |
| 8. | Markham | 100.0% | 93.2%(+6.80)#8 | 91.7%(+8.30)#552 |
| 9. | Loomis | 100.0% | 93.2%(+6.80)#9 | 91.7%(+8.30)#606 |
| 10. | Twin Lakes | 100.0% | 93.2%(+6.80)#10 | 91.7%(+8.30)#645 |
| 11. | Cliffdell | 100.0% | 93.2%(+6.80)#11 | 91.7%(+8.30)#667 |
| 12. | Finley | 100.0% | 93.2%(+6.80)#12 | 91.7%(+8.30)#787 |
| 13. | Lexington | 100.0% | 93.2%(+6.80)#13 | 91.7%(+8.30)#824 |
| 14. | Moxee | 100.0% | 93.2%(+6.80)#14 | 91.7%(+8.30)#832 |
| 15. | Bethel | 100.0% | 93.2%(+6.80)#15 | 91.7%(+8.30)#841 |
| 16. | La Center | 100.0% | 93.2%(+6.80)#16 | 91.7%(+8.30)#871 |
| 17. | Cascade Valley | 100.0% | 93.2%(+6.80)#17 | 91.7%(+8.30)#892 |
| 18. | Maple Heights Lake Desire | 100.0% | 93.2%(+6.80)#18 | 91.7%(+8.30)#894 |
| 19. | Ahtanum | 100.0% | 93.2%(+6.80)#19 | 91.7%(+8.30)#900 |
| 20. | Fairchild Afb | 100.0% | 93.2%(+6.80)#20 | 91.7%(+8.30)#913 |
| 21. | Chico | 100.0% | 93.2%(+6.80)#21 | 91.7%(+8.30)#929 |
| 22. | Whidbey Island Station | 100.0% | 93.2%(+6.80)#22 | 91.7%(+8.30)#999 |
| 23. | Lewisville | 100.0% | 93.2%(+6.80)#23 | 91.7%(+8.30)#1,001 |
| 24. | Big Lake | 100.0% | 93.2%(+6.80)#24 | 91.7%(+8.30)#1,032 |
| 25. | Beacon Hill | 100.0% | 93.2%(+6.80)#25 | 91.7%(+8.30)#1,059 |
| 26. | Shadow Lake | 100.0% | 93.2%(+6.80)#26 | 91.7%(+8.30)#1,061 |
| 27. | Cathcart | 100.0% | 93.2%(+6.80)#27 | 91.7%(+8.30)#1,062 |
| 28. | Geneva | 100.0% | 93.2%(+6.80)#28 | 91.7%(+8.30)#1,067 |
| 29. | Summitview | 100.0% | 93.2%(+6.80)#29 | 91.7%(+8.30)#1,075 |
| 30. | Fall City | 100.0% | 93.2%(+6.80)#30 | 91.7%(+8.30)#1,084 |
| 31. | Ocean Park | 100.0% | 93.2%(+6.80)#31 | 91.7%(+8.30)#1,114 |
| 32. | Stansberry Lake | 100.0% | 93.2%(+6.80)#32 | 91.7%(+8.30)#1,135 |
| 33. | Home | 100.0% | 93.2%(+6.80)#33 | 91.7%(+8.30)#1,167 |
| 34. | Kayak Point | 100.0% | 93.2%(+6.80)#34 | 91.7%(+8.30)#1,173 |
| 35. | Basin City | 100.0% | 93.2%(+6.80)#35 | 91.7%(+8.30)#1,215 |
| 36. | Purdy | 100.0% | 93.2%(+6.80)#36 | 91.7%(+8.30)#1,292 |
| 37. | Lake Ketchum | 100.0% | 93.2%(+6.80)#37 | 91.7%(+8.30)#1,302 |
| 38. | Lake Marcel Stillwater | 100.0% | 93.2%(+6.80)#38 | 91.7%(+8.30)#1,306 |
| 39. | Machias | 100.0% | 93.2%(+6.80)#39 | 91.7%(+8.30)#1,385 |
| 40. | Crocker | 100.0% | 93.2%(+6.80)#40 | 91.7%(+8.30)#1,409 |
| 41. | Sunday Lake | 100.0% | 93.2%(+6.80)#41 | 91.7%(+8.30)#1,450 |
| 42. | Lake Bosworth | 100.0% | 93.2%(+6.80)#42 | 91.7%(+8.30)#1,513 |
| 43. | Lake Roesiger | 100.0% | 93.2%(+6.80)#43 | 91.7%(+8.30)#1,519 |
| 44. | Brady | 100.0% | 93.2%(+6.80)#44 | 91.7%(+8.30)#1,593 |
| 45. | Kendall | 100.0% | 93.2%(+6.80)#45 | 91.7%(+8.30)#1,597 |
| 46. | Bingen | 100.0% | 93.2%(+6.80)#46 | 91.7%(+8.30)#1,628 |
| 47. | Malott | 100.0% | 93.2%(+6.80)#47 | 91.7%(+8.30)#1,632 |
| 48. | Seabeck | 100.0% | 93.2%(+6.80)#48 | 91.7%(+8.30)#1,659 |
| 49. | Vader | 100.0% | 93.2%(+6.80)#49 | 91.7%(+8.30)#1,667 |
| 50. | Marrowstone | 100.0% | 93.2%(+6.80)#50 | 91.7%(+8.30)#1,682 |
| 51. | May Creek | 100.0% | 93.2%(+6.80)#51 | 91.7%(+8.30)#1,696 |
| 52. | Erlands Point | 100.0% | 93.2%(+6.80)#52 | 91.7%(+8.30)#1,766 |
| 53. | River Road | 100.0% | 93.2%(+6.80)#53 | 91.7%(+8.30)#1,771 |
| 54. | Roche Harbor | 100.0% | 93.2%(+6.80)#54 | 91.7%(+8.30)#1,837 |
| 55. | Clallam Bay | 100.0% | 93.2%(+6.80)#55 | 91.7%(+8.30)#1,859 |
| 56. | Electric City | 100.0% | 93.2%(+6.80)#56 | 91.7%(+8.30)#1,863 |
| 57. | Mesa | 100.0% | 93.2%(+6.80)#57 | 91.7%(+8.30)#1,878 |
| 58. | Ashford | 100.0% | 93.2%(+6.80)#58 | 91.7%(+8.30)#1,947 |
| 59. | Tekoa | 100.0% | 93.2%(+6.80)#59 | 91.7%(+8.30)#1,973 |
| 60. | Startup | 100.0% | 93.2%(+6.80)#60 | 91.7%(+8.30)#1,996 |
| 61. | East Cathlamet | 100.0% | 93.2%(+6.80)#61 | 91.7%(+8.30)#2,050 |
| 62. | White Swan | 100.0% | 93.2%(+6.80)#62 | 91.7%(+8.30)#2,177 |
| 63. | Buena | 100.0% | 93.2%(+6.80)#63 | 91.7%(+8.30)#2,226 |
| 64. | Pe Ell | 100.0% | 93.2%(+6.80)#64 | 91.7%(+8.30)#2,303 |
| 65. | Gorst | 100.0% | 93.2%(+6.80)#65 | 91.7%(+8.30)#2,344 |
| 66. | Lake Mcmurray | 100.0% | 93.2%(+6.80)#66 | 91.7%(+8.30)#2,401 |
| 67. | Wilkeson | 100.0% | 93.2%(+6.80)#67 | 91.7%(+8.30)#2,439 |
| 68. | Tampico | 100.0% | 93.2%(+6.80)#68 | 91.7%(+8.30)#2,469 |
| 69. | Harrington | 100.0% | 93.2%(+6.80)#69 | 91.7%(+8.30)#2,483 |
| 70. | Chinook | 100.0% | 93.2%(+6.80)#70 | 91.7%(+8.30)#2,491 |
| 71. | Rosburg | 100.0% | 93.2%(+6.80)#71 | 91.7%(+8.30)#2,553 |
| 72. | Deming | 100.0% | 93.2%(+6.80)#72 | 91.7%(+8.30)#2,558 |
| 73. | Ryderwood | 100.0% | 93.2%(+6.80)#73 | 91.7%(+8.30)#2,567 |
| 74. | Snoqualmie Pass | 100.0% | 93.2%(+6.80)#74 | 91.7%(+8.30)#2,583 |
| 75. | Winthrop | 100.0% | 93.2%(+6.80)#75 | 91.7%(+8.30)#2,634 |
| 76. | Union | 100.0% | 93.2%(+6.80)#76 | 91.7%(+8.30)#2,642 |
| 77. | North Omak | 100.0% | 93.2%(+6.80)#77 | 91.7%(+8.30)#2,680 |
| 78. | Uniontown | 100.0% | 93.2%(+6.80)#78 | 91.7%(+8.30)#2,713 |
| 79. | Hamilton | 100.0% | 93.2%(+6.80)#79 | 91.7%(+8.30)#2,760 |
| 80. | Bow | 100.0% | 93.2%(+6.80)#80 | 91.7%(+8.30)#2,833 |
| 81. | South Prairie | 100.0% | 93.2%(+6.80)#81 | 91.7%(+8.30)#2,850 |
| 82. | Schwana | 100.0% | 93.2%(+6.80)#82 | 91.7%(+8.30)#2,863 |
| 83. | Malone | 100.0% | 93.2%(+6.80)#83 | 91.7%(+8.30)#2,906 |
| 84. | Outlook | 100.0% | 93.2%(+6.80)#84 | 91.7%(+8.30)#2,916 |
| 85. | North Sultan | 100.0% | 93.2%(+6.80)#85 | 91.7%(+8.30)#2,926 |
| 86. | Verlot | 100.0% | 93.2%(+6.80)#86 | 91.7%(+8.30)#2,956 |
| 87. | Jamestown | 100.0% | 93.2%(+6.80)#87 | 91.7%(+8.30)#2,975 |
| 88. | Oso | 100.0% | 93.2%(+6.80)#88 | 91.7%(+8.30)#3,058 |
| 89. | Beverly | 100.0% | 93.2%(+6.80)#89 | 91.7%(+8.30)#3,082 |
| 90. | Custer | 100.0% | 93.2%(+6.80)#90 | 91.7%(+8.30)#3,117 |
| 91. | Copalis Beach | 100.0% | 93.2%(+6.80)#91 | 91.7%(+8.30)#3,161 |
| 92. | Cohassett Beach | 100.0% | 93.2%(+6.80)#92 | 91.7%(+8.30)#3,174 |
| 93. | Keyport | 100.0% | 93.2%(+6.80)#93 | 91.7%(+8.30)#3,213 |
| 94. | Neilton | 100.0% | 93.2%(+6.80)#94 | 91.7%(+8.30)#3,249 |
| 95. | Grays River | 100.0% | 93.2%(+6.80)#95 | 91.7%(+8.30)#3,382 |
| 96. | Lyle | 100.0% | 93.2%(+6.80)#96 | 91.7%(+8.30)#3,410 |
| 97. | Ronald | 100.0% | 93.2%(+6.80)#97 | 91.7%(+8.30)#3,431 |
| 98. | Glacier | 100.0% | 93.2%(+6.80)#98 | 91.7%(+8.30)#3,511 |
| 99. | Wheeler | 100.0% | 93.2%(+6.80)#99 | 91.7%(+8.30)#3,538 |
| 100. | Maple Falls | 100.0% | 93.2%(+6.80)#100 | 91.7%(+8.30)#3,579 |
Common Questions
What are the Top 10 Cities with the Highest Percentage of Households With One or more Vehicles in Washington?
Top 10 Cities with the Highest Percentage of Households With One or more Vehicles in Washington are:
#1
100.0%
#2
100.0%
#3
100.0%
#4
100.0%
#5
100.0%
#6
100.0%
#7
100.0%
#8
100.0%
#9
100.0%
#10
100.0%
What city has the Highest Percentage of Households With One or more Vehicles in Washington?
South Creek has the Highest Percentage of Households With One or more Vehicles in Washington with 100.0%.
What is the Percentage of Households With One or more Vehicles in the State of Washington?
Percentage of Households With One or more Vehicles in Washington is 93.2%.
What is the Percentage of Households With One or more Vehicles in the United States?
Percentage of Households With One or more Vehicles in the United States is 91.7%.