Cities with the Highest Percentage of Households with Income Below $10,000 in Washington
RELATED REPORTS & OPTIONS
Household Income | $0-10k
Washington
Compare Cities
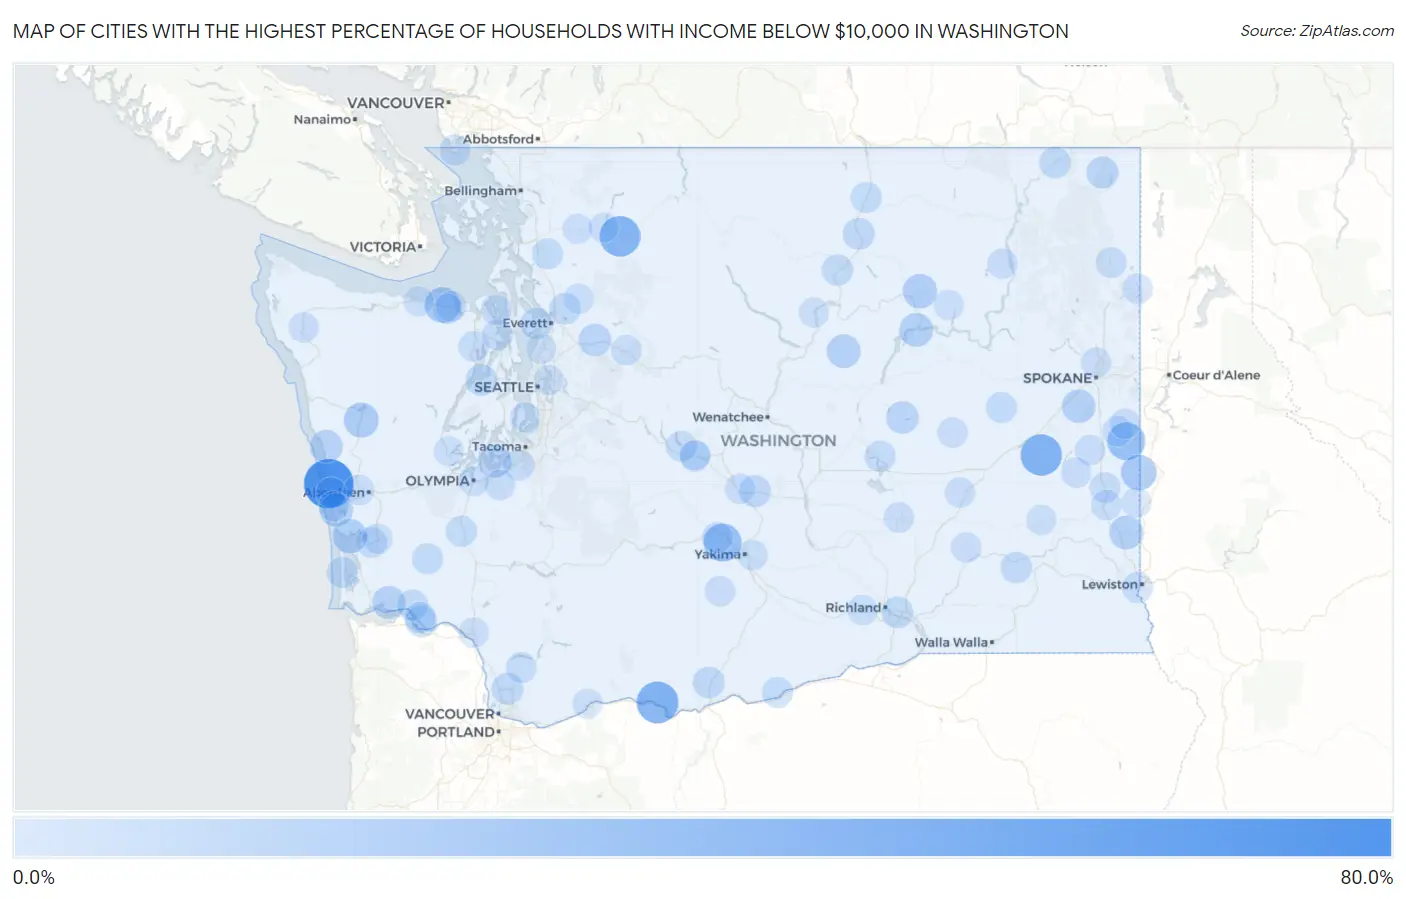
Map of Cities with the Highest Percentage of Households with Income Below $10,000 in Washington
0.0%
80.0%
Cities with the Highest Percentage of Households with Income Below $10,000 in Washington
| City | Households with Income < $10k | vs State | vs National | |
| 1. | Oyehut | 72.0% | 3.7%(+68.3)#1 | 4.9%(+67.1)#66 |
| 2. | Lyle | 45.2% | 3.7%(+41.5)#2 | 4.9%(+40.3)#220 |
| 3. | Lamont | 43.4% | 3.7%(+39.7)#3 | 4.9%(+38.5)#246 |
| 4. | Rockport | 41.2% | 3.7%(+37.5)#4 | 4.9%(+36.3)#279 |
| 5. | Cowiche | 32.7% | 3.7%(+29.0)#5 | 4.9%(+27.8)#468 |
| 6. | Latah | 32.2% | 3.7%(+28.5)#6 | 4.9%(+27.3)#484 |
| 7. | Carlsborg | 24.8% | 3.7%(+21.1)#7 | 4.9%(+19.9)#813 |
| 8. | Farmington | 24.1% | 3.7%(+20.4)#8 | 4.9%(+19.2)#856 |
| 9. | Neilton | 22.0% | 3.7%(+18.3)#9 | 4.9%(+17.1)#1,018 |
| 10. | Nespelem | 20.0% | 3.7%(+16.3)#10 | 4.9%(+15.1)#1,207 |
| 11. | Tokeland | 19.6% | 3.7%(+15.9)#11 | 4.9%(+14.7)#1,273 |
| 12. | Grand Coulee | 18.6% | 3.7%(+14.9)#12 | 4.9%(+13.7)#1,403 |
| 13. | Pullman | 18.2% | 3.7%(+14.5)#13 | 4.9%(+13.3)#1,447 |
| 14. | Mansfield | 17.9% | 3.7%(+14.2)#14 | 4.9%(+13.0)#1,506 |
| 15. | Cheney | 17.5% | 3.7%(+13.8)#15 | 4.9%(+12.6)#1,557 |
| 16. | Cohassett Beach | 17.5% | 3.7%(+13.8)#16 | 4.9%(+12.6)#1,568 |
| 17. | Crescent Bar | 16.9% | 3.7%(+13.2)#17 | 4.9%(+12.0)#1,679 |
| 18. | Rosburg | 16.1% | 3.7%(+12.4)#18 | 4.9%(+11.2)#1,849 |
| 19. | Qui Nai Elt Village | 15.4% | 3.7%(+11.7)#19 | 4.9%(+10.5)#2,017 |
| 20. | Anderson Island | 14.8% | 3.7%(+11.1)#20 | 4.9%(+9.90)#2,149 |
| 21. | North Sultan | 14.4% | 3.7%(+10.7)#21 | 4.9%(+9.50)#2,256 |
| 22. | Wilson Creek | 14.3% | 3.7%(+10.6)#22 | 4.9%(+9.40)#2,281 |
| 23. | Metaline Falls | 12.6% | 3.7%(+8.90)#23 | 4.9%(+7.70)#2,880 |
| 24. | Kittitas | 12.4% | 3.7%(+8.70)#24 | 4.9%(+7.50)#2,975 |
| 25. | Dollars Corner | 12.4% | 3.7%(+8.70)#25 | 4.9%(+7.50)#2,983 |
| 26. | Goldendale | 12.2% | 3.7%(+8.50)#26 | 4.9%(+7.30)#3,053 |
| 27. | Riverside | 11.6% | 3.7%(+7.90)#27 | 4.9%(+6.70)#3,409 |
| 28. | West Pasco | 11.4% | 3.7%(+7.70)#28 | 4.9%(+6.50)#3,495 |
| 29. | Seabeck | 11.4% | 3.7%(+7.70)#29 | 4.9%(+6.50)#3,505 |
| 30. | East Cathlamet | 11.4% | 3.7%(+7.70)#30 | 4.9%(+6.50)#3,513 |
| 31. | Lake Cassidy | 11.2% | 3.7%(+7.50)#31 | 4.9%(+6.30)#3,613 |
| 32. | Clinton | 11.2% | 3.7%(+7.50)#32 | 4.9%(+6.30)#3,621 |
| 33. | Northport | 11.2% | 3.7%(+7.50)#33 | 4.9%(+6.30)#3,632 |
| 34. | Starbuck | 11.1% | 3.7%(+7.40)#34 | 4.9%(+6.20)#3,683 |
| 35. | Malott | 10.7% | 3.7%(+7.00)#35 | 4.9%(+5.80)#3,937 |
| 36. | Fords Prairie | 10.2% | 3.7%(+6.50)#36 | 4.9%(+5.30)#4,258 |
| 37. | Ocean Park | 10.1% | 3.7%(+6.40)#37 | 4.9%(+5.20)#4,328 |
| 38. | Moses Lake North | 9.9% | 3.7%(+6.20)#38 | 4.9%(+5.00)#4,445 |
| 39. | Big Lake | 9.9% | 3.7%(+6.20)#39 | 4.9%(+5.00)#4,457 |
| 40. | Harrington | 9.7% | 3.7%(+6.00)#40 | 4.9%(+4.80)#4,649 |
| 41. | Skamokawa Valley | 9.7% | 3.7%(+6.00)#41 | 4.9%(+4.80)#4,654 |
| 42. | Tonasket | 9.6% | 3.7%(+5.90)#42 | 4.9%(+4.70)#4,712 |
| 43. | Roosevelt | 9.6% | 3.7%(+5.90)#43 | 4.9%(+4.70)#4,741 |
| 44. | Pe Ell | 9.4% | 3.7%(+5.70)#44 | 4.9%(+4.50)#4,889 |
| 45. | Lower Elochoman | 9.4% | 3.7%(+5.70)#45 | 4.9%(+4.50)#4,894 |
| 46. | Mcchord Afb | 9.3% | 3.7%(+5.60)#46 | 4.9%(+4.40)#4,941 |
| 47. | South Bend | 9.3% | 3.7%(+5.60)#47 | 4.9%(+4.40)#4,952 |
| 48. | Point Roberts | 9.3% | 3.7%(+5.60)#48 | 4.9%(+4.40)#4,961 |
| 49. | South Cle Elum | 9.3% | 3.7%(+5.60)#49 | 4.9%(+4.40)#4,975 |
| 50. | West Clarkston Highland | 9.2% | 3.7%(+5.50)#50 | 4.9%(+4.30)#5,018 |
| 51. | Roslyn | 9.0% | 3.7%(+5.30)#51 | 4.9%(+4.10)#5,278 |
| 52. | Quilcene | 9.0% | 3.7%(+5.30)#52 | 4.9%(+4.10)#5,286 |
| 53. | Amboy | 8.8% | 3.7%(+5.10)#53 | 4.9%(+3.90)#5,463 |
| 54. | Port Ludlow | 8.6% | 3.7%(+4.90)#54 | 4.9%(+3.70)#5,681 |
| 55. | Cusick | 8.6% | 3.7%(+4.90)#55 | 4.9%(+3.70)#5,740 |
| 56. | Tieton | 8.5% | 3.7%(+4.80)#56 | 4.9%(+3.60)#5,802 |
| 57. | Steptoe | 8.5% | 3.7%(+4.80)#57 | 4.9%(+3.60)#5,872 |
| 58. | Marrowstone | 8.3% | 3.7%(+4.60)#58 | 4.9%(+3.40)#6,044 |
| 59. | Terrace Heights | 8.1% | 3.7%(+4.40)#59 | 4.9%(+3.20)#6,220 |
| 60. | Othello | 8.1% | 3.7%(+4.40)#60 | 4.9%(+3.20)#6,224 |
| 61. | Waverly | 8.1% | 3.7%(+4.40)#61 | 4.9%(+3.20)#6,313 |
| 62. | Hoquiam | 8.0% | 3.7%(+4.30)#62 | 4.9%(+3.10)#6,333 |
| 63. | Roche Harbor | 8.0% | 3.7%(+4.30)#63 | 4.9%(+3.10)#6,390 |
| 64. | Sequim | 7.9% | 3.7%(+4.20)#64 | 4.9%(+3.00)#6,465 |
| 65. | Newport | 7.9% | 3.7%(+4.20)#65 | 4.9%(+3.00)#6,495 |
| 66. | White Swan | 7.8% | 3.7%(+4.10)#66 | 4.9%(+2.90)#6,668 |
| 67. | Odessa | 7.7% | 3.7%(+4.00)#67 | 4.9%(+2.80)#6,781 |
| 68. | Nisqually Indian Community | 7.7% | 3.7%(+4.00)#68 | 4.9%(+2.80)#6,788 |
| 69. | Malden | 7.7% | 3.7%(+4.00)#69 | 4.9%(+2.80)#6,813 |
| 70. | Ellensburg | 7.5% | 3.7%(+3.80)#70 | 4.9%(+2.60)#7,008 |
| 71. | Colfax | 7.5% | 3.7%(+3.80)#71 | 4.9%(+2.60)#7,049 |
| 72. | Inchelium | 7.5% | 3.7%(+3.80)#72 | 4.9%(+2.60)#7,115 |
| 73. | Kahlotus | 7.5% | 3.7%(+3.80)#73 | 4.9%(+2.60)#7,135 |
| 74. | Index | 7.5% | 3.7%(+3.80)#74 | 4.9%(+2.60)#7,136 |
| 75. | Raymond | 7.4% | 3.7%(+3.70)#75 | 4.9%(+2.50)#7,197 |
| 76. | Fairfield | 7.4% | 3.7%(+3.70)#76 | 4.9%(+2.50)#7,246 |
| 77. | Benton City | 7.3% | 3.7%(+3.60)#77 | 4.9%(+2.40)#7,336 |
| 78. | St John | 7.3% | 3.7%(+3.60)#78 | 4.9%(+2.40)#7,389 |
| 79. | Country Homes | 7.2% | 3.7%(+3.50)#79 | 4.9%(+2.30)#7,471 |
| 80. | Forks | 7.2% | 3.7%(+3.50)#80 | 4.9%(+2.30)#7,486 |
| 81. | River Road | 7.2% | 3.7%(+3.50)#81 | 4.9%(+2.30)#7,546 |
| 82. | Lind | 7.2% | 3.7%(+3.50)#82 | 4.9%(+2.30)#7,560 |
| 83. | Ocean Shores | 7.1% | 3.7%(+3.40)#83 | 4.9%(+2.20)#7,625 |
| 84. | Canyon Creek | 7.1% | 3.7%(+3.40)#84 | 4.9%(+2.20)#7,635 |
| 85. | Lacrosse | 7.1% | 3.7%(+3.40)#85 | 4.9%(+2.20)#7,707 |
| 86. | Cle Elum | 6.9% | 3.7%(+3.20)#86 | 4.9%(+2.00)#7,958 |
| 87. | Olympia | 6.8% | 3.7%(+3.10)#87 | 4.9%(+1.90)#8,052 |
| 88. | Lynnwood | 6.8% | 3.7%(+3.10)#88 | 4.9%(+1.90)#8,053 |
| 89. | Kelso | 6.8% | 3.7%(+3.10)#89 | 4.9%(+1.90)#8,075 |
| 90. | Vashon | 6.8% | 3.7%(+3.10)#90 | 4.9%(+1.90)#8,080 |
| 91. | Shelton | 6.8% | 3.7%(+3.10)#91 | 4.9%(+1.90)#8,082 |
| 92. | Concrete | 6.8% | 3.7%(+3.10)#92 | 4.9%(+1.90)#8,179 |
| 93. | Keller | 6.8% | 3.7%(+3.10)#93 | 4.9%(+1.90)#8,215 |
| 94. | Port Angeles East | 6.7% | 3.7%(+3.00)#94 | 4.9%(+1.80)#8,286 |
| 95. | Westport | 6.7% | 3.7%(+3.00)#95 | 4.9%(+1.80)#8,293 |
| 96. | Pateros | 6.7% | 3.7%(+3.00)#96 | 4.9%(+1.80)#8,333 |
| 97. | Hamilton | 6.7% | 3.7%(+3.00)#97 | 4.9%(+1.80)#8,347 |
| 98. | Stevenson | 6.6% | 3.7%(+2.90)#98 | 4.9%(+1.70)#8,457 |
| 99. | Palouse | 6.6% | 3.7%(+2.90)#99 | 4.9%(+1.70)#8,476 |
| 100. | Hunts Point | 6.6% | 3.7%(+2.90)#100 | 4.9%(+1.70)#8,516 |
Common Questions
What are the Top 10 Cities with the Highest Percentage of Households with Income Below $10,000 in Washington?
Top 10 Cities with the Highest Percentage of Households with Income Below $10,000 in Washington are:
What city has the Highest Percentage of Households with Income Below $10,000 in Washington?
Oyehut has the Highest Percentage of Households with Income Below $10,000 in Washington with 72.0%.
What is the Percentage of Households with Income Below $10,000 in the State of Washington?
Percentage of Households with Income Below $10,000 in Washington is 3.7%.
What is the Percentage of Households with Income Below $10,000 in the United States?
Percentage of Households with Income Below $10,000 in the United States is 4.9%.