Cities with the Lowest Percentage of Renter-Occupied Units in Washington
RELATED REPORTS & OPTIONS
Lowest Renter-Occupied
Washington
Compare Cities
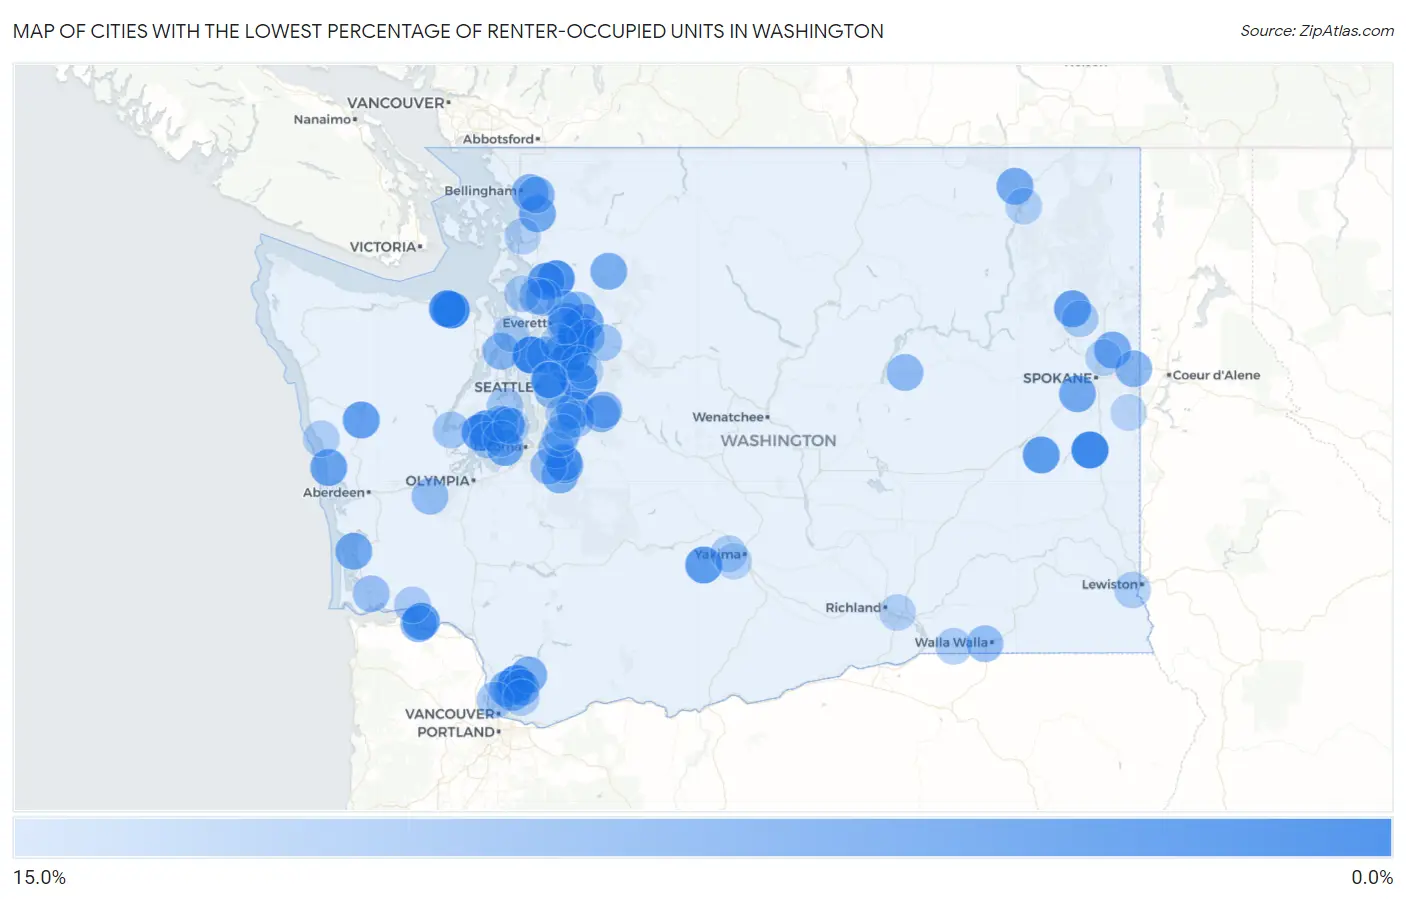
Map of Cities with the Lowest Percentage of Renter-Occupied Units in Washington
15.0%
0.0%
Cities with the Lowest Percentage of Renter-Occupied Units in Washington
| City | % Renter-Occupied | vs State | vs National | |
| 1. | Monroe North | 0.99% | 36.2%(-35.2)#1 | 35.2%(-34.2)#58 |
| 2. | Woodway | 1.2% | 36.2%(-35.0)#2 | 35.2%(-34.0)#79 |
| 3. | Bell Hill | 1.4% | 36.2%(-34.8)#3 | 35.2%(-33.8)#105 |
| 4. | Clear Lake Cdp Pierce County | 1.5% | 36.2%(-34.7)#4 | 35.2%(-33.7)#118 |
| 5. | Malden | 1.5% | 36.2%(-34.7)#5 | 35.2%(-33.6)#131 |
| 6. | Lewisville | 1.6% | 36.2%(-34.6)#6 | 35.2%(-33.6)#139 |
| 7. | Ames Lake | 2.3% | 36.2%(-33.9)#7 | 35.2%(-32.9)#293 |
| 8. | Bryant | 2.6% | 36.2%(-33.6)#8 | 35.2%(-32.6)#394 |
| 9. | River Road | 2.7% | 36.2%(-33.5)#9 | 35.2%(-32.5)#421 |
| 10. | Suncrest | 3.6% | 36.2%(-32.6)#10 | 35.2%(-31.6)#698 |
| 11. | Vaughn | 3.7% | 36.2%(-32.5)#11 | 35.2%(-31.5)#737 |
| 12. | Canterwood | 3.7% | 36.2%(-32.5)#12 | 35.2%(-31.4)#761 |
| 13. | East Cathlamet | 3.8% | 36.2%(-32.4)#13 | 35.2%(-31.4)#784 |
| 14. | High Bridge | 3.8% | 36.2%(-32.4)#14 | 35.2%(-31.4)#788 |
| 15. | Tampico | 3.8% | 36.2%(-32.4)#15 | 35.2%(-31.3)#794 |
| 16. | Lamont | 3.9% | 36.2%(-32.3)#16 | 35.2%(-31.2)#830 |
| 17. | Grapeview | 4.0% | 36.2%(-32.2)#17 | 35.2%(-31.2)#849 |
| 18. | Sunday Lake | 4.1% | 36.2%(-32.2)#18 | 35.2%(-31.1)#856 |
| 19. | Three Lakes | 4.2% | 36.2%(-32.0)#19 | 35.2%(-31.0)#915 |
| 20. | Neilton | 4.4% | 36.2%(-31.8)#20 | 35.2%(-30.8)#965 |
| 21. | Loon Lake | 4.5% | 36.2%(-31.7)#21 | 35.2%(-30.7)#996 |
| 22. | Copalis Beach | 4.7% | 36.2%(-31.5)#22 | 35.2%(-30.4)#1,113 |
| 23. | Fox Island | 5.0% | 36.2%(-31.2)#23 | 35.2%(-30.2)#1,212 |
| 24. | Crescent Bar | 5.4% | 36.2%(-30.8)#24 | 35.2%(-29.8)#1,390 |
| 25. | Lake Roesiger | 5.4% | 36.2%(-30.8)#25 | 35.2%(-29.8)#1,394 |
| 26. | Four Lakes | 5.4% | 36.2%(-30.8)#26 | 35.2%(-29.7)#1,402 |
| 27. | Tehaleh | 5.5% | 36.2%(-30.7)#27 | 35.2%(-29.7)#1,425 |
| 28. | Mirrormont | 5.5% | 36.2%(-30.7)#28 | 35.2%(-29.6)#1,451 |
| 29. | Alger | 5.6% | 36.2%(-30.6)#29 | 35.2%(-29.6)#1,487 |
| 30. | Cavalero | 5.6% | 36.2%(-30.6)#30 | 35.2%(-29.6)#1,494 |
| 31. | Bay Center | 5.7% | 36.2%(-30.5)#31 | 35.2%(-29.5)#1,527 |
| 32. | Green Bluff | 5.8% | 36.2%(-30.4)#32 | 35.2%(-29.4)#1,570 |
| 33. | Barstow | 5.9% | 36.2%(-30.3)#33 | 35.2%(-29.3)#1,602 |
| 34. | Maltby | 6.1% | 36.2%(-30.1)#34 | 35.2%(-29.1)#1,696 |
| 35. | Swede Heaven | 6.2% | 36.2%(-30.0)#35 | 35.2%(-29.0)#1,727 |
| 36. | Meadow Glade | 6.3% | 36.2%(-29.9)#36 | 35.2%(-28.8)#1,780 |
| 37. | Crocker | 6.4% | 36.2%(-29.9)#37 | 35.2%(-28.8)#1,788 |
| 38. | Dollars Corner | 6.4% | 36.2%(-29.9)#38 | 35.2%(-28.8)#1,789 |
| 39. | Yacolt | 6.5% | 36.2%(-29.8)#39 | 35.2%(-28.7)#1,835 |
| 40. | South Prairie | 6.5% | 36.2%(-29.7)#40 | 35.2%(-28.7)#1,855 |
| 41. | Prairie Heights | 6.7% | 36.2%(-29.5)#41 | 35.2%(-28.5)#1,927 |
| 42. | Geneva | 6.7% | 36.2%(-29.5)#42 | 35.2%(-28.5)#1,928 |
| 43. | Wilderness Rim | 6.7% | 36.2%(-29.5)#43 | 35.2%(-28.5)#1,932 |
| 44. | Venersborg | 6.7% | 36.2%(-29.5)#44 | 35.2%(-28.4)#1,941 |
| 45. | Sudden Valley | 6.8% | 36.2%(-29.4)#45 | 35.2%(-28.4)#1,975 |
| 46. | Otis Orchards East Farms | 7.0% | 36.2%(-29.2)#46 | 35.2%(-28.2)#2,050 |
| 47. | Puget Island | 7.0% | 36.2%(-29.2)#47 | 35.2%(-28.1)#2,076 |
| 48. | Chain Lake | 7.1% | 36.2%(-29.1)#48 | 35.2%(-28.1)#2,105 |
| 49. | Lofall | 7.1% | 36.2%(-29.1)#49 | 35.2%(-28.1)#2,113 |
| 50. | Beaux Arts Village | 7.3% | 36.2%(-28.9)#50 | 35.2%(-27.9)#2,202 |
| 51. | Clyde Hill | 7.4% | 36.2%(-28.9)#51 | 35.2%(-27.8)#2,229 |
| 52. | Lake Bosworth | 7.6% | 36.2%(-28.6)#52 | 35.2%(-27.6)#2,333 |
| 53. | Hartline | 7.6% | 36.2%(-28.6)#53 | 35.2%(-27.6)#2,355 |
| 54. | Riverbend | 7.7% | 36.2%(-28.5)#54 | 35.2%(-27.5)#2,375 |
| 55. | Lake Tapps | 7.8% | 36.2%(-28.5)#55 | 35.2%(-27.4)#2,442 |
| 56. | Riverpoint | 7.9% | 36.2%(-28.4)#56 | 35.2%(-27.3)#2,485 |
| 57. | Woods Creek | 7.9% | 36.2%(-28.3)#57 | 35.2%(-27.3)#2,492 |
| 58. | Brier | 8.0% | 36.2%(-28.2)#58 | 35.2%(-27.2)#2,553 |
| 59. | Lake Cassidy | 8.0% | 36.2%(-28.2)#59 | 35.2%(-27.2)#2,556 |
| 60. | Garrett | 8.1% | 36.2%(-28.1)#60 | 35.2%(-27.1)#2,583 |
| 61. | Porter | 8.1% | 36.2%(-28.1)#61 | 35.2%(-27.1)#2,592 |
| 62. | Mcmillin | 8.1% | 36.2%(-28.1)#62 | 35.2%(-27.0)#2,609 |
| 63. | Cottage Lake | 8.2% | 36.2%(-28.0)#63 | 35.2%(-27.0)#2,640 |
| 64. | Yarrow Point | 8.3% | 36.2%(-27.9)#64 | 35.2%(-26.9)#2,677 |
| 65. | Naselle | 8.4% | 36.2%(-27.8)#65 | 35.2%(-26.7)#2,741 |
| 66. | Lake Goodwin | 8.4% | 36.2%(-27.8)#66 | 35.2%(-26.7)#2,754 |
| 67. | Lake Holm | 8.5% | 36.2%(-27.7)#67 | 35.2%(-26.7)#2,777 |
| 68. | Hobart | 8.8% | 36.2%(-27.5)#68 | 35.2%(-26.4)#2,916 |
| 69. | Home | 8.8% | 36.2%(-27.4)#69 | 35.2%(-26.3)#2,957 |
| 70. | Felida | 8.9% | 36.2%(-27.4)#70 | 35.2%(-26.3)#2,960 |
| 71. | Kayak Point | 8.9% | 36.2%(-27.3)#71 | 35.2%(-26.3)#2,975 |
| 72. | Union | 9.0% | 36.2%(-27.2)#72 | 35.2%(-26.2)#3,048 |
| 73. | Startup | 9.0% | 36.2%(-27.2)#73 | 35.2%(-26.2)#3,056 |
| 74. | Duvall | 9.2% | 36.2%(-27.0)#74 | 35.2%(-26.0)#3,172 |
| 75. | Bethel | 9.2% | 36.2%(-27.0)#75 | 35.2%(-26.0)#3,180 |
| 76. | Camano | 9.5% | 36.2%(-26.7)#76 | 35.2%(-25.7)#3,311 |
| 77. | Clayton | 9.6% | 36.2%(-26.6)#77 | 35.2%(-25.6)#3,382 |
| 78. | Skamokawa Valley | 9.7% | 36.2%(-26.5)#78 | 35.2%(-25.5)#3,424 |
| 79. | Maple Heights Lake Desire | 9.8% | 36.2%(-26.4)#79 | 35.2%(-25.4)#3,466 |
| 80. | Wauna | 9.8% | 36.2%(-26.4)#80 | 35.2%(-25.4)#3,472 |
| 81. | Clarkston Heights Vineland | 9.8% | 36.2%(-26.4)#81 | 35.2%(-25.3)#3,490 |
| 82. | Shadow Lake | 9.9% | 36.2%(-26.3)#82 | 35.2%(-25.3)#3,512 |
| 83. | Summitview | 9.9% | 36.2%(-26.3)#83 | 35.2%(-25.3)#3,539 |
| 84. | Touchet | 9.9% | 36.2%(-26.3)#84 | 35.2%(-25.2)#3,545 |
| 85. | Hockinson | 9.9% | 36.2%(-26.3)#85 | 35.2%(-25.2)#3,549 |
| 86. | Hansville | 10.0% | 36.2%(-26.3)#86 | 35.2%(-25.2)#3,553 |
| 87. | Santiago | 10.0% | 36.2%(-26.2)#87 | 35.2%(-25.2)#3,591 |
| 88. | Silver Firs | 10.1% | 36.2%(-26.1)#88 | 35.2%(-25.1)#3,647 |
| 89. | Marcus | 10.1% | 36.2%(-26.1)#89 | 35.2%(-25.1)#3,667 |
| 90. | Bunk Foss | 10.2% | 36.2%(-26.1)#90 | 35.2%(-25.0)#3,683 |
| 91. | Mead | 10.2% | 36.2%(-26.0)#91 | 35.2%(-25.0)#3,711 |
| 92. | Hunts Point | 10.3% | 36.2%(-25.9)#92 | 35.2%(-24.9)#3,744 |
| 93. | West Pasco | 10.3% | 36.2%(-25.9)#93 | 35.2%(-24.9)#3,747 |
| 94. | Bay View | 10.4% | 36.2%(-25.8)#94 | 35.2%(-24.8)#3,807 |
| 95. | Artondale | 10.5% | 36.2%(-25.7)#95 | 35.2%(-24.7)#3,832 |
| 96. | Lake Marcel Stillwater | 10.5% | 36.2%(-25.7)#96 | 35.2%(-24.6)#3,870 |
| 97. | Maplewood | 10.6% | 36.2%(-25.7)#97 | 35.2%(-24.6)#3,872 |
| 98. | Lake Morton Berrydale | 10.6% | 36.2%(-25.6)#98 | 35.2%(-24.6)#3,900 |
| 99. | Rockford | 10.6% | 36.2%(-25.6)#99 | 35.2%(-24.5)#3,912 |
| 100. | Ahtanum | 10.7% | 36.2%(-25.5)#100 | 35.2%(-24.5)#3,943 |
Common Questions
What are the Top 10 Cities with the Lowest Percentage of Renter-Occupied Units in Washington?
Top 10 Cities with the Lowest Percentage of Renter-Occupied Units in Washington are:
#1
0.99%
#2
1.2%
#3
1.4%
#4
1.5%
#5
1.6%
#6
2.3%
#7
2.6%
#8
2.7%
#9
3.7%
#10
3.7%
What city has the Lowest Percentage of Renter-Occupied Units in Washington?
Monroe North has the Lowest Percentage of Renter-Occupied Units in Washington with 0.99%.
What is the Percentage of Renter-Occupied Units in the State of Washington?
Percentage of Renter-Occupied Units in Washington is 36.2%.
What is the Percentage of Renter-Occupied Units in the United States?
Percentage of Renter-Occupied Units in the United States is 35.2%.