Cities with the Highest Percentage of Population with a Degree in Social Sciences in Washington
RELATED REPORTS & OPTIONS
Social Sciences
Washington
Compare Cities
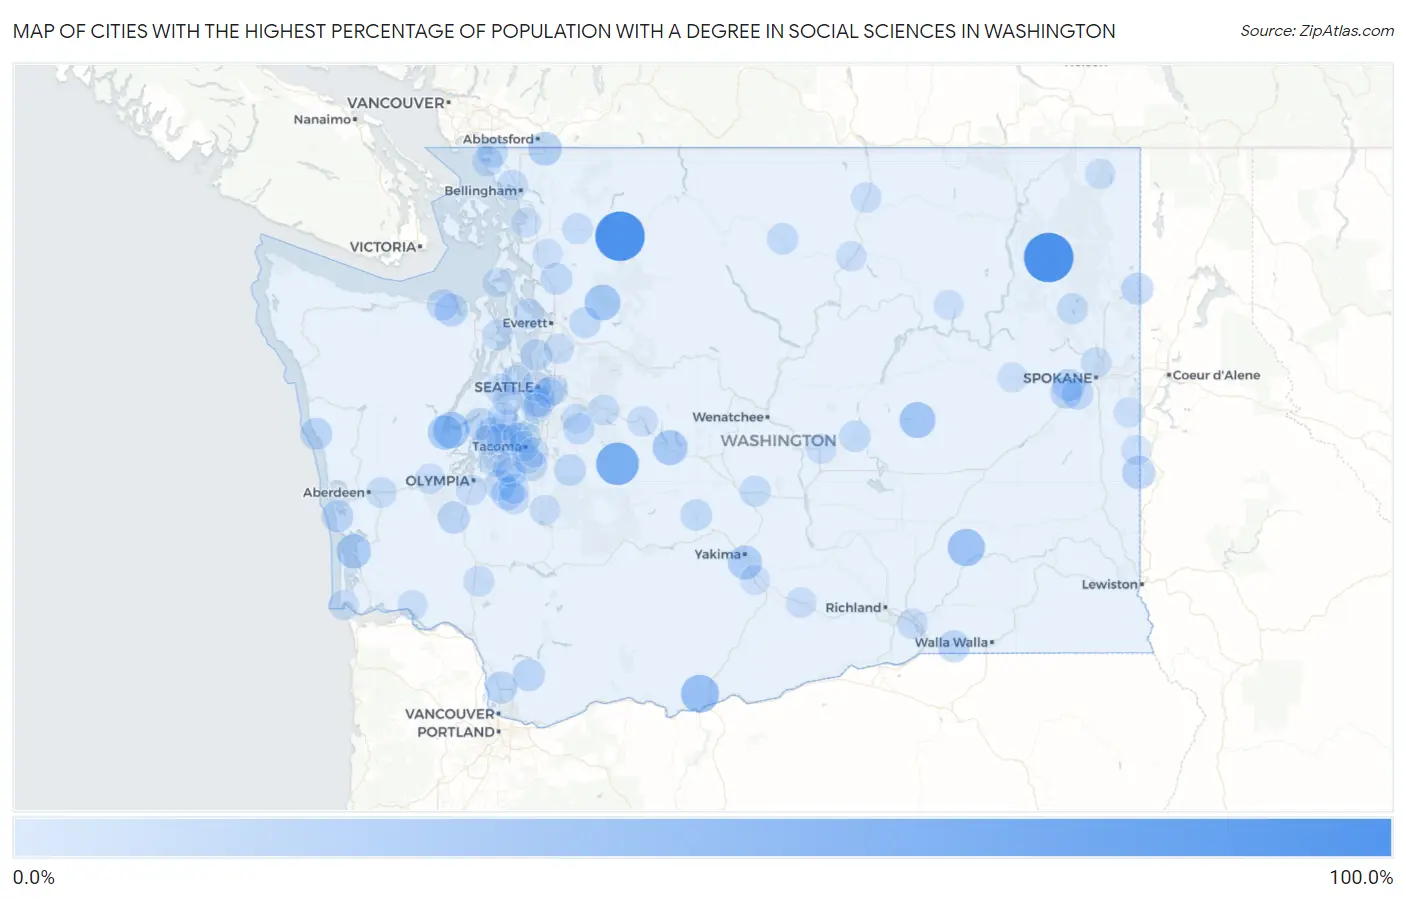
Map of Cities with the Highest Percentage of Population with a Degree in Social Sciences in Washington
0.0%
100.0%
Cities with the Highest Percentage of Population with a Degree in Social Sciences in Washington
| City | % Graduates | vs State | vs National | |
| 1. | Rockport | 100.0% | 9.3%(+90.7)#1 | 8.1%(+91.9)#46 |
| 2. | Addy | 100.0% | 9.3%(+90.7)#2 | 8.1%(+91.9)#57 |
| 3. | Greenwater | 67.5% | 9.3%(+58.2)#3 | 8.1%(+59.4)#89 |
| 4. | Centerville | 46.4% | 9.3%(+37.1)#4 | 8.1%(+38.4)#234 |
| 5. | Kahlotus | 42.9% | 9.3%(+33.6)#5 | 8.1%(+34.8)#269 |
| 6. | Union | 38.7% | 9.3%(+29.4)#6 | 8.1%(+30.7)#334 |
| 7. | Krupp Marlin | 37.5% | 9.3%(+28.2)#7 | 8.1%(+29.4)#355 |
| 8. | Verlot | 36.3% | 9.3%(+27.0)#8 | 8.1%(+28.2)#377 |
| 9. | Easton | 33.3% | 9.3%(+24.0)#9 | 8.1%(+25.3)#432 |
| 10. | Skokomish | 31.0% | 9.3%(+21.7)#10 | 8.1%(+22.9)#500 |
| 11. | Bay Center | 30.3% | 9.3%(+21.0)#11 | 8.1%(+22.2)#526 |
| 12. | Union Gap | 28.7% | 9.3%(+19.4)#12 | 8.1%(+20.6)#593 |
| 13. | Sumas | 27.9% | 9.3%(+18.6)#13 | 8.1%(+19.8)#640 |
| 14. | Erlands Point | 27.7% | 9.3%(+18.4)#14 | 8.1%(+19.6)#651 |
| 15. | Farmington | 25.0% | 9.3%(+15.7)#15 | 8.1%(+16.9)#826 |
| 16. | Bell Hill | 24.2% | 9.3%(+14.9)#16 | 8.1%(+16.1)#883 |
| 17. | North Yelm | 22.5% | 9.3%(+13.2)#17 | 8.1%(+14.5)#999 |
| 18. | Crescent Bar | 21.5% | 9.3%(+12.2)#18 | 8.1%(+13.4)#1,120 |
| 19. | Yacolt | 21.2% | 9.3%(+12.0)#19 | 8.1%(+13.2)#1,150 |
| 20. | Fairchild Afb | 21.0% | 9.3%(+11.7)#20 | 8.1%(+13.0)#1,179 |
| 21. | Grayland | 20.9% | 9.3%(+11.6)#21 | 8.1%(+12.8)#1,202 |
| 22. | Beacon Hill | 20.8% | 9.3%(+11.5)#22 | 8.1%(+12.7)#1,210 |
| 23. | Rochester | 20.6% | 9.3%(+11.3)#23 | 8.1%(+12.6)#1,225 |
| 24. | Medical Lake | 20.4% | 9.3%(+11.1)#24 | 8.1%(+12.3)#1,256 |
| 25. | Duluth | 20.2% | 9.3%(+10.9)#25 | 8.1%(+12.1)#1,273 |
| 26. | Newport | 20.1% | 9.3%(+10.8)#26 | 8.1%(+12.0)#1,282 |
| 27. | Taholah | 20.0% | 9.3%(+10.7)#27 | 8.1%(+11.9)#1,289 |
| 28. | Touchet | 20.0% | 9.3%(+10.7)#28 | 8.1%(+11.9)#1,295 |
| 29. | Bryant | 19.7% | 9.3%(+10.4)#29 | 8.1%(+11.7)#1,365 |
| 30. | Allyn | 19.4% | 9.3%(+10.1)#30 | 8.1%(+11.3)#1,413 |
| 31. | Clover Creek | 19.2% | 9.3%(+9.94)#31 | 8.1%(+11.2)#1,437 |
| 32. | Four Lakes | 19.0% | 9.3%(+9.71)#32 | 8.1%(+10.9)#1,478 |
| 33. | Wilkeson | 18.8% | 9.3%(+9.46)#33 | 8.1%(+10.7)#1,517 |
| 34. | Esperance | 18.7% | 9.3%(+9.41)#34 | 8.1%(+10.6)#1,527 |
| 35. | Nile | 18.4% | 9.3%(+9.07)#35 | 8.1%(+10.3)#1,582 |
| 36. | Carlsborg | 18.4% | 9.3%(+9.06)#36 | 8.1%(+10.3)#1,585 |
| 37. | Nisqually Indian Community | 18.3% | 9.3%(+9.04)#37 | 8.1%(+10.3)#1,587 |
| 38. | Ephrata | 18.2% | 9.3%(+8.91)#38 | 8.1%(+10.1)#1,603 |
| 39. | Lake Roesiger | 17.8% | 9.3%(+8.52)#39 | 8.1%(+9.74)#1,687 |
| 40. | Browns Point | 17.5% | 9.3%(+8.16)#40 | 8.1%(+9.38)#1,751 |
| 41. | Winthrop | 17.4% | 9.3%(+8.10)#41 | 8.1%(+9.32)#1,763 |
| 42. | Ravensdale | 17.2% | 9.3%(+7.95)#42 | 8.1%(+9.17)#1,792 |
| 43. | Loon Lake | 16.4% | 9.3%(+7.12)#43 | 8.1%(+8.34)#2,005 |
| 44. | Anderson Island | 16.4% | 9.3%(+7.07)#44 | 8.1%(+8.29)#2,014 |
| 45. | Kittitas | 16.2% | 9.3%(+6.88)#45 | 8.1%(+8.10)#2,056 |
| 46. | Boulevard Park | 16.1% | 9.3%(+6.83)#46 | 8.1%(+8.06)#2,069 |
| 47. | Blaine | 15.8% | 9.3%(+6.54)#47 | 8.1%(+7.76)#2,144 |
| 48. | Port Ludlow | 15.2% | 9.3%(+5.94)#48 | 8.1%(+7.16)#2,330 |
| 49. | Wollochet | 15.1% | 9.3%(+5.83)#49 | 8.1%(+7.05)#2,358 |
| 50. | Key Center | 15.1% | 9.3%(+5.82)#50 | 8.1%(+7.04)#2,360 |
| 51. | Toledo | 15.1% | 9.3%(+5.80)#51 | 8.1%(+7.02)#2,367 |
| 52. | Hamilton | 15.1% | 9.3%(+5.77)#52 | 8.1%(+7.00)#2,377 |
| 53. | Mckenna | 15.0% | 9.3%(+5.71)#53 | 8.1%(+6.93)#2,400 |
| 54. | White Center | 15.0% | 9.3%(+5.66)#54 | 8.1%(+6.88)#2,417 |
| 55. | Birch Bay | 14.9% | 9.3%(+5.58)#55 | 8.1%(+6.80)#2,441 |
| 56. | Central Park | 14.8% | 9.3%(+5.55)#56 | 8.1%(+6.77)#2,452 |
| 57. | Country Homes | 14.8% | 9.3%(+5.52)#57 | 8.1%(+6.74)#2,467 |
| 58. | Riverbend | 14.7% | 9.3%(+5.41)#58 | 8.1%(+6.63)#2,497 |
| 59. | Langley | 14.6% | 9.3%(+5.30)#59 | 8.1%(+6.52)#2,535 |
| 60. | Rocky Point | 14.6% | 9.3%(+5.29)#60 | 8.1%(+6.51)#2,537 |
| 61. | Canterwood | 14.5% | 9.3%(+5.26)#61 | 8.1%(+6.48)#2,547 |
| 62. | Finley | 14.4% | 9.3%(+5.11)#62 | 8.1%(+6.34)#2,595 |
| 63. | Burley | 14.4% | 9.3%(+5.09)#63 | 8.1%(+6.31)#2,598 |
| 64. | Marietta Alderwood | 14.3% | 9.3%(+4.99)#64 | 8.1%(+6.21)#2,620 |
| 65. | Tumwater | 14.3% | 9.3%(+4.97)#65 | 8.1%(+6.20)#2,683 |
| 66. | Beaux Arts Village | 14.0% | 9.3%(+4.75)#66 | 8.1%(+5.97)#2,749 |
| 67. | Snoqualmie Pass | 13.9% | 9.3%(+4.61)#67 | 8.1%(+5.83)#2,807 |
| 68. | Tonasket | 13.9% | 9.3%(+4.59)#68 | 8.1%(+5.82)#2,810 |
| 69. | Quincy | 13.8% | 9.3%(+4.54)#69 | 8.1%(+5.76)#2,826 |
| 70. | Clearview | 13.8% | 9.3%(+4.50)#70 | 8.1%(+5.72)#2,850 |
| 71. | Fort Lewis | 13.5% | 9.3%(+4.17)#71 | 8.1%(+5.39)#2,997 |
| 72. | Eatonville | 13.3% | 9.3%(+4.04)#72 | 8.1%(+5.26)#3,052 |
| 73. | Okanogan | 13.3% | 9.3%(+3.97)#73 | 8.1%(+5.19)#3,100 |
| 74. | Tekoa | 13.2% | 9.3%(+3.94)#74 | 8.1%(+5.16)#3,120 |
| 75. | Mccleary | 13.2% | 9.3%(+3.86)#75 | 8.1%(+5.09)#3,157 |
| 76. | Bainbridge Island | 13.0% | 9.3%(+3.74)#76 | 8.1%(+4.97)#3,230 |
| 77. | Sunnyside | 13.0% | 9.3%(+3.67)#77 | 8.1%(+4.90)#3,260 |
| 78. | Artondale | 12.9% | 9.3%(+3.65)#78 | 8.1%(+4.88)#3,271 |
| 79. | Ilwaco | 12.9% | 9.3%(+3.58)#79 | 8.1%(+4.80)#3,311 |
| 80. | Parkwood | 12.8% | 9.3%(+3.53)#80 | 8.1%(+4.75)#3,335 |
| 81. | Seattle | 12.7% | 9.3%(+3.45)#81 | 8.1%(+4.67)#3,381 |
| 82. | Roy | 12.6% | 9.3%(+3.32)#82 | 8.1%(+4.54)#3,448 |
| 83. | Mercer Island | 12.6% | 9.3%(+3.30)#83 | 8.1%(+4.52)#3,458 |
| 84. | North Fort Lewis | 12.5% | 9.3%(+3.23)#84 | 8.1%(+4.45)#3,489 |
| 85. | Wapato | 12.5% | 9.3%(+3.21)#85 | 8.1%(+4.43)#3,504 |
| 86. | Metaline | 12.5% | 9.3%(+3.21)#86 | 8.1%(+4.43)#3,559 |
| 87. | Edison | 12.4% | 9.3%(+3.07)#87 | 8.1%(+4.29)#3,624 |
| 88. | Rockford | 12.3% | 9.3%(+3.05)#88 | 8.1%(+4.27)#3,641 |
| 89. | Skamokawa Valley | 12.3% | 9.3%(+2.99)#89 | 8.1%(+4.21)#3,672 |
| 90. | Midland | 12.2% | 9.3%(+2.88)#90 | 8.1%(+4.11)#3,726 |
| 91. | Ruston | 12.1% | 9.3%(+2.84)#91 | 8.1%(+4.06)#3,748 |
| 92. | Home | 12.0% | 9.3%(+2.68)#92 | 8.1%(+3.90)#3,840 |
| 93. | Tacoma | 12.0% | 9.3%(+2.67)#93 | 8.1%(+3.89)#3,843 |
| 94. | Big Lake | 12.0% | 9.3%(+2.67)#94 | 8.1%(+3.89)#3,848 |
| 95. | Hobart | 11.9% | 9.3%(+2.64)#95 | 8.1%(+3.86)#3,860 |
| 96. | Burien | 11.8% | 9.3%(+2.53)#96 | 8.1%(+3.75)#3,916 |
| 97. | Waller | 11.8% | 9.3%(+2.50)#97 | 8.1%(+3.73)#3,928 |
| 98. | Coupeville | 11.8% | 9.3%(+2.50)#98 | 8.1%(+3.72)#3,933 |
| 99. | Davenport | 11.8% | 9.3%(+2.47)#99 | 8.1%(+3.69)#3,949 |
| 100. | Keller | 11.8% | 9.3%(+2.47)#100 | 8.1%(+3.69)#3,964 |
Common Questions
What are the Top 10 Cities with the Highest Percentage of Population with a Degree in Social Sciences in Washington?
Top 10 Cities with the Highest Percentage of Population with a Degree in Social Sciences in Washington are:
#1
100.0%
#2
100.0%
#3
67.5%
#4
46.4%
#5
42.9%
#6
38.7%
#7
37.5%
#8
36.3%
#9
33.3%
#10
31.0%
What city has the Highest Percentage of Population with a Degree in Social Sciences in Washington?
Rockport has the Highest Percentage of Population with a Degree in Social Sciences in Washington with 100.0%.
What is the Percentage of Population with a Degree in Social Sciences in the State of Washington?
Percentage of Population with a Degree in Social Sciences in Washington is 9.3%.
What is the Percentage of Population with a Degree in Social Sciences in the United States?
Percentage of Population with a Degree in Social Sciences in the United States is 8.1%.